

Abstract
Prostate cancer antigen 3 (PCA3) is one of the most promising genes currently investigated as a specific tumor biomarker for the diagnosis of prostate cancer. The purpose of this study was to investigate PCA3 gene expression in peripheral blood of prostate cancer (PCa) and benign prostate hyperplasia (BPH), and further to assess its clinical significance. We determined the copies of PCA3 mRNA in peripheral blood of PCa and BPH from 115 samples (PCa, n = 78; BPH, n = 37) using a quantitative reverse transcriptase-quantitative polymerase chain reaction (RT-qPCR) with TaqMan assay. The sensitivity and specificity of PCA3 for the diagnosis of prostate cancer was compared with that of prostate-specific antigen (PSA) by receiver operating characteristic (ROC) curve analysis. To evaluate the association between PCA mRNA and disease progression, we analyzed PCA3 levels in connection with Gleason score and TNM stage of PCa. The clinical data revealed that expression of PCA3 gene was significantly higher in PCa than in BPH. Moreover, PCA3 mRNA was significantly higher in PCa patients with a Gleason score ≥8 than in those with a Gleason score ≤7 (P < .01). The results showed that the area under the curve (AUC) was 0.790, 0.606, and 0.620 for the copy number of PCA3, PSA level, and significantly free PSA (fPSA) level, respectively. Increased PCA3 in peripheral blood is correlated with PCa, and the detection of PCA3 may significantly reduce adverse screening outcomes. PCA3 gene expression in peripheral blood had a promising clinical application in the early diagnosis of PCa.
Introduction
Prostate cancer (PCa) was estimated to have the highest cancer incidence rate and one of the highest cancer mortality rates in men in the United States in 2017 [1]. Although morbidity from PCa is much lower in Asian countries, its incidence has increased at a tremendous rate over the past decade in the Asian male population [2], [3]. A recent report showed that the PCa mortality rate in Asia, particular in China, increased faster than in high-risk countries owing to changes in lifestyle, increased obesity, and westernization of diet [4], [5]. The conventional treatment for PCa consists primarily of radical surgery and radiotherapy. These treatments are effective for early-stage PCa that is localized within the prostate [6]. However, there is no available curative therapy for PCa with local or distant spread, resulting in a poor prognosis for these patients [7]. Thus, there is a pressing need for early diagnosis and treatment of PCa, and a tumor marker could provide an effective means for early diagnosis.
Prostate specific antigen (PSA) remains the most widely used biomarker in the management of patients with PCa but its use in detecting PCa early is limited. For example, PSA is often detected in prostatitis and benign prostate hyperplasia (BPH). Furthermore, approximately 15% patients with PSA levels below the cut-off value of 4 ng/mL had detectable PCa on biopsy [8]. Also, patients with enlarged prostate volume were shown to have elevated PSA levels [9]. The high false-positive rate on PSA examination could lead to unnecessary biopsies and over-diagnosis. Therefore, there is an urgent need for new biomarkers that are highly specific and sensitive for the diagnosis of PCa.
In recent years, new biomarkers have been proposed with the aim of improving detection of PCa and distinguishing aggressive from non-aggressive PCa. Prostate cancer antigen 3 (PCA3), a long non-coding RNA also known as DD3, which is located on the long arm of chromosome 9, had higher expression levels in PCa tissues than in adjacent non-cancerous tissues, and showed no detectable levels in normal tissue and other prostate-related diseases [10]. This specific characteristic of PCA3 makes it an ideal biomarker for prostate cancerization [11]. Other evidence supports PCA3 as a specific tumor marker for PCa. One study found that PCA3 detection moderately increased the diagnostic accuracy in Chinese patients undergoing first prostate biopsy with a PSA level of 4.0–10.0 ng/mL [12]. In addition, increased PCA3 mRNA levels correlated with PCa independently of PSA level [13]. Also when compared with total prostate-specific antigen (tPSA) and free PSA/total PSA ratio (f/tPSA), PCA3 test demonstrated the best diagnostic performance, promoting the selection of high-risk patients to allow for decreased prostatic puncture biopsy rate. Furthermore, the investigators found a significant association between PCA3 score values and Gleason score (Gs) (Gs ≤ 6 versus Gs ≥ 7) [14]. However, Alshalafa et al. found low PCA3 expression had a high prevalence of high grade tumors in the biopsy setting through analyzing the Decipher Genomic Resource Information Database (GRIDTM) prostate cancer database [15]. It may suggest that urologists should be warned when using PCA3 as a stand-alone predictor for PCa, which may lead to low rate of diagnosis of high grade disease in primary biopsies.
Future research should concentrate on independent verification of fluid-based biomarkers/models. Theoretically, peripheral blood and urine should be an ideal choice for monitoring malignant status of prostate epithelial cells. Marks et al. showed PCA3 molecular urine assay has an important role in prostate cancer diagnosis [16]. Recently, a multicenter study reported that PCA3/PSA RNA correlated with PCa progression [17]. Yet PCA3 gene expression in urine is susceptible to error owing to the different massage degrees of masseurs and the unhygienic extraction from urine samples. In addition, PCA3 mRNA could be detected in peripheral blood of PCa patients but not in healthy controls [18], indicating that PCA3 could be considered as an important tumor marker for PCa. The detection of PCA3 in prostate peripheral blood is a better method as a biomarker of PCa. In this study, we developed a TaqMan assay to examine the copies of PCA3 and PSA gene in peripheral blood and the correlation between PCA3 mRNA expression and progression of PCa.
Materials and Methods
Patients and Clinical Specimens
This study was executed by strictly following the protocol approved by the Institutional Review Board of the Affiliated Yantai Yuhuangding Hospital of Qingdao University. All blood specimens were obtained from consenting subjects. Blood samples were collected in BD PAXgene Blood RNA tube (Becton, Dickinson and Company, NJ, USA) and stored in aliquots at −80 °C. The samples were obtained from patients with PCa (n = 78) and patients with BPH patients (n = 37). PCa was confirmed by prostatic biopsy and histopathological evaluation to distinguish predominantly benign epithelial cells (in the case of BPH samples) from adenocarcinoma cells (in the case of PCa samples); two pathologists graded each tumor in accordance with the Gleason scoring system. The samples were chosen in the same geographical areas as the hospitals where the cases were collected, under the proposition of the national health insurance.
RNA Isolation and Reverse Transcription
Total RNA was isolated from peripheral blood using total-RNA isolation reagent PAXgene Blood RNA Kit (Qiagen, Hilden, Germany). The RNA quality and concentration was analyzed using NanoDrop 2000 spectrophotometer (Thermo, USA). In accordance with the manufacturer's instruction, cDNA was generated from the total RNA using the Quantitect Reverse Transcription Kit (Qiagen, Hilden, Germany).
Quantitative Polymerase Chain Reaction (q-PCR)
To investigate the copies of PCA3, we used q-PCR with TaqMan assay purchased from Qiagen. The standard curve was generated simultaneously by using corresponding recombinant expressed vector of PCA3 as a reference reagent. Each concentration point for standard curve generation was analyzed three times, while each sample was determined in multiple replicates. The gene-specific sequence information for the qPCR primers were as follows: PCA3 forward primer ACACAGGAAGCACAAAAGG and PCA3 reverse primer GATGACCCAAGATGGCGGC; β-actin forward primer CTGGACTTCGAGCAAGAGATG and β-actin reverse primer GAGTTGAAGGTAGTTTCGTGGA.
Statistical Analyses
We used Statistical Package for Social Sciences (SPSS, Version 19.0; Stanford, USA) for statistical analysis. To evaluate the sensitivity and specificity of the various biomarkers used in the diagnosis of prostate abnormalities, the receiver operating characteristic (ROC) curve analysis was performed, through the estimation of the area under the curve (AUC). The Mann–Whitney U-test, the Student's t-test and Pearson's chi-square test were used for statistical comparisons of the continuous and categorical variables. In patients with PCa, the same test was used to examine the significance of differences in marker values with Gleason scores ≤7, with Gleason scores ≥8, and with TNM stage. Logistic regression analysis of the data was conducted to double confirm the analysis results. Differences were considered to be statistically significant at a P-value <0.05.
Results
Development of Assays for Peripheral Blood PCA3 mRNA Examination
RNA was isolated in vitro and purified from blood. The ratio of OD260 over OD280 of RNA ranged from 1.8 to approximately 2.0. We randomly chose 20 samples to detect the separation of 28 s and 18 s fragments by agarose gel electrophoresis, and the clear 28 s and 18 s fragments were found (Figure 1A). We used recombinant expressed vector of PCA3 to generate a standard amplification curve. The PCA3 recombinant expressed vector was diluted by 10-fold gradient and subjected to qPCR with TaqMan assay. The linear range allocated from 1.0 to 1.0 × 10⁷ for PCA3. The amplification curve (Figure 1B) and the standard curve (Figure 1C) were generated and presented, and the slope was calculated as −0.293, R2 = 0.998. Therefore, the individual RNA was validated for quantification analysis of the PCA3 RNA in blood, as reference reagent.
Figure 1.

Generation of PCA3 and PSA standard curve. (A) The quality detection of PCA3 RNA from 20 samples randomly selected through running agarose gel electrophoresis. (B) Recombinant expressed PCA3 RNA was serially diluted 10-fold from 1.0 to 1.0 × 10⁷. RT-qPCR was conducted with TaqMan assay. The amplification curve was presented (B) and the standard curve was generated (C). The standard curve slope of PCA3 mRNA was calculated as −0.293, R2 = 0.998.
Patient's Characteristics
A total of 115 patients were included in this study. 78 (67.83%) had PCa and 37 (32.17%) had BPH on positive biopsy, as shown in Table 1. Patient's age ranged from 55 to 88 years (mean: 73 years for PCa patients and 69 years for BPH patients). The PCA3 expression by age did not differ significantly between the PCa patients and the BPH patients (P = .10). The mean PSA levels of patients with PCa and patients with BPH were 28.51 (SD: 18.22) ng/mL and 18.38 (SD: 23.15) ng/mL (P = .053), respectively. The mean free PSA (fPSA) levels in patients with PCa and in patients with BPH were 9.41 (SD: 12.31) ng/mL and 3.22 (SD: 7.56) ng/mL (P = .032), respectively. The PCA3 mRNA number was higher in PCa patients (2.43 ± 0.69) than in BPH patients (1.53 ± 0.54) (P < .01).
Table 1.
Clinical Characteristics of Men with Prostate Cancer and Benign Prostate Hyperplasia
| Characteristics | PCa | BPH | P value |
|---|---|---|---|
| Subjects, n | 78 | 37 | |
| Age, years | 72.57576 ± 6.91931 | 69.23333 ± 8.91989 | .10 |
| PSA, ng/ml | 28.51 ± 18.22040 | 18.37938 ± 23.14535 | .053 |
| fPSA, ng/ml | 9.40748 ± 12.30969 | 3.22174 ± 7.56253 | .032 |
| PCA3 log copy | 2.42595 ± 0.69175 | 1.53101 ± 0.53911 | <.01 |
PCa, prostate cancer; BPH, benign prostatic hyperplasia; PSA, prostate-specific antigen; fPSA, free PSA; PCA3, prostate cancer antigen 3.
Algorithm of Blood PCA3, PSA, and fPSA in Prostate Cancer Diagnosis
The ROC curve demonstrated the diagnostic performance of PCA3 mRNA, PSA and fPSA (Figure 2). For the sensitivity and specificity, the AUC of PCA3 mRNA was larger than that of PSA and fPSA. ROC curve analysis demonstrated that there was no significant difference in AUC between PCA3 mRNA versus PSA (P = .067). The AUC of fPSA was higher than that of PSA (P = .039) but was not higher than that of PCA3. Detailed results in terms of sensitivity and specificity are shown in Table 2.
Figure 2.
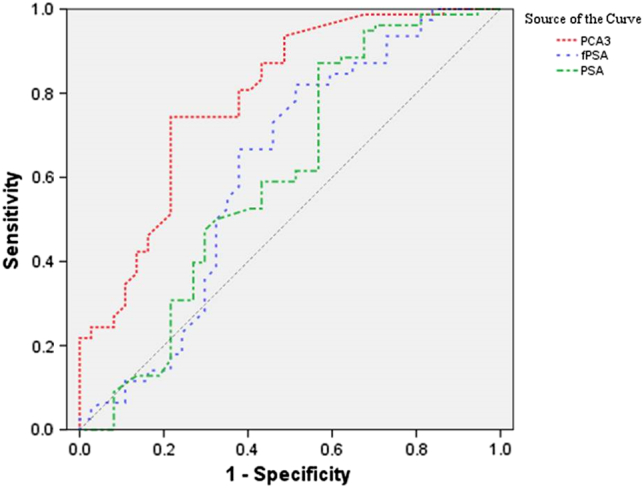
The ROC curve of blood PCA3 log copy number, PSA, and fPSA for detecting prostate cancer. PCA3: prostate cancer gene 3; PSA: prostate-specific antigen; ROC: receiver operating characteristic.
Table 2.
Comparison of Area under the Curve for PCA3 Log Copy Number, PSA, and fPSA in Patients
| Variable | AUC | P value | 95% CI |
|---|---|---|---|
| PSA, ng/ml | 0.606 | .067 | 0.484–0.728 |
| fPSA, ng/ml | 0.620 | .039 | 0.498–0.742 |
| PCA3 log copy | 0.790 | .000 | 0.679–0.882 |
AUC, area under the curve; CI, Confidence interval; PSA, prostate-specific antigen; fPSA, free PSA; PCA3, prostate cancer antigen 3.
PCA3 mRNA in the diagnosis of high-grade prostate cancer
To evaluate the association between PCA mRNA and disease progression, we analyzed the PCA3 levels in connection with Gleason score and TNM stage of PCa. Among the samples with PCa, the distribution of Gleason score by pathologic analysis was as follows: Gleason score ≤7 (n = 42); and Gleason score ≥8 (n = 36). The PCA3 mRNA was higher in PCa patients with a Gleason score ≥8 than in patients with a Gleason score ≤7 (P < .01, Figure 3A), demonstrating that PCA3 mRNA was positively correlated with Gleason score. TNM stage was also considered during our analysis. We found PCA3 mRNA was increased with higher TNM stage. Though no significant difference was seen in TNM 3–4 tumors (n = 47) when compared with TNM 1–2 tumors (n = 31) (P = .24), there was a tendency toward increased PCA3 mRNA with the increased TNM stage. Also there was a significant difference between TNM1 tumors (n = 23) and TNM2 tumors (n = 9) (Figure 3B).
Figure 3.

Correlation of PCA3 mRNA with Gleason score and TNM staging. (A) PCA3 expression was higher in Gleason score ≤7 than in Gleason score ≥8 (P < .01). (B) PCA 3 expression levels in prostate cancer in connection with TNM status (P = .24).
Discussion
Currently, serum PSA levels are used to screen for PCa. However, the specificity of PSA for detecting PCa is low, and, therefore, the risk of unnecessary biopsy remains substantial [19]. Thus, it remains a challenge to explore and develop novel biomarkers to predict risk and detect a diagnostic signature of PCa.
Serial analysis showed thatPCA3 mRNA, a prostate-specific non-coding gene, was significantly and especially up-regulated in most PCa. Unlike PSA, PCA3 mRNA appears to be less influenced by patient age, prostate inflammation, prostate volume, trauma, or prior biopsies [20]. Currently, PCA3 mRNA is typically investigated in puncture biopsy and urine. In 2002, De Kok et al. reported PCA3 was overexpressed in 95% of PCa tissues compared with normal cancer tissues from the same patients [21]. Also, PCA3 was found to be up-regulated in PCa tissues compared with normal prostate tissues [22]. In urine, several cancer products that are released through prostate ducts act as cell-free markers [23]. Researchers found that PCA3 mRNA transcripts could be detected and quantified in urine [20]. In addition, another study showed that both PCA3 copy number alone and PCA3/PSARNA ratio were significantly higher in the PCa group than in the BPH group, while neither PSA nor serum tPSA levels were significantly different between these two groups [24]. However, limitations to the evaluation of PCA in biopsy tissue and urine exist, including increased unnecessary puncture biopsy and lacked of standardization in acquisition of the sample, respectively. Unlike with urine, the detection of PCA3 levels in blood as sequentially proposed and then clinically conducted is sanitary and convenient. One study showed that PCA3 nucleic acid was amplified positively in all nine PCa patients, PSA positivity was found in eight patients, and no PCA3 expression was seen in healthy individuals, which suggested that peripheral blood PCA3 could provide improved specificity and sensitivity for PCa diagnosis compared with PSA [25].
In this study, we evaluated the peripheral blood PCA3 assay as a new tumor marker in facilitating the diagnosis of PCa. We found that PCA3 mRNA expression was significantly higher in PCa than in BPH (Table 1). In contrast, no significant difference in PSA levels was found between the groups (P = .053). fPSA levels were significantly higher in PCa than in BPH. Our sample size was limited, so the differences among the three groups were not very obvious. Increased sample size could improve the specificity.
The ROC curve is an effective way to assess the sensitivity and specificity of several biomarkers for the diagnosis of prostate abnormalities. Recently, a report found the sensitivity and specificity of PCA copy number for diagnosing PCa is higher than that of PSA copy number, as determined by RT-qPCR with Taqman assay. Furthermore, the PCA3/PSA RNA score diagnostic efficiency is higher than PCA3 and PSA RNA [26]. In our study, we examined the sensitivity and specificity of PCA3 RNA, PSA, and fPSA levels for the diagnosis of PCa. The AUC of PCA3 was the largest among the three groups (Figure 2). It demonstrated that PCA3 was a more suitable biomarker for PCA diagnosis. Yet our AUC data was slightly lower than in some other studies and did not illustrate a significant benefit of PCA3 test [12], [27]. This decrease of statistical power may be explained by the restricted proportion of negative biopsy. The association between the PCA3 expression levels and Gleason score is an important factor under consideration. A similar pattern, detected for the relationship between the PCA3 score and Gleason score, illustrated an increasing PCA3 score with a worsening Gleason score [28], [29]. Studies evaluating patients undergoing radical prostatectomy demonstrated an association between tumor volume, PCA3 score, and Gleason score [30]. In our study, a significant difference was found between Gleason score ≤ 7 (n = 42) and Gleason score ≥ 8. However, our finding did not confirm the difference of PCA3 mRNA in TNM staging. This discrepancy could be explained by the smaller sample size of PCa patients (Figure 3).
Several limitations in this study must be acknowledged. It is unfair to compare the performance of PCA3 with PSA because some patients with elevated PSA levels received an unnecessary puncture biopsy. Our sample size was small, and more cases are needed to validate the results of this study.
In conclusions, the detection of PCA3 improved diagnostic accuracy in patients with PCa and decreased unnecessary puncture biopsy. And the diagnostic specificity and sensitivity of PCA3 was higher than that of PSA. Therefore, to provide a more convenient and effective method for PCa screening, the diagnostic significance of peripheral blood PCA3 will be explored in a future study.
Acknowledgments and Funding Support
The present work was supported by National Natural Science Foundation of the People's Republic of China (Nos. 81,372,367. Nos 81,402,292).
Conflict of Interest
The authors declare no conflicts of interest.
Contributor Information
Yulian Zhang, Email: Zhyl0914@sina.com.
Ke Wang, Email: wangke6910@sina.com.
References
- 1.Gomella L. Prostate Cancer Statistics: Anything You Want Them To Be. Can J Urol. 2017;24(1):8603–8604. [PubMed] [Google Scholar]
- 2.Kimura T. East meets West: ethnic differences in prostate cancer epidemiology between East Asians and Caucasians. Chin J Cancer. 2012;31(9):421–429. doi: 10.5732/cjc.011.10324. [DOI] [PMC free article] [PubMed] [Google Scholar]
- 3.Pakzad R, Mohammadian-Hafshejani A, Ghoncheh M, Pakzad I, Salehiniya H. The incidence and mortality of prostate cancer and its relationship with development in Asia. Prostate Int. 2015;3(4):135–140. doi: 10.1016/j.prnil.2015.09.001. [DOI] [PMC free article] [PubMed] [Google Scholar]
- 4.Neupane S, Bray F, Auvinen A. National economic and development indicators and international variation in prostate cancer incidence and mortality: an ecological analysis. 2017;35(6):851–858. doi: 10.1007/s00345-016-1953-9. [DOI] [PubMed] [Google Scholar]
- 5.Ito K. Prostate cancer in Asian men. Nat Rev Urol. 2014;11(4):197–212. doi: 10.1038/nrurol.2014.42. [DOI] [PubMed] [Google Scholar]
- 6.Pound CR, Partin AW, Epstein JI, Walsh PC. Prostate-specific antigen after anatomic radical retropubic prostatectomy. Patterns of recurrence and cancer control. Urol Clin North Am. 1997;24(2):395–406. doi: 10.1016/s0094-0143(05)70386-4. [DOI] [PubMed] [Google Scholar]
- 7.Lu-Yao GL, McLerran D, Wasson J, Wennberg JE. An assessment of radical prostatectomy. Time trends, geographic variation, and outcomes. The Prostate Patient Outcomes Research Team. JAMA. 1993;269(20):2633–2636. doi: 10.1001/jama.269.20.2633. [DOI] [PubMed] [Google Scholar]
- 8.Thompson IM, Pauler DK, Goodman PJ, Tangen CM, Lucia MS, Parnes HL, Minasian LM, Ford LG, Lippman SM, Crawford ED. Prevalence of prostate cancer among men with a prostate-specific antigen level < or =4.0 ng per milliliter. N Engl J Med. 2004;350(22):2239–2246. doi: 10.1056/NEJMoa031918. [DOI] [PubMed] [Google Scholar]
- 9.Bohnen AM, Groeneveld FP, Bosch JL. Serum prostate-specific antigen as a predictor of prostate volume in the community: the Krimpen study. Eur Urol. 2007;51(6):1645–1652. doi: 10.1016/j.eururo.2007.01.084. [discussion 52-3] [DOI] [PubMed] [Google Scholar]
- 10.Bussemakers MJ, van Bokhoven A, Verhaegh GW, Smit FP, Karthaus HF, Schalken JA, Debruyne FM, Ru N, Isaacs WB. DD3: a new prostate-specific gene, highly overexpressed in prostate cancer. Cancer Res. 1999;59(23):5975–5979. [PubMed] [Google Scholar]
- 11.Hendriks RJ, van Oort IM, Schalken JA. Blood-based and urinary prostate cancer biomarkers: a review and comparison of novel biomarkers for detection and treatment decisions. Prostate Cancer Prostatic Dis. 2017;20(1):12–19. doi: 10.1038/pcan.2016.59. [DOI] [PubMed] [Google Scholar]
- 12.Wang FB, Chen R, Ren SC, Shi XL, Zhu YS, Zhang W, Jing TL, Zhang C, Gao X, Hou JG. Prostate cancer antigen 3 moderately improves diagnostic accuracy in Chinese patients undergoing first prostate biopsy. Asian J Androl. 2017;19(2):238–243. doi: 10.4103/1008-682X.167715. [DOI] [PMC free article] [PubMed] [Google Scholar]
- 13.Huang J, Reilly KH, Zhang HZ, Wang HB. Clinical evaluation of prostate cancer gene 3 score in diagnosis among Chinese men with prostate cancer and benign prostatic hyperplasia. BMC Urol. 2015;15:118. doi: 10.1186/s12894-015-0110-x. [DOI] [PMC free article] [PubMed] [Google Scholar]
- 14.Merola R, Tomao L, Antenucci A, Sperduti I, Sentinelli S, Masi S, Mandoj C, Orlandi G, Papalia R, Guaglianone S. PCA3 in prostate cancer and tumor aggressiveness detection on 407 high-risk patients: a National Cancer Institute experience. J Exp Clin Cancer Res. 2015;34:15. doi: 10.1186/s13046-015-0127-8. [DOI] [PMC free article] [PubMed] [Google Scholar]
- 15.Alshalalfa M, Verhaegh G, Gibb E, Santiago-Jiménez M, Erho N, Jordan J, Yousefi K, Lam LLC, Kolisnik T, Chelissery J. Low PCA3 expression is a marker of poor differentiation in localized prostate tumors: exploratory analysis from 12,076 patients. Oncotarget. 2017;8(31):50804–50813. doi: 10.18632/oncotarget.15133. [DOI] [PMC free article] [PubMed] [Google Scholar]
- 16.Wang J, Gildea JJ, Yue W. Aromatase overexpression induces malignant changes in estrogen receptor alpha negative MCF-10A cells. Oncogene. 2013;32(44):5233–5240. doi: 10.1038/onc.2012.558. [DOI] [PubMed] [Google Scholar]
- 17.Yazer MH, Triulzi DJ. Immune hemolysis following ABO-mismatched stem cell or solid organ transplantation. Curr Opin Hematol. 2007;14(6):664–670. doi: 10.1097/MOH.0b013e3282e9a576. [DOI] [PubMed] [Google Scholar]
- 18.Dijkstra S, Leyten G, Jannink S, de Jong H, Mulders P, van Oort I, Schalken JA. KLK3, PCA3, and TMPRSS2-ERG expression in the peripheral blood mononuclear cell fraction from castration-resistant prostate cancer patients and response to docetaxel treatment. Prostate. 2014;74(12):1222–1230. doi: 10.1002/pros.22839. [DOI] [PubMed] [Google Scholar]
- 19.Nath A, Singh JK, Vendan SE, Priyanka, Sinha S. Elevated level of prostate specific antigen among prostate cancer patients and high prevalence in the Gangetic zone of Bihar, India. Asian Pac J Cancer Prev. 2012;13(1):221–223. doi: 10.7314/apjcp.2012.13.1.221. [DOI] [PubMed] [Google Scholar]
- 20.Salagierski M, Schalken JA. Molecular diagnosis of prostate cancer: PCA3 and TMPRSS2:ERG gene fusion. J Urol. 2012;187(3):795–801. doi: 10.1016/j.juro.2011.10.133. [DOI] [PubMed] [Google Scholar]
- 21.de Kok JB, Verhaegh GW, Roelofs RW, Hessels D, Kiemeney LA, Aalders TW, Swinkels DW, Schalken JA. DD3(PCA3), a very sensitive and specific marker to detect prostate tumors. Cancer Res. 2002;62(9):2695–2698. [PubMed] [Google Scholar]
- 22.Hessels D, Klein Gunnewiek JM, van Oort I, Karthaus HF, van Leenders GJ, van Balken B, Kiemeney LA, Witjes JA, Schalken JA. DD3(PCA3)-based molecular urine analysis for the diagnosis of prostate cancer. Eur Urol. 2003;44(1):8–15. doi: 10.1016/s0302-2838(03)00201-x. [discussion -6] [DOI] [PubMed] [Google Scholar]
- 23.Truong M, Yang B, Jarrard DF. Toward the detection of prostate cancer in urine: a critical analysis. J Urol. 2013;189(2):422–429. doi: 10.1016/j.juro.2012.04.143. [DOI] [PMC free article] [PubMed] [Google Scholar]
- 24.Coelho FF, Guimaraes FL, Cabral WL, Salles PG, Mateo EC, Nogueira e Nogueira LM, Fonseca CE, Gomes KB. Expression of PCA3 and PSA genes as a biomarker for differential diagnosis of nodular hyperplasia and prostate cancer. Genet Mol Res. 2015;14(4):13519–13531. doi: 10.4238/2015.October.28.13. [DOI] [PubMed] [Google Scholar]
- 25.Vaananen RM, Rissanen M, Kauko O, Junnila S, Vaisanen V, Nurmi J, Alanen K, Nurmi M, Pettersson K. Quantitative real-time RT-PCR assay for PCA3. Clin Biochem. 2008;41(1-2):103–108. doi: 10.1016/j.clinbiochem.2007.10.009. [DOI] [PubMed] [Google Scholar]
- 26.Wang T, Qu X, Jiang J, Gao P, Zhao D, Lian X, Li X. Diagnostic significance of urinary long non-coding PCA3 RNA in prostate cancer. Oncotarget. 2017 doi: 10.18632/oncotarget.17272. [DOI] [PMC free article] [PubMed] [Google Scholar]
- 27.Zhou Y, Li Y, Li X, Jiang M. Urinary Biomarker Panel to Improve Accuracy in Predicting Prostate Biopsy Result in Chinese Men with PSA 4-10 ng/mL. 2017;2017:2512536. doi: 10.1155/2017/2512536. [DOI] [PMC free article] [PubMed] [Google Scholar]
- 28.De Luca S, Passera R, Cattaneo G, Manfredi M, Mele F, Fiori C, Bollito E, Cirillo S, Porpiglia F. High prostate cancer gene 3 (PCA3) scores are associated with elevated Prostate Imaging Reporting and Data System (PI-RADS) grade and biopsy Gleason score, at magnetic resonance imaging/ultrasonography fusion software-based targeted prostate biopsy after a previous negative standard biopsy. BJU Int. 2016;118(5):723–730. doi: 10.1111/bju.13504. [DOI] [PubMed] [Google Scholar]
- 29.Cui Y, Cao W, Li Q, Shen H, Liu C, Deng J, Xu J, Shao Q. Evaluation of prostate cancer antigen 3 for detecting prostate cancer: a systematic review and meta-analysis. Sci Rep. 2016;6:25776. doi: 10.1038/srep25776. [DOI] [PMC free article] [PubMed] [Google Scholar]
- 30.De Luca S, Passera R, Bollito E, Milillo A, Scarpa RM, Papotti M, Coda R, Randone DF. Biopsy and radical prostatectomy pathological patterns influence Prostate cancer gene 3 (PCA3) score. Anticancer Res. 2013;33(10):4657–4662. [PubMed] [Google Scholar]