Abstract
Griffiths phases (GPs), generated by the heterogeneities on modular networks, have recently been suggested to provide a mechanism, rid of fine parameter tuning, to explain the critical behavior of complex systems. One conjectured requirement for systems with modular structures was that the network of modules must be hierarchically organized and possess finite dimension. We investigate the dynamical behavior of an activity spreading model, evolving on heterogeneous random networks with highly modular structure and organized non-hierarchically. We observe that loosely coupled modules act as effective rare-regions, slowing down the extinction of activation. As a consequence, we find extended control parameter regions with continuously changing dynamical exponents for single network realizations, preserved after finite size analyses, as in a real GP. The avalanche size distributions of spreading events exhibit robust power-law tails. Our findings relax the requirement of hierarchical organization of the modular structure, which can help to rationalize the criticality of modular systems in the framework of GPs.
Introduction
A recurrent feature of complex systems is the presence of critical states, in which spatial and temporal correlations diverge1,2. A fundamental question is why and how a complex system would be tuned to criticality3–5. As a very important example, recent experimental evidences suggest that the brain operates near criticality5–8. Information processing capabilities, sensitivity and the dynamic range of stimuli, where the collective response varies significantly, are optimal in this region9–12. Simple models on homogeneous substrates5,13 have frequently been used to answer this question and criticality is often associated with some self-organization3 or evolutionary selection mechanism14. However, heterogeneity of the networks mediating the interactions among the agents of a dynamical process can be relevant for the outcomes of models investigated on them15–17, in particular, the quasi-static (quenched) disorder, with timescales much longer than those of the dynamics. Thus, it is a challenge to understand how quenched disorder originated from the heterogeneous network topology affects the observed critical state.
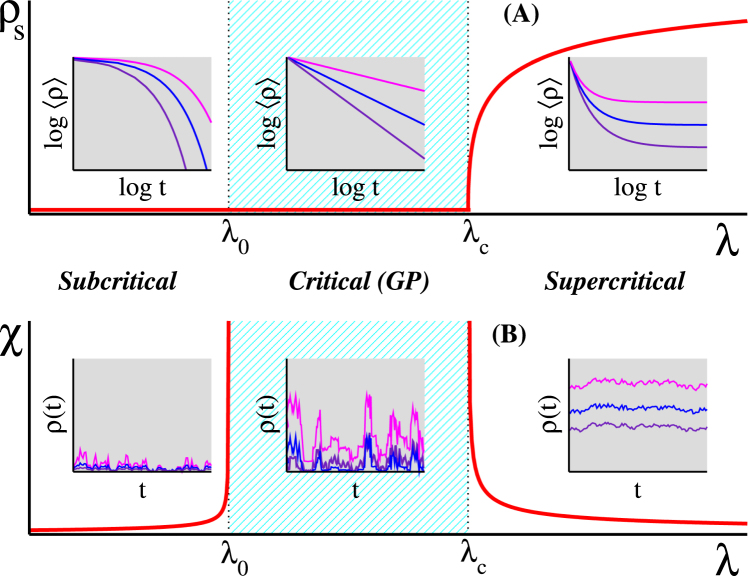
In condensed matter physics, quenched disorder can lead to the so-called Griffiths phases (GPs)18 with dynamical criticality and high sensitivity to external stimuli in an extended parameter space19. Dynamical criticality means long-term temporal correlations that imply slow relaxation and broad distributions of interevent times manifested usually as power laws (PLs)2,20. GP is the consequence of rare regions (RRs), consisting of local (sub-extensive) supercritical (active) domains, which occur with small probability but sustaining activity for long times (exponential in domain size). To understand GPs in critical dynamics, consider a dynamical spreading process with active and inactive states, a control parameter λ and an order parameter ρ (density of active individuals) determining the system phase. Inactive states are also called “absorbing” because, once visited, no other state can be reached from it without an external source20. The system is in a globally active phase for λ > λc, with a non-zero order parameter as t → ∞, or in an inactive one, for λ < λ0 with ρ = 0, for t → ∞. Long lived RRs are absent in the latter case19. Response functions, which quantify the sensitivity to external stimuli, are finite in both ranges; see Fig. 1. In the interval λ0 < λ < λc, the activity in RRs is long lived, but ends up due to the fluctuations in the finite sized local patches. Convolution of low-probability RRs and exponentially long lifetimes results in a slow relaxation and highly fluctuating dynamics characterized by nonuniversal exponents in this interval, constituting a GP19. Response functions become very large (formally infinite in the thermodynamic limit) in this range and the system exhibits hypersensitivity to external stimuli. Figure 1 shows a scheme for GPs and dynamical criticality. A central question is if the RR effects are strong enough to alter the phase transition21.
Figure 1.
Griffiths phases and dynamical criticality in spreading processes. The top panel shows the stationary order parameter ρs, which is the average density of active vertices, against the control parameter λ. The order parameter has a finite value above the critical point λc and vanishes as λ → λc. The stationary density is zero for λ < λ0. In both regimes, the characteristic times to reach the stationary state are finite, typically given by exponential decays in the curves of average density against time. The asymptotic density is still null in the critical region, but the approaching to the asymptotic value is slow, typically a power-law time decay, manifested by straight lines on log-log plots. The bottom panel shows the stationary dynamical susceptibility29,30, defined as the relative variance of the order parameter, given by χ = N[〈ρ2〉 − 〈ρ〉2]/〈ρ〉, against the infection rate under the presence of a small external stimulus, which can be a spontaneous self-activation65. Sub and supercritical phases present finite susceptibility diverging as we approach the critical region, in which it remains infinite. The fluctuations are finite in the off-critical interval and huge within the whole critical region, representing high sensitivity to external stimuli. The subcritical, critical and supercritical regimes are schematically represented in the left, center, and right insets, respectively.
Critical systems can be sensitive to quenched disorder when their dimension is sufficiently low19. A hypothesis based on activity spreading models claims that the heterogeneity effects become irrelevant in the thermodynamic limit in case of infinite-dimensional random graphs22. The dimension dg of a graph is given by the relation between the average number of nodes enclosed in a distance l, such that . For small-word networks, for which distances increase logarithmically with the graph size23, we formally have dg = ∞. Some evidences suggest that the brain network is heterogeneous and present hierarchical modular organization, in which modules are themselves composed by modular substructures at distinct levels10,24,25. These inspired Moretti and Muñoz26 to investigate activity spreading models on hierarchical modular networks of finite dimension, for which GPs and extended critical regions were observed (see also27,28) and to conjecture that the brain criticality could be effected by quenched disorder without fine parameter tuning. It does not mean that one cannot find relevant effects in finite non-modular systems29–31. Moreover, long-range connections can drastically increase the network dimension, even if they constitute just a small portion of the graph32,33. The empirical organization of biological networks is highly complex and subjective10 and, therefore, it is not completely clear whether real brain networks in a cellular level are actually hierarchical34. Furthermore, modular graphs without hierarchical structure are observed in diverse important systems such as socio-technological35,36 or protein interaction networks37, but the existence of extended critical regions due to the quenched disorder on such systems has not been considered extensively.
To our knowledge, no investigation has been done to scrutinize whether hierarchy is really a necessary condition for the emergence of GPs. The present work aims at to fill this gap, using simulations of activity spreading models on non-hierarchical modular structures. Recently, optimal fluctuation theory31 and simulations provided extended critical regions on heterogeneous networks of finite size constrained to averages over independent network samples30. This inspired us to investigate the dynamical behavior of the continuous time Markovian susceptible-infected-susceptible (SIS) model, which has been used to describe activity or information spreading in socio-technological and biological systems26,38–40, on loosely coupled network of modules. We found extended control parameter regions with non-universal PL decays of activity in time, which are size-independent, calling for the existence of real GPs in infinite dimensional, but loosely connected modular structures. Thus, our results point out that we can relax the requirement of hierarchical organization and large-world22,26 for the existence of GPs on modular networks, although these factors certainly enhance RR effects.
Results
Synthetic modular networks
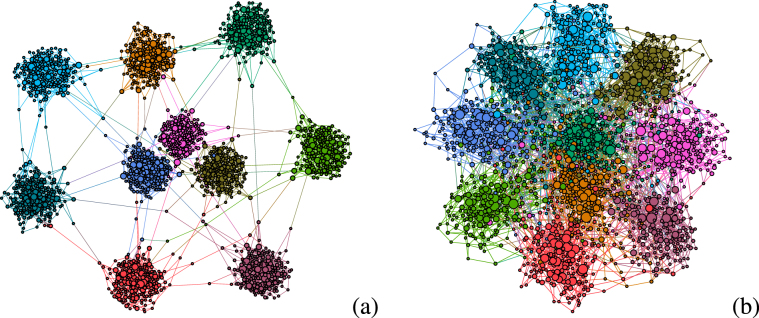
We generated modular networks based on the benchmark model of Lancichinetti, Fortunato, and Radicchi41. Consider g = 1, …, M modules where the size Sg of each group is drawn according to a distribution Q(Sg). At a vertex level, the degrees are drawn from a distribution P(k) with where and are lower and upper cutoffs of the degree distribution, respectively. The maximal number of intermodular edges connecting vertices of different groups is predefined as and, in general, can depend on the module. By construction, this model produces highly modular networks if the number of intermodular connections is much smaller than the intramodular one, which was confirmed by the calculation of the modularity coefficient42 and using the Louvain community detection algorithm43. See section Methods for network metrics and generation procedure. Figure 2 shows examples of modular networks with different levels of intermodular connectivity.
Figure 2.
Examples of modular structures. Networks with M = 10 modules of same size S = 200 and number of intermodular connections (a) and (b) 100 representing loosely and densely connected modular graphs, respectively. The network degree distribution is given by with and for the lower and upper bounds cutoffs, respectively. Connected modular structures can clearly be observed. Nodes in a same community are plotted with the same color and their sizes are proportional to the vertex degree. The graph was generated using Gephi visualization tool (https://gephi.org).
Depending on the module size distribution Q(Sg), we divided the investigated networks into two classes. In the monodisperse modular networks (MMNs), all modules have exactly the same number of vertices and of intermodular connections, i.e. Sg = S and for g = 1, …, M. However, real modular networks are not monodisperse in the aforementioned sense and, thus, we also considered a PL distribution of module size with , which are consistent with observations in real systems41. The upper bound of the distribution is limited to the system size (Sg ≤ N) while the lower one is chosen such that the average module size 〈Sg〉 has a predefined value. These networks are referred hereafter as polydisperse modular networks (PMNs). We also chose the number of intermodular connections proportional to the module size, , constraining , to guarantee connectivity23. We used the values of 〈Sg〉 = 103 and in all presented results to perform comparison between monodisperse and polydisperse cases. Brain networks, which inspired our research, are not fully random like those presented here, but our aim was to isolate the role played by the network dimensionality.
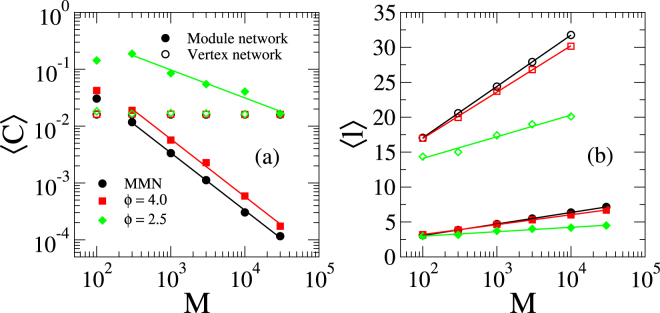
We determined the average clustering coefficient and the average shortest mean distance23 for both vertex and module networks. The latter means that we treat modules as vertices, connected by intermodular edges forming a network. Structural properties of these modular networks are shown in Fig. 3. The clustering coefficient, averaged over the whole network, saturates at a small finite value as the network size increases (see Fig. 3(a)). This is a natural consequence of the modular organization of the network that forces vertices to be connected mostly within the modules which are of finite size and thus the probability to form triangles is not negligible. The clustering coefficient of the network of modules vanishes as in the cases of ϕ = 4.0 and MMNs, while it vanishes as for ϕ = 2.5. Hierarchically organized networks are clustered with coefficient independent of the size44. So, the analysis of Fig. 3 shows the lack of hierarchy in the modular networks of our investigation.
Figure 3.
Structural properties of modular networks. (a) Clustering coefficient and (b) average shortest path as functions of the number of modules. Open symbols correspond to the vertex network, while the filled ones represent the network of modules, in which the modules are themselves treated as nodes connected by the intermodular edges. Lines denote (a) power-law or (b) logarithmic regressions. In monodisperse modular networks (MMN), all modules have the same number of vertices S = 〈Sg〉. Networks with module size distribution are obtained by fixing the minimal size Smin such that the chosen average size is obtained. The parameters are , 〈Sg〉 = 103, γ = 2.7, , and ; see main text. The averages were performed over 25 independent networks.
The average shortest path is defined as the average minimal graph distance among every pair of vertices42. For the presented modular networks, this increases logarithmically with the size as shown in Fig. 3(b) and Table 1. So, the investigated networks have infinite dimension besides the lack of hierarchy.
Table 1.
Logarithmic regressions for the average shortest distance in modular networks.
| Vertex networks | Module networks | |
|---|---|---|
| MMN | 〈l〉 = 2.35 + 3.19ln(M) | 〈l〉 = −0.22 + 0.71ln(M) |
| ϕ = 4.0 | 〈l〉 = 3.67 + 2.88ln(M) | 〈l〉 = 0.37 + 0.61ln(M) |
| ϕ = 2.5 | 〈l〉 = 7.91 + 1.35ln(M) | 〈l〉 = 1.73 + 0.272ln(M) |
We analyzed both the original vertex network and the one where modules are considered as vertices connected only by the intermodular edges. Correlation coefficient of the regressions is r2 > 0.999 for MMN and ϕ = 4.0, while r2 = 0.99 for ϕ = 2.5.
Epidemic process on modular networks
We ran time dependent simulations of SIS dynamics, in which an infected (active) vertex i spontaneously heals (inactivates) with rate μi and infects each of its susceptible nearest neighbors with rate λi. We used the statistically exact and optimized Gillespie algorithm detailed elsewhere45 with different initial conditions: decay from fully infected initial states and spreading simulations started from a single infected vertex46; see Methods’ section. Finite size effects were investigated using networks of size N ≈ M〈Sg〉 with M = 103, 104 and 3×10⁴ modules, remembering that 〈Sg〉 = 103 was adopted in all cases.
In the SIS dynamics, the transition point is governed by the long-term self activation of hubs and their mutual reactivation through connected paths47–49, such that it presents a null threshold in case of PL networks in the infinite size limit with . In order to deal with a finite threshold in the thermodynamic limit, we considered two types of disorders called hereafter topological or intrinsic disorder. The vertex degrees are distributed according to a truncated PL with , and γ = 2.7 in the case of topological disorder. Infection and healing rates λi = λ and μi = 1 (fixing the time scale) are uniform for all edges and vertices, respectively, and the disorder is due to vertex degree variability. We considered P(k) = δk,4 for the intrinsic disorder case, such that each module forms a random regular network (RRN)50, in which every vertex has the same degree but the connections are random. Since topological disorder is negligible in this RRNs, the intrinsic disorder is introduced in the healing rates μi of each vertex i that take binary values 1 − ε or 1 + ε with equal chance, while the infection rate is still uniform with λi = λ. Note that, when investigated on homogeneous degree networks such as RRNs, the SIS is equivalent to the contact process51 used in previous studies of GPs on networks22,27,52,53.
Density decay analysis
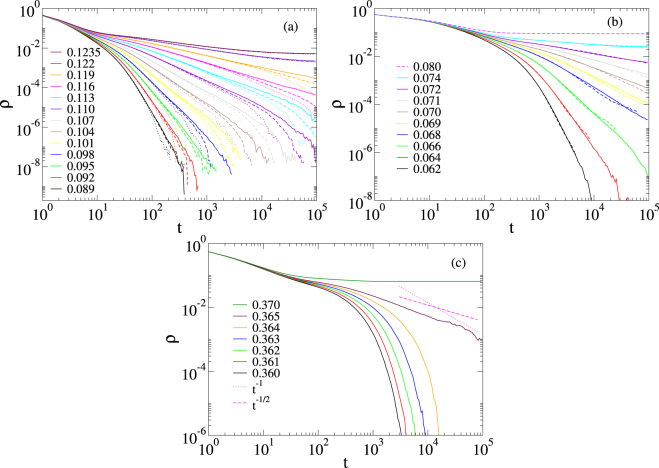
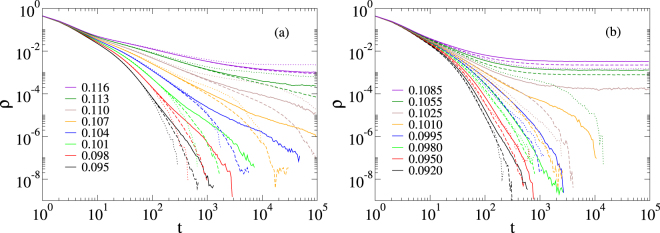
We show the density decays for a given realization of a MMN for three models of disorder in Fig. 4. Similar results were found for the other analyzed network realizations (up to 20). For the topological disorder, a finite size analysis increasing the number of modules is presented in Fig. 4(a). The curves reveal non-universal PLs in the 0.089 ≤ λ < 0.12 extended region, which do not change within statistical error margins as the number of modules increases from M = 103 to 3×10⁴. Thus, contrary to the case of SIS on non-modular PL networks30, we see a GP behavior. It is important to mention that the critical regimes hold for intermediate times since the networks are still finite. Furthermore, the analysis provides numerical evidences that the transition point is also size independent. The case of strong intrinsic disorder given by ε = 0.9, shown in Fig. 4(b), also presents extended region of critical behavior with non universal PLs preserved as the sizes are increased. It is worth noting that the SIS dynamics on MMNs without intrinsic nor topological disorder (μi = 1), shown in Fig. 4(c), does not show GPs and the critical behavior is given by , instead of a regular mean-field decay20 . This was also found in generalized small-world networks for which the GP shrank to a very narrow region52. We also investigated weaker intrinsic disorder using ε = 0.5 and observed GPs in several networks realizations, but in others they were weak or absent. However, when we performed disorder realization averaging, GPs became evident for both values of ε (see Supplementary Information for figures).
Figure 4.
Density decay on a single MMN. (a) Decay analysis for SIS with topological disorder introduced by a degree distribution and . The numbers of modules are M = 103 (dotted lines), M = 104 (dashed lines), and M = 3 × 10⁴ (solid lines). Legends indicate the values of λ. (b) Decay analysis for SIS with intrinsic disorder (ε = 0.9) on MMNs of sizes M = 103 (dashed lines) and M = 104 (solid lines) where the modules are themselves RRNs. (c) SIS decay without intrinsic disorder (ε = 0) on a single MMN of M = 103 modules, each one consisting of a RRN.
We investigated the effects of module size variability considering PMNs with topological disorder only. These exhibit the same truncated PL for degree distribution and average sizes of modules as those of MMNs to permit a comparison. In Fig. 5(a), we show extended regions of λ with PL tails in the density time decays for ϕ = 4.0, which corresponds to a heterogeneous, but finite variance distribution. These results look qualitatively similar to those of the MMN case. Finite size effects are stronger, but a GP occurs in the interval 0.095 < λ < 0.115, which is narrower than in the monodisperse case. Noticeably, GPs are not observed for the scale-free case with ϕ = 2.5 shown in Fig. 5(b), in which modules of essentially every size appear. A finite variance of Q(Sg) reduces the RR effects in comparison with MMNs, since some large modules have many intermodular connections reducing their independence. For an infinite variance the situation becomes drastic. A single module can contain a considerable large fraction of the whole network and alone rules the critical dynamics of the system becoming equivalent to the non-modular case30,54,55. Once we have established under which conditions of module size variability the GPs are robust, in the rest of the paper we consider only the case of MMNs, stressing that the central conclusions are the same as in the case of a finite variance in the module size distribution.
Figure 5.
Density decay for SIS with topological disorder on a single PMN. The module size distributions with exponents (a) ϕ = 4.0 and (b) ϕ = 2.5 are shown. The finite size analysis is done using M = 103 (dotted lines), 104 (dashed lines), and 3×10⁴ (solid lines). Other network parameters are given in text and the values of λ indicated in the legends.
Spreading analysis
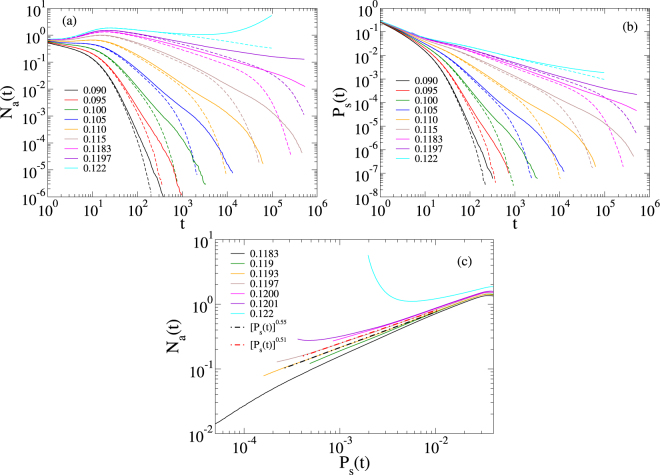
Figure 6(a) shows the number of active vertices as a function of time in spreading simulations on a MMN. For regular dynamical criticality, this quantity is expected to evolve as Na(t) ∝ tη. One can see non-universal PL tails in a range similar to the one found in the density decays, including a similar exponential cutoff for long times due to the finite size of the networks. The survival probability curves, Ps(t), exhibit a very similar behavior [Fig. 6(b)] with the same exponents as those of the ρ(t) decays at a given λ within the critical region, expressing that the rapidity reversal symmetry20,56 is unbroken by the quenched disorder. This symmetry implies, for example, that the asymptotic probability (t → ∞) to find one infected vertex at a randomly chosen location is weakly dependent on the initial condition or, more precisely, ρ(t) ∝ Ps(t).
Figure 6.
Spreading analysis for SIS on a single MMN. Only topological disorder is introduced as a truncated PL with . Finite size analyses of the (a) number of active nodes and (b) survival probability are done with M = 103 (dashed lines) and 104 (solid lines) modules. (c) Determination of the transition point in a double logarithmic plot of Na(t) vs Ps(t) for M = 104 modules. Infection rates are indicated in the legends.
Due to the extended interval with PLs and the corrections, it is hard to estimate the transition point location and the time decay functional form accurately. Simple PL fitting results in Ps(t) ∝ t−δ with δ = 0.42(1) at . Assuming a scaling in the form , as in case of the absorbing state phase transition with strong disorder in lower dimensions57, we could obtain . Neither of these is in agreement with the regular mean-field behavior obtained for absorbing state phase transitions with quenched disorder in high dimensions58. We applied an alternative method52, which assumes that the leading correction to the scaling comes from the same scale t0 in the critical behaviors of Ps(t) and Na(t). Plotting ln[Na(t)] against ln[Ps(t)], transition point curves must fit on a straight line. As Fig. 6(c) shows, this allows an estimate for the transition point λc = 0.1195(2), in which the slope is 0.53(2).
We also determined the avalanche size distributions Pava(s) in spreading simulations. The size of an avalanche is defined as the total number of sites s activated during a spreading experiment. The results for M = 103 can be seen in Fig. 7. Power-law behavior occurs for the 10 < s < 106 region with a variation of the exponent as a function of λ. A PL fitting for the 0.1 ≤ λ ≤ 0.1215 region results in Pava(s) ∝ s−τ with 1.20 ≤ τ ≤ 1.52, which encloses mean-field exponent of the directed percolation class (τ = 3/2)59. Curiously, this mean-value is consistent with reports for activity avalanches observed in the brain6,12. However, it is important to remember that other mechanisms can explain the exponent5 τ = 3/2. On the other hand, since the spreading and decay exponents depend on λ, the same should happen for τ, as the consequence of the scaling relation τ = (1 + η + 2δ)/(1 + η + δ) for absorbing state phase transitions59. Indeed, the 3/2 exponent also appears in the avalanche mean-field exponents of many models and several universality classes (DP, Dynamical Percolation, Random Field Ising Model, etc.)56. However, in our case, the universality class seems to be different, since the 3/2 exponent is found within the GP, while at the critical point λc ≈ 0.12 the measured τ is smaller.
Figure 7.
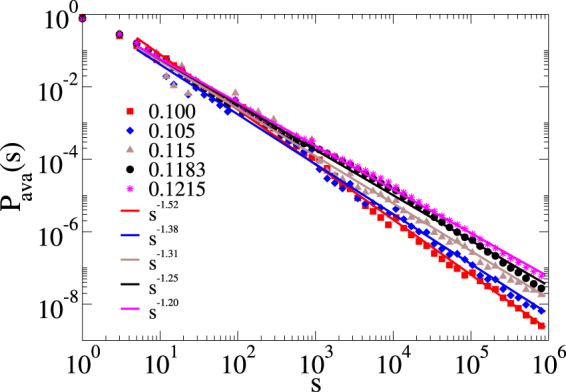
Avalanche size distributions of the SIS spreading on a single MMN. Only topological disorder is considered and the number of modules is M = 103. Different values of λ are indicated by the legends. Simple PL tail fits are also shown.
Discussion
We have analyzed the activity spreading of the SIS model in loosely connected, non-hierarchical modular networks and observed extended regions of non-universal scaling behavior for intrinsic [Figs 4(a), 5(a) and 6] and topological [Fig. 4(b)] disorders, using density decay and spreading analysis. The interval of the control parameter with dynamical critical region, which was robust under finite size analysis, showed size similar to previous studies on hierarchical networks26–28. It depends on the disorder type and shrinks only in case of a module size distribution of diverging variance [Fig. 5(b)]. The time window where we observed scaling undergoes an exponential cutoff. The reason is that we are dealing with infinite dimensional networks, for which increasing the number of vertices by one order of magnitude increases the diameter only by a few unities as shown in Fig. 3(b). However, the range of the scaling regime is improved with the size, as can clearly be read off from Fig. 4(a). This is clarified further via the local slope analysis in the Supplementary Information. However, the time window size of power laws increases modestly for non MMNs. Note that logarithmic corrections are common in GPs and this can really be observed by our local slope analysis shown in the Supplementary Information. Finally, the presented scaling regimes correspond to single network realizations, while the power-law regime is increased if averages are performed over many independent networks as exemplified in the Supplementary Information.
At a first glance, the results presented up to this point are in odds with the conjecture that infinite dimensional networks cannot sustain real GPs22. Strictly speaking, one may argue that the finite module sizes in the monodisperse case imply that RR lifespans can be huge, but bounded and thus the observed PLs correspond to very strong Griffths effects, differing from real GPs in the sense that they disappear in the thermodynamic limit. However, we also found size-independent GPs in the polydisperse case with ϕ = 4.0, where this size restriction does not apply. To understand this, we express the typical Sc for which at least one module of size S > Sc is present as
| 1 |
implying that the sizes of the largest modules diverge as their number is increased. The same result can be deduced more rigorously using extreme-value theory60.
The underlying mechanism behind GPs is the emergence of RRs related to the nature of the activity spreading of the SIS model and to the loose intermodular connectivity of the network. Let us discuss this in the case of topological disorder, but similar reasoning can be applied for the intrinsic one too. Activity of the SIS dynamics is concentrated in localized (sub-extensive) domains, which can be hubs29,31,61 or densely connected groups of vertices in the innermost core of the network39,62. However, bridges among modules in the investigated model are randomly built, implying that the probability of being connected through highly active regions of different modules is very small. This is associated with the variability of module properties, caused by the randomness. This produces broad activity lifespan distributions in individual modules inside the GP, λ0 < λ < λc, as shown in Fig. 8 for a MMN. In this case, the distribution follows , with an exponent a ≈ 1.8. To obtain this law we computed the density of infected vertices as function of time in each module. The results could be fitted with an exponential decay in the range t > 20 and we could extract the characteristic time τls of each module individually. Active sites in a large fraction of these modules are therefore short lived and, from the point of view of the spreading process, behave as if they were removed. The remaining network that sustains the long-term activity can be approximated by isolated or weakly coupled patches, providing an effective zero dimensional substrate for the activity spreading. However, it must be stressed that there exist intermodular interactions, that change the decay profiles in comparison with the isolated module case (see Supplementary Information for plots).
Figure 8.
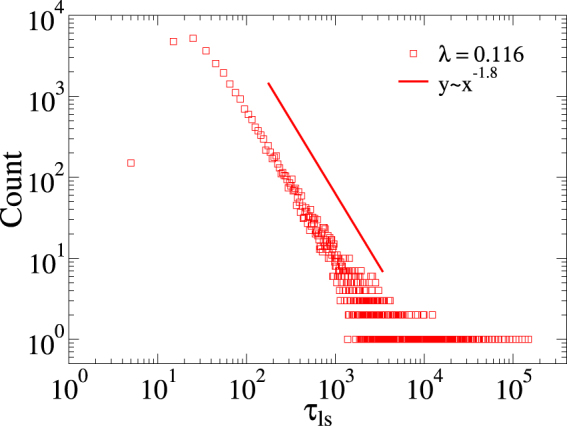
Distribution of activity lifespan within individual modules. Distribution of the activity lifespan τls for SIS dynamics computed in individual modules of a single MMN with M = 3×10⁴ and λ = 0.116 inside the GP. The distribution is computed by binning time windows of size Δτls = 10.
To summarize, our analysis reveals the existence of stable GPs on small-world, thus infinite dimensional substrates, conditioned to be sparsely connected in a modular structure, as an alternative for the origin of criticality on modular systems. The hierarchical modular networks, where GPs were previously observed26,27 are loosely connected. Hierarchy plays an important role, by increasing the distances between the modules, thus enhancing GPs, but it is not a necessary condition. The brain criticality hypothesis via GPs raised by Moretti and Muñoz26 is strengthened by our results since building connectome networks10,34,63 is far from of being trivial and the hypothesis of hierarchy in the modular organization of the brain is not fully accepted. Especially the very restrictive condition of finite dimension is fragile due to the presence of long-range connections. The model we used, conceived to be simple, allowed us to address this specific issue which would not easily be accessed in a real brain network. We expect that our results, which were not conceived for a specific system, will be important for the investigation of criticality in other modular systems beyond brain networks. In the future, one should investigate real networks with the aforementioned properties and build models with more realistic features, such as correlation patterns64, exerting significant influence on the results.
Methods
Generation of synthetic modular networks
The network is generated as follows:
-
(i)
The number of stubs of each vertex is drawn according to the degree distribution P(k).
-
(ii)
Two stubs are randomly chosen. If they belong to the same group, a new edge is formed. If not, an edge is formed only if the maximal number of intermodular connections in both groups is not exceeded.
-
(iii)
Multiple or self-connections are forbidden.
-
(iv)
The process is iterated until all stubs are connected or it becomes impossible to form new edges without multiple or self-connections.
-
(v)
The unconnected stubs are removed. We study only the giant component which, in the present studies, contains almost all vertices of the network.
The number of removed stubs is a tiny fraction (less than 0.02% of the stubs) and does not play any relevant role on the network properties shown in Fig. 3 or Table 1.
Network metrics
The modularity coefficient is defined by42
| 2 |
where Aij is the adjacency matrix, defined as Aij = 1, if vertices i and j are connected and Aij = 0 otherwise; δ(i, j) is the Kronecker delta function and gi corresponds to the community that vertex i belongs to. For , we find Qmod ≈ 1, confirming the expected modular structure of the investigated synthetic networks.
The Watts-Strogatz clustering coefficient of a vertex i is defined as42
| 3 |
Where ei is the number of edges interconnecting the ki nearest neighbors of node i. The average clustering coefficient is a simple average over all vertices of the network.
Computer implementation of the SIS model
Statistically exact simulations of the SIS dynamics in a network with infection and healing rates λ and μ can efficiently be simulated using pseudo-process method described elsewhere45. A list with all infected vertices, their number Ninf and the number of edges Ne emanating from them are recorded and constantly updated. In each time step, we proceed as follows.
-
(i)With probability
an infected vertex is selected with equal chance and healed.4 -
(ii)
With complementary probability 1−p, an infected vertex is selected with probability proportional to its degree. A neighbor of the selected vertex is chosen with equal chance and, if susceptible, it is infected. Otherwise no change of state happens and the simulation runs to the next time step.
-
(iii)
The time is incremented by
| 5 |
where u is a pseudo random number, uniformly distributed in the interval (0, 1).
For each network realization averages were computed over 100 to 500 independent dynamic runs in the decay simulations, started with all vertices infected. For spreading analyses, which begins with a single infected vertex, the process is started 10 to 100 times at each vertex of the network.
Data Availability
The datasets generated during and/or analysed during the current study are available from the corresponding author on reasonable request.
Electronic supplementary material
Acknowledgements
This work was partially supported by the Brazilian agencies CAPES, CNPq and FAPEMIG and the Hungarian research fund OTKA (K109577). We thank Robert Juhász for fruitful comments and discussions. G.Ó. thanks the Physics Department at UFV, where part of this work was done, for its hospitality. S.C.F. thanks the support from the program Ciência sem Fronteiras - CAPES under project No. 88881.030375/2013-01.
Author Contributions
G.Ó. and S.C.F. conceived the research and wrote the paper. W.C. performed dynamical simulations and structural analyses. S.C.F. generated the networks. G.Ó. and S.C.F. performed spreading simulations. All authors reviewed the manuscript and analyzed the data.
Competing Interests
The authors declare no competing interests.
Footnotes
Electronic supplementary material
Supplementary information accompanies this paper at 10.1038/s41598-018-27506-x.
Publisher's note: Springer Nature remains neutral with regard to jurisdictional claims in published maps and institutional affiliations.
References
- 1.Sornet, D. Critical Phenomena in Natural Sciences. Springer Series in Synergetics (Springer-Verlag, Berlin/Heidelberg, 2006).
- 2.Tauber, U. C. Critical Dynamics (Cambridge University Press, Cambridge, 2014).
- 3.Bak P, Tang C, Wiesenfeld K. Self-organized criticality: An explanation of the 1/f noise. Phys. Rev. Lett. 1987;59:381–384. doi: 10.1103/PhysRevLett.59.381. [DOI] [PubMed] [Google Scholar]
- 4.Dickman R, Muñoz MA, Vespignani A, Zapperi S. Paths to self-organized criticality. Brazilian J. Phys. 2000;30:27–41. doi: 10.1590/S0103-97332000000100004. [DOI] [Google Scholar]
- 5.Chialvo DR. Emergent complex neural dynamics. Nat. Phys. 2010;6:744–750. doi: 10.1038/nphys1803. [DOI] [Google Scholar]
- 6.Beggs JM, Plenz D. Neuronal avalanches in neocortical circuits. J. Neurosci. 2003;23:11167–77. doi: 10.1523/JNEUROSCI.23-35-11167.2003. [DOI] [PMC free article] [PubMed] [Google Scholar]
- 7.Haimovici A, Tagliazucchi E, Balenzuela P, Chialvo DR. Brain organization into resting state networks emerges at criticality on a model of the human connectome. Phys. Rev. Lett. 2013;110:178101. doi: 10.1103/PhysRevLett.110.178101. [DOI] [PubMed] [Google Scholar]
- 8.Plenz, D., Niebur, E. & Schuster, H. Criticality in Neural Systems. Annual Reviews of Nonlinear Dynamics and Complexity (VCH) (Wiley, 2014).
- 9.Legenstein, R. & Maass, W. New Directions in Statistical Signal Processing: From Systems to Brain (MIT Press, Cambridge, 2007).
- 10.Sporns, O. Networks of the Brain (MIT Press, 2010).
- 11.Larremore DB, Shew WL, Restrepo JG. Predicting criticality and dynamic range in complex networks: Effects of topology. Phys. Rev. Lett. 2011;106:058101. doi: 10.1103/PhysRevLett.106.058101. [DOI] [PubMed] [Google Scholar]
- 12.Beggs JM, Timme N. Being Critical of Criticality in the Brain. Front. Physiol. 2012;3:1–14. doi: 10.3389/fphys.2012.00163. [DOI] [PMC free article] [PubMed] [Google Scholar]
- 13.Kinouchi O, Copelli M. Optimal dynamical range of excitable networks at criticality. Nat. Phys. 2006;2:348–351. doi: 10.1038/nphys289. [DOI] [Google Scholar]
- 14.Hidalgo J, et al. Information-based fitness and the emergence of criticality in living systems. Proc. Natl. Acad. Sci. 2014;111:10095–10100. doi: 10.1073/pnas.1319166111. [DOI] [PMC free article] [PubMed] [Google Scholar]
- 15.Pastor-Satorras R, Castellano C, Van Mieghem P, Vespignani A. Epidemic processes in complex networks. Rev. Mod. Phys. 2015;87:925–979. doi: 10.1103/RevModPhys.87.925. [DOI] [Google Scholar]
- 16.Castellano C, Fortunato S, Loreto V. Statistical physics of social dynamics. Rev. Mod. Phys. 2009;81:591–646. doi: 10.1103/RevModPhys.81.591. [DOI] [Google Scholar]
- 17.Rodrigues FA, Peron TKD, Ji P, Kurths J. The Kuramoto model in complex networks. Phys. Rep. 2016;610:1–98. doi: 10.1016/j.physrep.2015.10.008. [DOI] [Google Scholar]
- 18.Griffiths RB. Nonanalytic Behavior Above the Critical Point in a Random Ising Ferromagnet. Phys. Rev. Lett. 1969;23:17–19. doi: 10.1103/PhysRevLett.23.17. [DOI] [Google Scholar]
- 19.Vojta T. Rare region effects at classical, quantum and nonequilibrium phase transitions. J. Phys. A Math. Gen. 2006;39:R143–R205. doi: 10.1088/0305-4470/39/22/R01. [DOI] [Google Scholar]
- 20.Henkel, M., Hinrichsen, H. & Sven, L. Non-Equilibrium Phase Transitions. Volume 1: Absorbing Phase Transitions. Theoretical and Mathematical Physics (Springer Netherlands, Dordrecht, 2008).
- 21.Barghathi H, Vojta T. Phase Transitions on Random Lattices: How Random is Topological Disorder? Phys. Rev. Lett. 2014;113:120602. doi: 10.1103/PhysRevLett.113.120602. [DOI] [PubMed] [Google Scholar]
- 22.Muñoz MA, Juhász R, Castellano C, Ódor G. Griffiths Phases on Complex Networks. Phys. Rev. Lett. 2010;105:128701. doi: 10.1103/PhysRevLett.105.128701. [DOI] [PubMed] [Google Scholar]
- 23.Albert R, Barabási A-L. Statistical mechanics of complex networks. Rev. Mod. Phys. 2002;74:47–97. doi: 10.1103/RevModPhys.74.47. [DOI] [Google Scholar]
- 24.Bullmore E, Sporns O. Complex brain networks: graph theoretical analysis of structural and functional systems. Nat. Rev. Neurosci. 2009;10:312–312. doi: 10.1038/nrn2618. [DOI] [PubMed] [Google Scholar]
- 25.Meunier D, Lambiotte R, Bullmore ET. Modular and Hierarchically Modular Organization of Brain Networks. Front. Neurosci. 2010;4:1–11. doi: 10.3389/fnins.2010.00200. [DOI] [PMC free article] [PubMed] [Google Scholar]
- 26.Moretti P, Muñoz MA. Griffiths phases and the stretching of criticality in brain networks. Nat. Commun. 2013;4:2521. doi: 10.1038/ncomms3521. [DOI] [PubMed] [Google Scholar]
- 27.Ódor G, Dickman R, Ódor G. Griffiths phases and localization in hierarchical modular networks. Sci. Rep. 2015;5:14451. doi: 10.1038/srep14451. [DOI] [PMC free article] [PubMed] [Google Scholar]
- 28.Li S. Griffiths phase on hierarchical modular networks with small-world edges. Phys. Rev. E. 2017;95:032306. doi: 10.1103/PhysRevE.95.032306. [DOI] [PMC free article] [PubMed] [Google Scholar]
- 29.Mata AS, Ferreira SC. Multiple transitions of the susceptible-infected-susceptible epidemic model on complex networks. Phys. Rev. E. 2015;91:012816. doi: 10.1103/PhysRevE.91.012816. [DOI] [PubMed] [Google Scholar]
- 30.Cota W, Ferreira SC, Ódor G. Griffiths effects of the susceptible-infected-susceptible epidemic model on random power-law networks. Phys. Rev. E. 2016;93:032322. doi: 10.1103/PhysRevE.93.032322. [DOI] [PubMed] [Google Scholar]
- 31.Lee HK, Shim P-S, Noh JD. Epidemic threshold of the susceptible-infected-susceptible model on complex networks. Phys. Rev. E. 2013;87:062812. doi: 10.1103/PhysRevE.87.062812. [DOI] [PubMed] [Google Scholar]
- 32.Newman M, Watts D. Renormalization group analysis of the small-world network model. Phys. Lett. A. 1999;263:341–346. doi: 10.1016/S0375-9601(99)00757-4. [DOI] [Google Scholar]
- 33.Barrat A, Weigt M. On the properties of small-world network models. Eur. Phys. J. B. 2000;13:547–560. doi: 10.1007/s100510050067. [DOI] [Google Scholar]
- 34.Hilgetag CC, Goulas A. Is the brain really a small-world network? Brain Struct. Func. 2016;221:2361–2366. doi: 10.1007/s00429-015-1035-6. [DOI] [PMC free article] [PubMed] [Google Scholar]
- 35.Ebel H, Mielsch L-I, Bornholdt S. Scale-free topology of e-mail networks. Phys. Rev. E. 2002;66:035103. doi: 10.1103/PhysRevE.66.035103. [DOI] [PubMed] [Google Scholar]
- 36.Palla G, Farkas IJ, Pollner P, Derenyi I, Vicsek T. Directed network modules. New J. Phys. 2007;9:186. doi: 10.1088/1367-2630/9/6/186. [DOI] [Google Scholar]
- 37.Xenarios I, et al. Dip, the database of interacting proteins: a research tool for studying cellular networks of protein interactions. Nucleic Acids Res. 2002;30:303–305. doi: 10.1093/nar/30.1.303. [DOI] [PMC free article] [PubMed] [Google Scholar]
- 38.Ódor G. Critical dynamics on a large human Open Connectome network. Phys. Rev. E. 2016;94:062411. doi: 10.1103/PhysRevE.94.062411. [DOI] [PubMed] [Google Scholar]
- 39.Kitsak M, et al. Identification of influential spreaders in complex networks. Nat. Phys. 2010;6:888–893. doi: 10.1038/nphys1746. [DOI] [Google Scholar]
- 40.Castellano C, Pastor-Satorras R. Relating Topological Determinants of Complex Networks to Their Spectral Properties: Structural and Dynamical Effects. Phys. Rev. X. 2017;7:041024. [Google Scholar]
- 41.Lancichinetti A, Fortunato S, Radicchi F. Benchmark graphs for testing community detection algorithms. Phys. Rev. E. 2008;78:046110. doi: 10.1103/PhysRevE.78.046110. [DOI] [PubMed] [Google Scholar]
- 42.Newman, M. E. J. Networks: An Introduction (Oxford University Press, Oxford New York, 2010).
- 43.Blondel VD, Guillaume J-L, Lambiotte R, Lefebvre E. Fast unfolding of communities in large networks. J. Stat. Mech. Theory Exp. 2008;2008:P10008. doi: 10.1088/1742-5468/2008/10/P10008. [DOI] [Google Scholar]
- 44.Ravasz E, Barabási A-L. Hierarchical organization in complex networks. Phys. Rev. E. 2003;67:026112. doi: 10.1103/PhysRevE.67.026112. [DOI] [PubMed] [Google Scholar]
- 45.Cota W, Ferreira SC. Optimized Gillespie algorithms for the simulation of Markovian epidemic processes on large and heterogeneous networks. Comput. Phys. Commun. 2017;219:303–312. doi: 10.1016/j.cpc.2017.06.007. [DOI] [Google Scholar]
- 46.Marro, J. & Dickman, R. Nonequilibrium Phase Transitions in Lattice Models. Aléa-Saclay (Cambridge University Press, 2005).
- 47.Chatterjee S, Durrett R. Contact processes on random graphs with power law degree distributions have critical value 0. Ann. Probab. 2009;37:2332–2356. doi: 10.1214/09-AOP471. [DOI] [Google Scholar]
- 48.Boguñá M, Castellano C, Pastor-Satorras R. Nature of the Epidemic Threshold for the Susceptible-Infected-Susceptible Dynamics in Networks. Phys. Rev. Lett. 2013;111:068701. doi: 10.1103/PhysRevLett.111.068701. [DOI] [PubMed] [Google Scholar]
- 49.Ferreira SC, Sander RS, Pastor-Satorras R. Collective versus hub activation of epidemic phases on networks. Phys. Rev. E. 2016;93:032314. doi: 10.1103/PhysRevE.93.032314. [DOI] [PMC free article] [PubMed] [Google Scholar]
- 50.Ferreira RS, Ferreira SC. Critical behavior of the contact process on small-world networks. Eur. Phys. J. B. 2013;86:462. doi: 10.1140/epjb/e2013-40534-0. [DOI] [Google Scholar]
- 51.Harris TE. Contact interactions on a lattice. Ann. Probab. 1974;2:969–988. doi: 10.1214/aop/1176996493. [DOI] [Google Scholar]
- 52.Juhász R, Ódor G, Castellano C, Muñoz M. Rare-region effects in the contact process on networks. Phys. Rev. E. 2012;85:1–13. doi: 10.1103/PhysRevE.85.066125. [DOI] [PubMed] [Google Scholar]
- 53.Ódor G, Pastor-Satorras R. Slow dynamics and rare-region effects in the contact process on weighted tree networks. Phys. Rev. E. 2012;86:026117. doi: 10.1103/PhysRevE.86.026117. [DOI] [PubMed] [Google Scholar]
- 54.Ódor G. Rare regions of the susceptible-infected-susceptible model on barabasi-albert networks. Phys. Rev. E. 2013;87:042132. doi: 10.1103/PhysRevE.87.042132. [DOI] [PubMed] [Google Scholar]
- 55.Ódor G. Spectral analysis and slow spreading dynamics on complex networks. Phys. Rev. E. 2013;88:032109. doi: 10.1103/PhysRevE.88.032109. [DOI] [PubMed] [Google Scholar]
- 56.Ódor G. Universality classes in nonequilibrium lattice systems. Rev. Mod. Phys. 2004;76:663–724. doi: 10.1103/RevModPhys.76.663. [DOI] [Google Scholar]
- 57.Moreira AG, Dickman R. Critical dynamics of the contact process with quenched disorder. Phys. Rev. E. 1996;54:R3090–R3093. doi: 10.1103/PhysRevE.54.R3090. [DOI] [PubMed] [Google Scholar]
- 58.Vojta T, Igo J. & Hoyos, J. a. Rare regions and Griffiths singularities at a clean critical point: The five-dimensional disordered contact process. Phys. Rev. E. 2014;90:012139. doi: 10.1103/PhysRevE.90.012139. [DOI] [PubMed] [Google Scholar]
- 59.Muñoz MA, Dickman R, Vespignani A, Zapperi S. Avalanche and spreading exponents in systems with absorbing states. Phys. Rev. E. 1999;59:6175. doi: 10.1103/PhysRevE.59.6175. [DOI] [PubMed] [Google Scholar]
- 60.Boguñá M, Pastor-Satorras R, Vespignani A. Cut-offs and finite size effects in scale-free networks. Eur. Phys. J. B - Condens. Matter. 2004;38:205–209. [Google Scholar]
- 61.Castellano C, Pastor-Satorras R. Thresholds for epidemic spreading in networks. Phys. Rev. Lett. 2010;105:218701. doi: 10.1103/PhysRevLett.105.218701. [DOI] [PubMed] [Google Scholar]
- 62.Castellano C, Pastor-Satorras R. Competing activation mechanisms in epidemics on networks. Sci. Rep. 2012;2:24. doi: 10.1038/srep00371. [DOI] [PMC free article] [PubMed] [Google Scholar]
- 63.Gastner MT, Ódor G. The topology of large Open Connectome networks for the human brain. Sci. Rep. 2016;6:27249. doi: 10.1038/srep27249. [DOI] [PMC free article] [PubMed] [Google Scholar]
- 64.Vázquez A, Pastor-Satorras R, Vespignani A. Large-scale topological and dynamical properties of the Internet. Phys. Rev. E. 2002;65:066130. doi: 10.1103/PhysRevE.65.066130. [DOI] [PubMed] [Google Scholar]
- 65.Sander RS, Costa GS, Ferreira SC. Sampling methods for the quasistationary regime of epidemic processes on regular and complex networks. Phys. Rev. E. 2016;94:042308. doi: 10.1103/PhysRevE.94.042308. [DOI] [PMC free article] [PubMed] [Google Scholar]
Associated Data
This section collects any data citations, data availability statements, or supplementary materials included in this article.
Supplementary Materials
Data Availability Statement
The datasets generated during and/or analysed during the current study are available from the corresponding author on reasonable request.


