

Abstract
MAGE A3, which belongs to the family of cancer-testis antigens, is an attractive target for adoptive therapy given its reactivation in various tumors and limited expression in normal tissues. We developed an affinity-enhanced T cell receptor (TCR) directed to a human leukocyte antigen (HLA)–A*01–restricted MAGE A3 antigen (EVDPIGHLY) for use in adoptive therapy. Extensive preclinical investigations revealed no off-target antigen recognition concerns; nonetheless, administration to patients of T cells expressing the affinity-enhanced MAGE A3 TCR resulted in a serious adverse event (SAE) and fatal toxicity against cardiac tissue. We present a description of the preclinical in vitro functional analysis of the MAGE A3 TCR, which failed to reveal any evidence of off-target activity, and a full analysis of the post-SAE in vitro investigations, which reveal cross-recognition of an off-target peptide. Using an amino acid scanning approach, a peptide from the muscle protein Titin (ESDPIVAQY) was identified as an alternative target for the MAGE A3 TCR and the most likely cause of in vivo toxicity. These results demonstrate that affinity-enhanced TCRs have considerable effector functions in vivo and highlight the potential safety concerns for TCR-engineered T cells. Strategies such as peptide scanning and the use of more complex cell cultures are recommended in preclinical studies to mitigate the risk of off-target toxicity in future clinical investigations.
INTRODUCTION
Adoptive transfer of T lymphocytes with engineered specificity for tumor antigens is a promising approach to target cancer (1). Recent and emerging clinical data reveal potent antitumor activity in patients receiving such treatment (2–5). However, because most tumor antigens are derived from self-proteins, the isolation of high-affinity tumor-specific T cells is effectively precluded by thymic selection. Where such T cells have been isolated, their T cell receptors (TCRs) typically have a weaker affinity for peptide–MHC (major histocompatibility complex) complex compared to virus-specific counterparts (6). TCR affinity can be modulated through mutation of specific residues within the complementarity-determining regions (CDRs) (7, 8) to generate TCR complexes with substantially enhanced affinity for specific peptide-MHC complexes. Substitution of only one or two amino acids within the CDRs can substantially enhance the affinity of TCRs to recognize target antigens (9). Considerable increases in TCR antigen affinity have been reported (10, 11), even down to picomolar range (12). Accordingly, the development of engineered, affinity-enhanced TCRs is emerging as a powerful strategy to effectively target tumors and expands the opportunities for TCR-based adoptive T cell therapies (12–14).
Perhaps the most critical challenge for adoptive T cell therapy is the risk of treatment-induced toxicity. Such a situation might arise through mispairing of the introduced TCR chains with endogenous TCRs, leading to the generation of T cells with new, unpredictable specificities (15). An additional safety concern is the potential for TCR-engineered T cells to target normal tissue, as a consequence of alloreactivity or, because most of the known tumor antigens are not exclusive to tumors, expression of the antigen on nontumor tissue [reviewed in (16)]. Such “on-target” toxicity has been reported in recent studies; for example, T cells engineered with a TCR specific for the carcinoembryonic antigen induced severe inflammatory colitis (3), whereas T cells targeting melanoma antigens brought about destruction of normal melanocytes in the skin, ears, and eyes (17). Some tumor antigens are thought to be absent from normal tissues or have a limited expression profile. For example, members of the family of cancer-testis (CT) antigens are expressed by a number of tumors, but their expression in normal tissue is generally restricted to the adult testes (and the developing fetus); this makes the CT antigens particularly interesting targets for immunotherapy (18).
MAGE A3 belongs to the well-studied family of MAGE CT antigens (19), and a number of MAGE A3–derived peptide epitopes have been shown to be presented by various tumor cell types in the context of multiple class I alleles (20–22). Immunotherapeutic strategies based on MAGE A3 peptide vaccines have been developed but with limited success (23, 24). Because there is some evidence that MAGE A3 peptides are presented in the thymus, it seems likely that high-affinity MAGE A3–specific T cells are limited by thymic selection (25). Indeed, although MAGE A3–specific T cell clones were isolated from the peripheral blood of a melanoma patient vaccinated with a recombinant canarypox virus encoding human leukocyte antigen (HLA)–A*01–restricted MAGE A1 and A3 epitopes (23), these T cells showed low functional avidity (26). Adoptive therapy with TCR gene–modified T cells could therefore provide a more rational approach to target MAGE A3–expressing tumors.
To produce MAGE A3–specific T cells with enhanced function suitable for adoptive therapy, we used the TCR α/β sequences from T cell clone 103, isolated from patient EB81 (23), as a template to construct a panel of TCRs with a wide range of enhanced affinities for the HLA-A*01–restricted MAGE A3 peptide EVDPIGHLY. Extensive in vitro characterization of T cells transduced with these affinity-enhanced TCRs resulted in the identification of an affinity-enhanced TCR, termed a3a, for clinical testing. Unexpectedly, two patients treated with T cells engineered to express the a3a TCR died because of acute cardiac failure within 5 days of T cell administration (27). Here, we describe the full in vitro studies to characterize the specificity and function of the a3a affinity-enhanced TCR, and the post-clinical trial analyses that identify a Titin-derived peptide presented by HLA-A*01 as the likely cause of the in vivo toxicity. These findings illustrate a pertinent safety concern for the use of TCR-engineered T cells, and we present additional preclinical screening assays that can be used to potentially mitigate the risk of unexpected toxicities in the future.
RESULTS
Affinity-enhanced MAGE A3 TCRs demonstrate potent antitumor activity
To obtain TCRs with enhanced affinity for the HLA-A*01–restricted MAGE A3 peptide (referred to herein as MAGE A3), we subjected the wild-type MAGE A3 TCR to phage display, as previously described (12). A panel of 12 TCRs was obtained with mutations in either the α or the β chain. Biophysical analyses showed that the TCRs span a range of binding parameters and cover KD values typically reported for effective engagement of peptide-MHC (between 1 and 50 μM) (Fig. 1A). To evaluate the functionality and characterize the specificity of the affinity-enhanced receptors, we prepared primary human T cells expressing each TCR, including wild type, using lentivirus-mediated transduction.
Fig. 1. Panel of MAGE A3 affinity-enhanced TCRs.
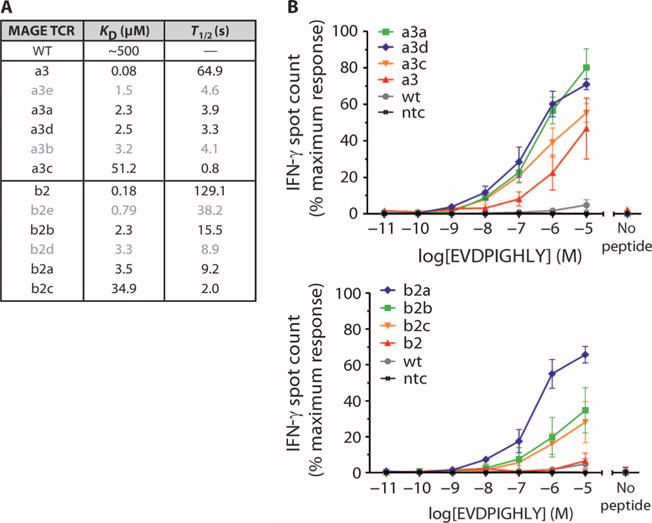
(A) Biophysical parameters describing the interaction between 12 MAGE A3 affinity-enhanced TCRs and the HLA-A*01–restricted MAGE A3 peptide antigen. Affinity-enhanced TCRs were produced by phage display, and affinity and half-life were calculated from SPR measurements. (B) Sensitivity of TCR-engineered T cells to antigen. The TCRs from the panel were used to produce TCR-engineered T cells via lentivirus-mediated transduction. Sensitivity was assessed by IFN-γ release, using HEP2 cells HLA-A*01+ pulsed with a titration of MAGE A3 peptide, as targets. Control measurements were carried out in the absence of peptide. For clarity, data are shown for 8 of the 12 TCRs. TCRs with α chain mutations are shown in the top panel and those with β chain mutations in the lower panel. Experiments were carried out in triplicate. Error bars indicate SEM. wt, wild type; ntc, absence of T cells.
To evaluate the functional avidity and potency of the affinity-enhanced TCRs, we determined the responsiveness of each engineered T cell line to HEP2 cells (HLA-A*01+, primary human hepatocytes) pulsed with a range of MAGE A3 peptide (EVDPIGHLY) concentrations using interferon-γ (IFN-γ) release as a measure of T cell activation. T cells having affinity-enhanced TCRs, with mutations in either the α (Fig. 1B, upper panel) or the β (Fig. 1B, lower panel) chain, had a considerably greater ability to recognize pulsed cells compared to those with the wild-type TCR. This effect was evident in terms of both the minimal peptide concentration required for triggering and the total number of spots produced. T cells with the highest-affinity TCRs (a3 and b2) did not produce the most potent response. Indeed, although affinity-enhanced MAGE A3 TCRs were able to generate a more potent response to antigen than did the wild-type TCR, a correlation between affinity and potency was apparent only to a certain level of affinity. Beyond this threshold level, further increases in TCR affinity led to a reduction in potency.
We next examined activation of each transduced T cell line in response to cells that naturally process and present MAGE A3. Enzyme-linked immunospot (ELISpot) assays were used to determine IFN-γ release (Fig. 2A, left panel), and the IncuCyte platform was used to measure tumor cell killing (Fig. 2A, right panel), against various well-characterized tumor cell lines. Expression of MAGE A3 in the tumor lines was confirmed by quantitative reverse transcription polymerase chain reaction (qRT-PCR) (table S1). Affinity-enhanced T cells specifically recognized MAGE A3+/HLA-A*01+ cell lines (A375, HCT-116, and OV79), leading to T cell activation and target cell killing. T cell activation correlated with the relative expression levels of MAGE A3. Again, the highest-affinity TCRs did not show the greatest functional effects.
Fig. 2. Functional analysis of TCR-engineered T cells.
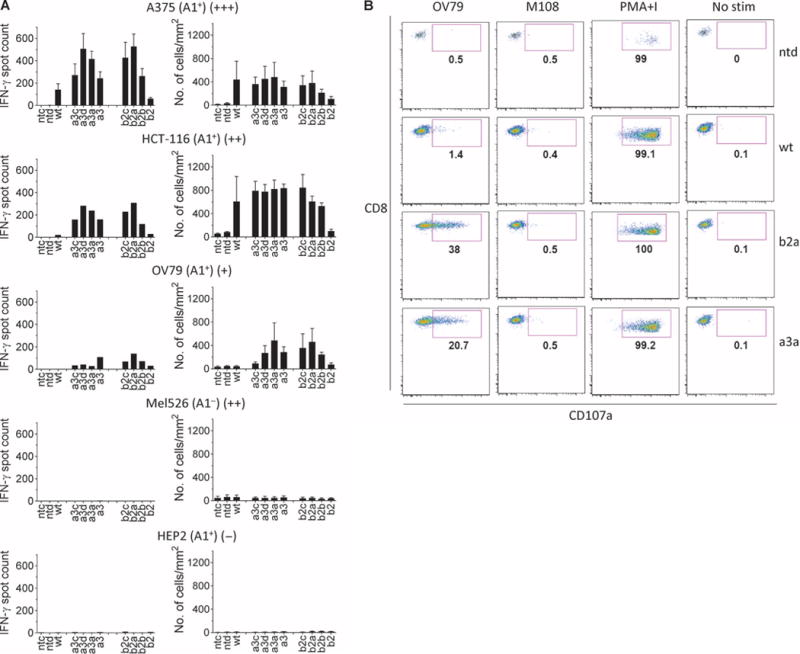
(A) Activity and specificity of engineered T cells expressing affinity-enhanced TCRs against various tumor cell lines and normal human hepatocytes (HEP2). The cell line is indicated above each graph along with HLA-A*01 status and an indication of MAGE A3 expression (shown in brackets as +/++/+++). IFN-γ release (left column) was determined by ELISpot, and cytotoxicity (right column) was determined using the IncuCyte platform (no. of apoptotic cells). Controls were carried out using nontransduced cells (ntd) and in the absence of T cells (ntc). Experiments were carried out in triplicate. Error bars indicate SEM. (B) Degranulation. T cell lines carrying the a3a or b2a affinity-enhanced TCRs were assessed for surface accumulation of CD107a in the presence of MAGE A3+ OV79 cells and MAGE A3− M108. Nontransduced T cells (ntd) and T cell carrying the wt TCR were included for comparison. Data were obtained using flow cytometry. Samples were initially gated on lymphocytes followed by gating on CD8+ and CD4+ events and finally a gate on Vβ5.1. Control measurements were carried out using PMA and ionomycin (PMA+I) and unstimulated T cells (No stim).
These initial analyses identified two affinity-enhanced receptors, a3a and b2a, which conferred potent MAGE A3 peptide–specific activity and no evidence of degenerate specificity; these receptors were selected for further study. Surface accumulation of CD107a molecules was used as a measure of cytotoxic granule exocytosis. For these analyses, the OV79 ovarian cancer cell line (HLA-A*01+, MAGE A3+) and the M108 mesothelioma cell line (HLA-A*01+, MAGE A3−) were used as targets; T cells engineered to express either b2a or a3a TCR, but not the wild-type TCR, demonstrated specific degranulation in response to OV79 (Fig. 2B, first column) but not M108 (Fig. 2B, second column) targets. Pharmacologic stimulation of T cells with phorbol 12-myristate 13-acetate (PMA) and ionomycin demonstrated robust intrinsic degranulation potential by all effectors (Fig. 2B, third column), whereas control measurements using unstimulated T cells gave no activity (Fig. 2B, fourth column).
The potency of a3a-engineered T cells in vivo was confirmed using a mouse model of ovarian cancer (fig. S1).
a3a-engineered T cells have a high level of specificity in vitro
In the initial tests, a3a and b2a TCRs demonstrated potent activity and specificity; however, upon further analysis, b2a showed some nonspecific activation to the MAGE-negative colorectal cell line colo205 (Fig. 3A). On this basis, the a3a TCR was chosen for further study. To more rigorously characterize the specificity of the a3a affinity-enhanced receptor, we performed additional in vitro analyses and evaluated the ability of a3a-engineered T cells to recognize a large range of primary cells, including HLA-A*01+ melanocytes, hepatocytes, and epithelial cells. No evidence of T cell activation was detected in the presence of any of these cells (Fig. 3B). These data indicated that off-target activation of a3a-engineered T cells against normal tissues was not a cause for concern and agreed with the well-characterized restricted expression of MAGE A3 to male germline cells and certain cancers. Because MAGE family members show considerable homology across the sequence that includes the EVDPIGHLY epitope, we evaluated potential cross-recognition by the a3a receptor of related peptides derived from MAGE protein family members (table S2). These results demonstrated that a3a-engineered T cells could also recognize cells that presented similar peptides derived from MAGE A6 and MAGE B18 in addition to MAGE A3. Surface plasmon resonance (SPR) measurements, using a soluble version of a3a TCR, showed that the affinity (KD) to MAGE A6 was similar to MAGE A3 (~2 μM), whereas the affinity for MAGE B18 was considerably weaker (~100 μM). Both MAGE A6 and MAGE B18 have a similar expression profile to MAGE A3 with restricted expression in normal tissue.
Fig. 3. Specificity testing of a3a-engineered T cells.
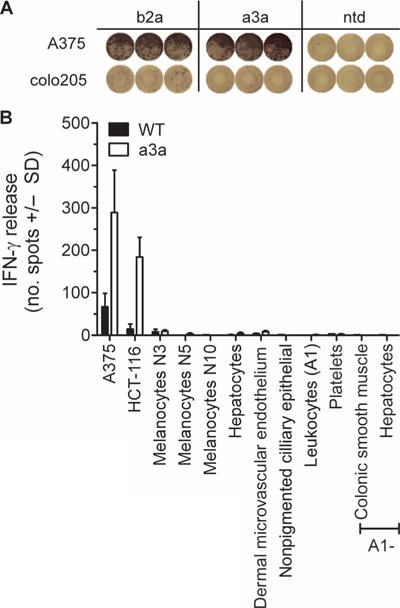
(A) Activation of b2a- but not a3a-engineered T cells by colo205 cells. Images shown represent raw IFN-γ ELISpot data. The MAGE A3+ A375 cell line is included for comparison. (B) A panel of primary cells derived from normal tissues was used to assess nonspecific activation of a3a-engineered T cells. A375 and HCT-116 tumor cell lines were used as positive controls. The nonmutated wt TCR was included for comparison. T cell activation was determined by IFN-γ release. Data represent the mean of three independent measurements ± SEM.
Differentiated cardiac cells are targeted by a3a-engineered T cells
On the basis of the preclinical data described above, two phase 1 clinical trials were initiated to evaluate the ability of a3a-engineered T cells to treat MAGE A3+ and HLA-A*01+ melanoma (NCT01350401, UPCC-01611) and multiple myeloma (NCT01352286, UPCC-01411). We recently reported two deaths from cardiac toxicity on these trials (27). In brief, the first patient (melanoma) died of myocardial infarction 4 days after T cell administration. Subsequent analyses revealed underlying pathology and did not indicate T cell involvement; the treatment was therefore considered safe for administration to a second patient (multiple myeloma). Again, cardiac-related problems were observed, and the second patient died 5 days after administration of a3a-engineered T cells; a marked T cell infiltrate was observed in the myocardium. In light of this, reexamination of the data from the first patient was undertaken and indicated that both events could be ascribed to T cell–mediated acute cardiac injury. T cell–mediated toxicity could not be explained by expression of MAGE antigens in patient heart tissue, as determined by qRT-PCR analysis of autopsy samples taken from both patients (table S3), ruling out on-target off-tissue activation of a3a-engineered T cells. Furthermore, comparison of the frequency of T cells expressing the a3a TCR heterodimer relative to T cells expressing the V 5.1 β chain (used by the a3a TCR) provided no indication of TCR mispairing. In further in vitro investigations, a3a-engineered T cells prepared from a healthy donor were tested against a cell panel designed to evaluate alloreactivity, encompassing more than 95% of the HLA serotype population and compiled from internal and external sources (15). Relatively low activity was observed against one HLA-A*01 Epstein-Barr virus (EBV)–transformed B cell line in comparison to the positive control. However, there was no evidence of a notable response to alternative HLA molecules (Fig. 4). Thus, these data did not provide an explanation for the clinical events.
Fig. 4. Alloreactivity panel.
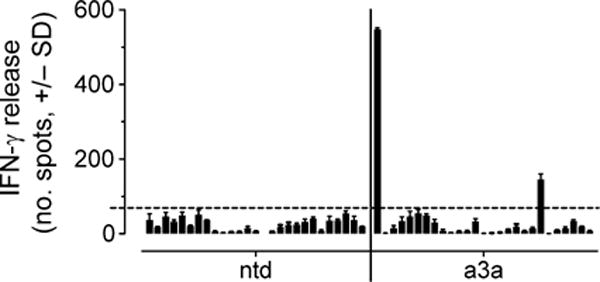
Representative data obtained from a3a-engineered T cells prepared from healthy donors. Nontransduced T cells (ntd) were included for comparison. The panel was compiled from various cell lines as detailed in Materials and Methods and encompassed more than 95% of the HLA serotype population. From left to right, the cell lines are as follows: EJM (positive control), colo205 (negative control), LMB 5835, GGT 4991, IZA 3089, MHX 1761, AAS 125, FAQ 3528, MBX 2763, AHT 192, LSR 5702, CVI 6184, MWX 3891, MSV 4803, NCI-H345, MDA-MB-231, TISI, IM-9, and nine EBV-transformed B cells obtained from independent donors. The dotted horizontal line indicates a background level. Data shown were derived from three independent measurements and represent means ± SEM.
To investigate whether a3a-engineered T cells have the potential to recognize cardiac tissue, we evaluated the ability of a3a-engineered T cells to recognize a set of 38 normal cardiac-derived primary cells (10 of which were confirmed as HLA-A*01). Using IFN-γ ELISpot assays as a readout for T cell activation, no activity was observed against any of these cardiac cells (table S4). We then investigated whether recognition of cardiac tissues by a3a-engineered T cells might require a more biologically relevant cell culture that could not be reproduced using standard cardiac cells cultured in vitro. For these analyses, we used iCell cardiomyocytes, which are highly purified, human cardio-myocytes derived from induced pluripotent stem cells (28). iCell-derived cultures are a mixture of spontaneously electrically active atrial, nodal, and ventricular-like myocytes with typical cardiac biochemical, electrophysiological, and mechanical characteristics; as a consequence, they may be considered more representative of heart tissue than standard myocyte cell cultures. Video S1 shows iCells beating in culture before inclusion in the assay. Despite absence of detectable MAGE A3 by qRT-PCR (table S5), iCell cardiomyocytes were robustly targeted by a3a-engineered T cells. Phase-contrast images, obtained using the IncuCyte platform, showed that a3a-engineered T cells mediated potent killing of iCells over a 24-hour period (Fig. 5A). The release of pro-inflammatory cytokines further confirmed recognition and targeting of iCells by a3a-engineered T cells (Fig. 5B). T cells transduced with the wild-type MAGE A3 TCR did not respond to iCells, unless the iCells were pulsed with 10 μM Titin peptide (Fig. 5B and fig. S4).
Fig. 5. Activation of wt and a3a-engineered T cells by iCell cardiomyocytes.
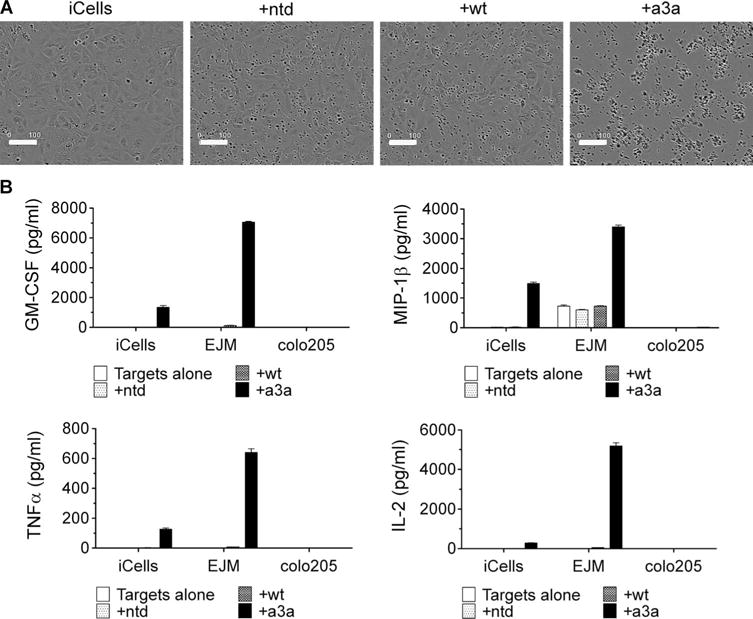
(A) iCells were killed by a3a-engineered T cells but not by T cells transduced with the wt TCR. The IncuCyte platform was used to directly visualize iCells in the presence of a3a-engineered T cells. Phase-contrast images were obtained after 24 hours. Samples containing no T cells or nontransduced T cells (ntd) were used as negative controls. Scale bars, 100 μm. (B) Cytokine production. A Luminex assay was used to assess cytokine production from wt and a3a-engineered T cells in the presence of iCells. Data for granulocyte-macrophage colony-stimulating factor (GM-CSF), macrophage inflammatory protein–1β (MIP-1β), tumor necrosis factor–α (TNFα), and interleukin-2 (IL-2) are shown. EJM and colo205 tumor cell lines were included for comparison and are positive and negative for MAGE A3, respectively. Control measurements were made on targets alone and target cells plus nontransduced cells. Experiments were carried out in triplicate. Error bars indicate SEM.
a3a-transduced T cells recognize an alternative target
The iCell targeting and expression data suggested that a likely cause for the clinical toxicity of the a3a-engineered T cells was off-target recognition of an HLA-A*01–restricted non–MAGE A3–derived peptide. Accordingly, alternative candidate molecular targets for the a3a TCR were sought. To identify candidate molecular targets, we pursued an in silico strategy. First, non-MAGE peptides with a similar sequence to MAGE A3 were identified from the human genome using the BLAST search tool. From an excess of 100 peptides, 15 candidates were selected for further analysis on the basis of a high level of sequence homology to MAGE A3 and ubiquitous expression. None of the 15 candidate peptides were recognized by a3a-engineered cells when pulsed onto HLA-A*01+ HEP2 cells (table S6). Because peptides with a high level of similarity were not recognized by a3a-engineered T cells, we pursued an alternative strategy to identify other targets recognized by these T cells.
Since each amino acid within the MAGE A3 peptide sequence is unlikely to contribute equally to TCR binding, the peptide residues critical for recognition by the a3a TCR were identified. Two sets of synthetic peptides were produced in which each amino acid of the MAGE A3 9-mer was sequentially replaced by alanine or glycine, respectively. The ability of a3a-engineered T cells to recognize HEP2 cells pulsed with each of these alanine- or glycine-substituted peptides was determined by monitoring IFN-γ release and comparing the results to those obtained using the nonmutated peptide. Where alanine or glycine substitution resulted in a large decrease in activation compared to the nonmutated peptide, the residue at this position was considered essential. These investigations implicated positions 1, 3, 4, 5, and 9 as critical for MAGE A3 binding by a3a-engineered T cells (Fig. 6, A and B). A directed in silico search was then carried out to identify protein sequences that contained the “EXDPIXXXY” motif using the ScanProsite tool. Three proteins that have potential clinical relevance were identified: the human protein Titin, which has a significant role in the contraction of cardiac and skeletal muscle, a nuclease protein from EBV (slight T cell activity against EBV-transformed B cells was observed in the alloreactivity assay), and a ribosomal maturation protein from Clostridium difficile (one of the patients tested positive for C. difficile). The three motif-containing peptides were produced synthetically and used to pulse HLA-A*01+ HEP2 cells, and the ability of a3a-engineered T cells (including patient product and a3a-engineered T cells prepared from a healthy donor) to recognize these targets was determined by IFN-γ release. MAGE A3– and MAGE B18–pulsed cells were included for comparison. a3a-engineered T cells potently recognized and were activated by target cells pulsed with the Titin-derived peptide (ESDPIVAQY), whereas EBV and C. difficile peptides were not recognized (Fig. 6C). The binding affinity (KD) of a3a-engineered T cells for Titin was determined by SPR as ~100 μM. This is similar to the affinity for MAGE B18 and consistent with levels of activation shown in Fig. 6C.
Fig. 6. Alternative specificity for a3a-engineered T cells.
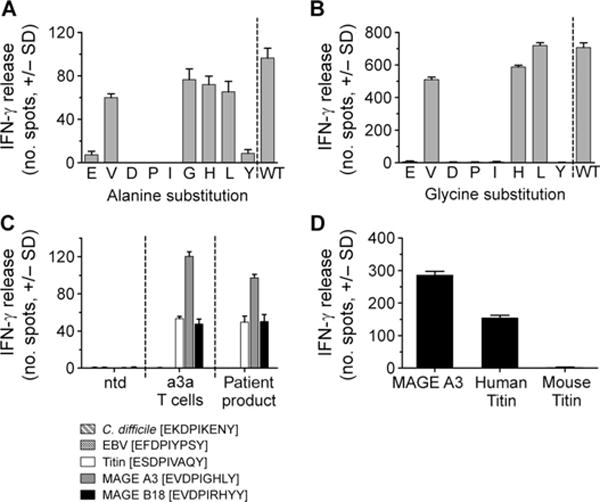
(A) Each residue in the MAGE A3 peptide sequence was sequentially replaced with alanine. Alanine-substituted peptides were pulsed onto HLA-A*01 HEP2 target cells, and IFN-γ release from a3a-engineered T cells was assessed. The residue replaced by alanine is indicated under each bar. (B) The same procedure was followed for glycine-substituted peptides, except substitution of the native glycine residue at position 6 was omitted. (C) Activation of a3a-engineered T cells by motif-containing peptides. Peptides were produced synthetically and pulsed onto HLA-A*01 HEP2 target cells. Activation of a3a-engineered T cell patient product and a3a-engineered T cells prepared from a healthy donor was determined by IFN-γ release. Nontransduced T cells (ntd) (from a healthy donor) were used as a control. (D) Activation of a3a-engineered T cells by mouse Titin. IFN-γ release was used to compare activation of a3a-engineered T cells against HEP2 cells pulsed with mouse and human Titin peptide. MAGE A3–pulsed cells are also included for comparison. All data shown were obtained from three independent measurements and represent means ± SEM.
In a further experiment using the equivalent mouse Titin peptide, no activation of a3a-engineered T cells was evident (Fig. 6D). This indicated that preclinical toxicity testing in an HLA-A1 transgenic mouse model would not have revealed potential off-target binding of a3a-engineered T cells.
Titin peptide is presented and expression is detected in normal heart tissue
To associate Titin recognition with cardiac toxicity, we demonstrated the expression of Titin in iCell cardiomyocytes using RT-PCR (Fig. 7A). Using the same technique, primary cardiac myocytes cultured under standard conditions were found to be negative for Titin unless maintained at confluence for 32 days. Two additional cell types, differentiated human skeletal muscle myoblasts and the B cell lymphoma line NALM/6, also express Titin and not MAGE A3/A6 (table S5); both of these cultured cells were effectively recognized by a3a-engineered T cells (fig. S2).
Fig. 7. Biological relevance of Titin.
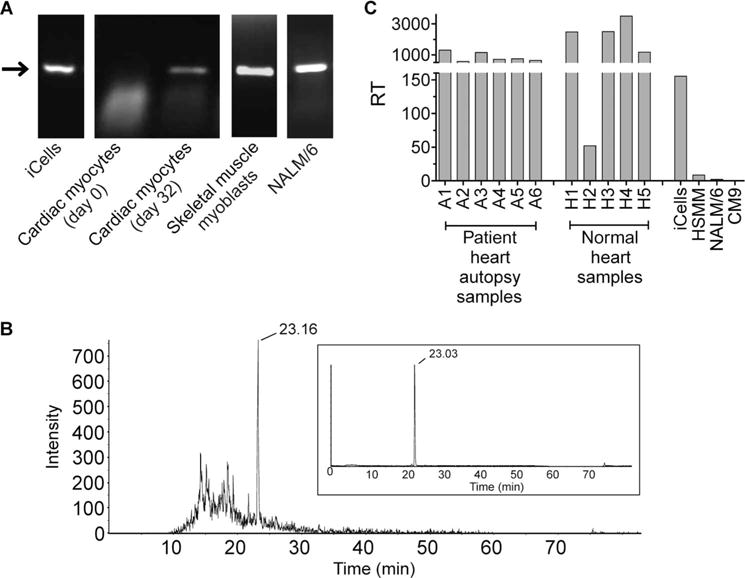
(A) Identification of Titin-expressing cells. RT-PCR was used to confirm Titin protein expression in the cell lines indicated. Cardiac myocytes were additionally assessed after being maintained at confluence for 32 days. The arrow indicates Titin (molecular weight of 327 bp). (B) Natural processing and presentation of Titin peptide. Peptides eluted from the surface of NALM/6 cells were analyzed by LC-MS/MS. Retention time of the Titin peptide is indicated. Comparison with a synthetic Titin peptide is shown inset. (C) Titin expression in heart tissue. Heart tissues obtained during patient autopsy and from tissue banks were assessed for relative expression of Titin, alongside the Titin-positive cell lines used in cellular assays (iCells, electrically active cardiomyocytes; CM9, normal cardiomyocytes; HSMM, human skeletal muscle myoblasts; NALM/6, B cell lymphoma cell line). RT indicates relative transcript number. Data shown were obtained from three independent measurements and represent means ± SEM.
To strengthen the evidence that Titin is responsible for the off-target activity of a3a-engineered T cells, we sought direct mass spectrometric (MS) evidence that the Titin peptide (ESDPIVAQY) is presented on the cell surface in the context of class I HLA. Because peptide identification by MS requires cell numbers greater than could be provided using iCell cardiomyocytes, we adopted a proteomic approach to identify a cell line positive for Titin that would be amenable for this analysis. To achieve this, we used an in-house–generated database of HLA peptides. These peptides have been purified from a wide variety of tumor cell lines and have been sequenced by MS. The database was screened for the presence of Titin peptides and identified the B cell lymphoma cell line NALM/6 as presenting Titin peptides in the context of HLA-A*01. As described earlier, NALM/6 cells are positive for Titin expression (Fig. 7A) and can activate a3a-engineered T cells. HLA peptides eluted from the surface of NALM/6 cells were subjected to liquid chromatography–tandem MS (LC-MS/MS) analysis, to search for evidence of the presence of the Titin peptide. Extracted ion chromatograms (Fig. 7B) and fragmentation spectra (fig. S3) from this experiment provide significant evidence to suggest the presence of low levels of the Titin peptide in the peptide eluate.
To examine the potential relevance of Titin in vivo, we evaluated the expression of Titin transcript in five independent cardiac tissues obtained from tissue banks and in patient heart tissue samples obtained during autopsy. Robust expression of Titin was observed in all normal cardiac tissues tested and patient autopsy samples. Titin levels in primary heart tissue were, in general, higher than those in iCells, and substantially higher than the level detected in human skeletal muscle myoblasts (HSMM) and NALM/6 cells (Fig. 7C). On the basis that transcript levels correlate with the number of epitopes presented, high Titin expression in heart tissue would suggest a level of epitope presentation that is likely to result in potent activation of a3a-engineered T cells and cardiac toxicity.
DISCUSSION
T cell adoptive therapy carries with it two main toxicity risks: on-target and off-target reactivity against healthy tissues. A report of fatal on-target toxicity associated with the HLA-A*02–presented MAGE A3/A9/A12 antigens was recently published, demonstrating the paramount importance of understanding fully the presentation profile of the target epitope(s) on normal tissues (29).
As reported here, T cells expressing affinity-enhanced TCRs directed to the HLA-A*01–presented MAGE A3 antigen (EVDPIGHLY) have potent antitumor activity in vitro and in vivo, as long as improvements in affinity are contained within an appropriate window; above this threshold level, efficacy and specificity are compromised. Despite careful preclinical assessment, the a3a TCR selected as a result of these studies gave rise to serious adverse events. These results highlight both the potential potency and the dangers of immune toxicities arising from the use of TCR gene–modified T cells in adoptive therapy. Through the in vitro investigations presented here, we have demonstrated that a3a-engineered T cells recognize an alternative HLA-A*01 peptide derived from the muscle protein Titin; the sum of the investigations points to this being the most likely cause of the in vivo toxicity. No evidence was found for alloreactivity or expression of MAGE antigens in heart tissue. Although off-target binding has been raised as a potential issue in T cell–based immunotherapy, the molecular mechanisms that cause such an event are less well defined. New, unexpected specificities have been proposed to arise from mispairing of the introduced TCR chains with those of the endogenous TCRs (15). However, as yet, the evidence only shows that this phenomenon can occur in mice (30), and it is not clear yet whether these results can be directly translated to humans (31). The data presented here suggest that the most salient danger with T cell adoptive therapy comes from recognition of peptide antigens that share a degree of sequence similarity with the intended target.
The degeneracy of TCR antigen recognition has recently been estimated, suggesting that a single TCR can recognize more than 106 HLA-presented peptide antigens (32). This level of plasticity ensures that, despite the limitations imposed by thymic selection, an individual’s T cell repertoire can generate an effective immune response to a large number of peptide antigens. However, TCR plasticity carries with it the risk that a TCR, particularly when used in the context of adoptive therapy, might recognize other peptide antigens presented on normal tissue.
Although a number of strategies are available to predict off-target toxicity, they did not and, in most cases, would not have identified Titin cross-reactivity with a3a-engineered T cells. Titin is not expressed, or is at least undetectable, in standard tissue culture systems but can be up-regulated in certain cell lines, differentiated cells (33), and more elaborate culture systems. Indeed, using RT-PCR, Titin could only be detected in cardiac myocytes in standard cultures after extended culture periods at confluence (more than 4 weeks). Using the more complex iCell cardiomyocyte culture demonstrated the potent effect a3a-engineered T cells could have on Titin-expressing cells. This suggests that, in future, specificity testing to determine clinical suitability should incorporate more biologically relevant culture systems. The use of animal models, however, is in many cases unlikely to be suitable for predicting toxicity because of not only the differences in gene expression but also, as shown here, the critical differences in the amino acid sequences of peptides derived from homologous proteins.
Searching for peptides with a similar sequence to the target peptide is probably the strategy nearest at hand for predicting alternative specificities; however, there are limitations to this approach. Not least is deciding the level of homology required; if set too high, cross-reactive peptides could be missed. On the other hand, if stringency is set too low, the number of peptides identified could become too onerous to test. We show here that by using an amino acid scanning approach, the peptide residues critical for TCR engagement could be determined. Searching for peptides containing this motif resulted in a more focused search and identified Titin as a potentially cross-reactive peptide. Because peptide antigen recognition by TCRs does not involve all peptide residues to the same degree, identification of the critical residues focuses the search for potential cross-reactive, but otherwise unrelated, peptides from genome databases.
In situations where cross-reactive peptides are found and have been shown to generate a T cell response against peptide-pulsed cells, follow-up investigations are necessary to confirm the biological relevance of the peptide. Most peptides generated from in silico investigations will not be presented by HLA complex. As shown here, MS provided direct evidence that Titin peptide was naturally processed and presented and is the most suitable tool to confirm peptide presentation. Where MS is not available, natural peptide presentation can be suggested by testing TCR-engineered T cells against cell lines that express the antigen from which the cross-reactive peptide originates.
Despite strong evidence that recognition of iCells is mediated by Titin presentation, it is remotely possible that a3a-engineered T cells recognize an alternative antigen on cardiac cells. To provide direct confirmation that a3a T cells bind Titin would require recombinant expression of Titin in a Titin-negative cell line and/or knockdown of Titin expression in iCells, both of which carry various technical challenges, not least being the size of the Titin protein (3 MD). MAGE A3, as a CT antigen, has an attractive expression profile in several types of cancer versus normal tissue. However, as has been demonstrated here, an unrelated peptide that shares similarity with the HLA-A*01–presented peptide from MAGE A3 caused unexpected and fatal reactivity by affinity-enhanced TCR-transduced T cells. Because the motif shared by the HLA-A*01–presented MAGE A3 and Titin peptides comprises the central part of the epitope, which in most cases is the core element for TCR recognition, it is likely that most TCRs with HLA-A*01–MAGE A3 specificity will also exhibit a degree of recognition toward the Titin epitope. This type of cross-reactivity, that is, peptide homologs, may more generally constitute a veiled danger for using TCR-transduced adoptive therapy in the clinic. Therefore, in addition to assessing the potency of on-target off-tissue activation, the presence of non-obvious peptide homologs must also be considered.
MATERIALS AND METHODS
Cell lines and normal primary cells
Tumor cell lines A375, HCT-116, and colo205 were obtained from the American Type Culture Collection, and Mel526 was from Thymed. M108 (34) and OV79 (35) cell lines were generated at the University of Pennsylvania. Tumor cell lines were maintained in R10 [RPMI 1640 supplemented with 10% fetal bovine serum, 2 mM L-glutamine, penicillin (100 μg/ml), and streptomycin (100 μg/ml)]. NALM/6 and EJM cell lines were provided by Deutsche Sammlung von Mikroorganismen und Zellkulturen (DSMZ) and cultured under standard conditions. HEP2 cells were obtained from ScienCell and maintained in hepatocyte medium (ScienCell). Flash-frozen normal heart tissue material (28043A, 28052A, 28057A, 28030A, 28056A) was purchased from ProteoGenex. iCell cardiomyocytes were obtained from Cellular Dynamics International and maintained as described by the manufacturer. Peripheral blood mononuclear cells (PBMCs) and platelets were obtained from healthy volunteers. Normal melanocytes (lots N3 and N5) and cardiac cells were obtained from PromoCell. Dermal micro-vascular endothelial cells, colonic smooth muscle cells, and ciliary epithelial cells were obtained from ScienCell. Normal melanocytes (lot N10) and skeletal muscle myoblasts were obtained from Lonza.
The alloreactivity panel was composed of the following cell lines: LMB5835, GGT4991, IZA3089, MHX1761, AAS125, FAQ3528, MBX2763, AHT192, LSR5702, CVI6184, MWX3891, and MSV4803, as described in (15); EBV-transformed B cells produced from nine independent donors; and commercially available cell lines [NCI-H345, MDA-MB-231, HCT-116, IM-9 (American Type Culture Collection), and TISI (European Collection of Cell Cultures)].
Preparation of affinity-enhanced MAGE A3 TCRs and T cell transduction
Affinity-enhanced MAGE A3 TCRs were obtained by phage display as previously described (12). TCR-modified T cells were prepared by lentiviral-mediated transduction. PBMCs were isolated from fresh venous blood from healthy human volunteers. CD8+ and CD4+ T cells were isolated from PBMCs with CD8+ and CD4+ isolation kits (Invitrogen) as described in the manufacturer’s instructions and incubated overnight in R10 culture medium containing human IL-2 (50 U/ml) (PeproTech) and Dynabeads CTS anti-CD3/CD28 beads (Invitrogen), at 3 beads per cell (1 × 10⁶ cells/ml, 1 ml per well of a 24-well plate). After overnight stimulation, T cells were transduced by addition of 1 ml of crude lentiviral supernatant as described in (36). Briefly, semiconfluent human embryonic kidney (HEK) 293 T cells were transfected with 15 μg of lentivector encoding the TCR of interest, along with a total of 43 μg of three packaging plasmids (37) using Express-In transfection reagent (Open Biosystems). Supernatants collected at 24 and 48 hours were concentrated by centrifugation at 10,000g for 16 hours at 4°C. Cell pellets were resuspended in 2 ml of R10 and stored at −70°C until required. T cells were then fed by addition of fresh medium (with IL-2) every other day, and the beads were removed at day 5. After 12 days, cells were cryopreserved at 2.5 × 10⁶ cells/ml until required. T cell transduction efficiency was confirmed at between 30 and 60% for all transductants.
Surface plasmon resonance
Equilibrium dissociation constant (KD) was determined by SPR with a Biacore 3000 or T200 instrument. A soluble version of the a3a TCR was prepared as described (38). Biotinylated pMHC monomers were prepared as described in (39, 40) and immobilized onto a streptavidin-coupled CM-5 sensor chips. All measurements were performed at 25°C in phosphate-buffered saline buffer (Sigma), supplemented with 0.005% Tween (Sigma), as previously described (41).
IFN-γ ELISpot
All assays were carried out with an IFN-γ ELISpot kit (BD Pharmingen) according to the manufacturer’s instructions. For peptide-pulsing assays, HLA-A*01+ hepatocyte cells were used as target cells. Target cells were washed in R10 and, unless indicated, were pulsed with 10 μM peptide. Peptides were obtained from Peptide Protein Research Limited. Transduced T cells were defrosted and rested in R10 medium for 2 hours before washing and plating out. Plates were incubated overnight (37°C/5% CO2), developed according to the manufacturer’s instructions, and evaluated on a CTL Immunospot Series 4 ELISpot Analyzer. All assays were carried out in triplicate.
Cytotoxicity
Killing assays were carried out with the IncuCyte FLR-Platform (Essen BioScience), as described in (42). HLA-A*01+ hepatocyte cells were plated at 10,000 cells per well and incubated overnight at 37°C/5% CO2 in R10 (without phenol red). The following day, cells were washed twice and incubated in R10 (without phenol red) in the presence of 20,000 TCR-transduced T cells per well and 5 μM NucView (Essen BioScience).
Degranulation
Degranulation was monitored by CD107 degranulation assays. Effector cells were thawed and rested overnight at 2 × 10⁶ cells/ml in T cell medium (X-VIVO 15 supplemented with 10% human AB serum, 1% Glutamax, 1% N-acetylcysteine, penicillin-streptomycin) before counting and addition to assays. Target cells were passaged in T cell medium and maintained at 0.5 × 10⁶ to 1 × 10⁶ cells/ml before use in assays. Effectors and targets were coincubated at 0.5:1 effector/target ratios (0.5 × 10⁶ targets per condition) in individual wells of 48-well tissue culture plates in the presence of monensin (eBioscience), anti–CD107–Alexa Fluor 647 (eBioscience), anti-CD28 (BD Pharmingen), and anti-CD49 (Becton Dickinson) antibodies. After 4 hours of incubation, the contents of each well were harvested, and cells were stained for CD8a–phycoerythrin (PE)–Cy7 (eBioscience), CD4–Pacific Blue (Becton Dickinson), and anti-TCR Vb5.1-PE IOTest (Beckman Coulter) as per the manufacturer’s instructions. Samples were resuspended in 0.5% paraformaldehyde and analyzed immediately. Flow cytometric analysis was performed with a modified LSRII (BD Immunocytometry Systems). Data were analyzed with FlowJo software (version 8.8.4, TreeStar). The gating strategy included an initial gate on lymphocytes followed by gating on CD8+ and CD4+ events and finally a gate on Vβ5.1 cells.
Cytokine analysis and iCell killing
iCell cardiomyocytes were revived from liquid nitrogen and plated at 50,000 cells per well 4 days before the assay and treated as per the manufacturer’s instructions. The iCell cardiomyocytes were virally transduced with HLA-A*01. EJM and colo205 (positive and negative controls, respectively) were plated at 50,000 cells per well on the day of assay. iCell cardiomyocytes were washed once with R10 (RPMI + 10% fetal calf serum + 1% penicillin/streptomycin + 1% Glutamax) and then incubated in R10 for the assay. a3a and wild-type transduced T cells and corresponding nontransduced cells were taken from culture and plated at 50,000 cells per well. The cells were cultured for 24 hours and then centrifuged at 800g for 4 min, and 100 μl of supernatant was then removed and placed in a clean plate. The plates were stored at −70°C before thawing and developing to measure multiple cytokine release by Luminex (multiplex kit, Millipore), in accordance with the manufacturer’s instructions. Phase-contrast images were obtained after 24 hours on the IncuCyte FLR-Platform (Essen BioScience).
In silico sequence analysis
The RefSeq database was searched for human peptides with a similar sequence to MAGE A3 using protein BLAST (Basic Local Alignment Search Tool) version 2.2.27 (43). Algorithm parameters were adjusted automatically for a short protein. General parameters are as follows: expect threshold, 200,000; word size, 2. Scoring parameters are as follows: matrix, PAM30; gap costs, existence 9 extension 1; no compositional adjustments. The ScanProsite tool was used to search all UniProtKB/Swiss-Prot (release 2012_10 of 31-Oct-12: 538,259 entries) database sequences for proteins that contain the motif identified above (entered as E-X-D-P-I-X-X-X-Y). No filters were used. Pattern options were set to allow at most 1× sequence characters to match a conserved position in the pattern, and the match mode was set to “greedy, overlaps, no includes.”
Mass spectrometry
Class I HLA peptides were isolated from NALM/6 cells by mild acid elution with a modification of previously described methods (44). Briefly, cells (1.5 × 10⁹) were incubated at room temperature for 3 min in citrate-phosphate buffer (0.131 M citric acid/0.066 M Na2HPO4) to disrupt HLA complexes. Cells were separated by centrifugation (1500g for 5 min), and supernatant was removed. Cellular debris was removed from the supernatant by centrifugation at 15,000g for 20 min, and the material was passed through an ultracentrifugation filter (Amicon Ultracel-3K, Millipore) to isolate peptides of less than 3000 daltons. The peptide extract was desalted with a Strata-X polymer-based reverse-phase cartridge (100-mg sorbent mass, Phenomenex). Bound material was eluted from the column in 40% acetonitrile/0.1% formic acid and reduced in volume by vacuum centrifugation followed by lyophilization.
Peptides were separated by high-performance liquid chromatography on an Agilent 1100 system with a Luna C18(2) column (150 × 4.6 mm, Phenomenex). Peptides were loaded in 98% buffer A [0.1% aqueous trifluoroacetic acid (TFA)] and 2% buffer B (0.1% TFA in acetonitrile). Peptides were eluted with a gradient of 2 to 60% B over 12 min at a flow rate of 1 ml/min, with fractions collected at 1-min intervals. Fractions were reduced to minimal volume (10 to 20 μl) by vacuum centrifugation followed by lyophilization, before loading onto the nano-LC column.
Peptides were analyzed by nano-LC–MS/MS with a Dionex UltiMate 3000 Nano LC, coupled with an AB Sciex TripleTOF 5600 mass spectrometer equipped with a nanoelectrospray ion source. Peptides were loaded onto an Acclaim PepMap 100 trap column (75 μm × 20 mm, Dionex) and separated with an Acclaim PepMap RSLC column (75 μm × 250 mm, Dionex). Peptides were loaded in mobile phase A (0.5% formic acid/water) at a flow rate of 4 μl/min and eluted with a gradient of buffer B (acetonitrile/0.5% formic acid) increasing from 2 to 10% B (retention time, 6 to 12 min), 10 to 40% B (retention time, 12 to 50 min), and 40 to 95% B (retention time, 50 to 60 min) at a flow rate of 300 nl/min. Material was eluted directly into the nanospray ionization source. The mass spectrometer was operated with a multiple reaction monitoring method where the mass/charge ratio (m/z) corresponding to the mass of the doubly charged peptide ESDPIVAQY was continuously selected for collision-activated dissociation throughout the duration of the elution. Positive identification of the peptide was based on comparing the retention time and fragmentation profile to that of a synthetic peptide.
qRT-PCR analysis
RNA was isolated from cell lines with RNAqueous RNA isolation kits (Ambion) and from tumor samples and tissues with RNA RiboPure kits (Ambion), and complementary DNA (cDNA) was synthesized with iScript cDNA synthesis kits (Bio-Rad). Samples were analyzed for expression of transcripts (MAGE A3, MAGE A6, MAGE B18, and Titin), as well as housekeeping transcripts (actin, Gus-B, and PP1B) with ABI TaqMan-based technologies and the following ABI-recommended gene-specific primer probe sets: MAGE A3, Hs03985994_uH [specific for 5′ untranslated region (UTR) sequences of the MAGE A3 gene]; MAGE A6, Hs00602508_m1 (specific for 5′UTR sequences of the MAGE A6 gene); MAGE B18, Hs00380765_m1 (specific for 5′UTR sequences of the MAGE B18 gene); β-actin, HS99999903_1ml; Gus-B, HS99999908_m1; PP1B, Hs00168719_m1. For all analyses, the melanoma cell line A375 (positive for MAGE A3, A6, and B18) served as the reference sample. To quantify the expression of Titin, a custom set of primers and probe was designed that spanned the epitope of interest: forward, 5′-GCCGAAAACAGATATGGACAAAGC; reverse, 5′-GGAGGGCCTGGTTCTTTGTAG; probe (MGB), FAM-CCAATTGTAGCTCAATATC. All amplification reactions were performed with an ABI 7500 Fast instrument (ABI-Life Technologies) and established laboratory protocols. Each transcript was evaluated in triplicate. Ct values for each amplification reaction were determined with pre-established assay-specific threshold values, with a minimum of two of three replicates with percent coefficient of variation of <15% required to record a Ct value. Average Ct values were calculated and reported. RQ (relative quantification) values for each transcript were determined according to the following formula: RQ = 2−ΔΔCt, with ΔΔCt = ΔCt sample − ΔCt reference, with ΔCt sample = Ct sample − Ct sample normalizer and ΔCt reference = Ct reference − Ct reference normalizer (45).
RT-PCR analysis of Titin expression in cell lines
RNA was extracted with the Qiagen RNeasy system following the manufacturer’s guidelines, and cDNA was synthesized with the iScript reaction mix (Bio-Rad). This blend is optimized for the production of targets <1 kb in length and provides a more even coverage of larger mRNA transcripts. RT-PCRs were performed as described in (46). The following Titin primers were used: sense, 5′-aagccaacagtggacgat-3′; antisense, 5′-gtggcatttacagaataggtc-3′.
Supplementary Material
Fig. S1. Efficacy of a3a-engineered T cells in a mouse model of ovarian cancer.
Fig. S2. Activation of a3a-engineered T cells by differentiated human skeletal muscle myoblasts (HSMM) and B cell lymphoma NALM/6 cells.
Fig. S3. Mass spectrometry fragmentation of Titin peptide.
Fig. S4. T cells engineered with wild-type TCR respond to iCells pulsed with Titin peptide.
Table S1. qRT-PCR analysis of MAGE A3/A6/B18 expression in the tumor cell lines used in this study.
Table S2. Alternative MAGE antigens tested for cross-reactivity with a3a-engineered T cells.
Table S3. qRT-PCR analysis of MAGE A3/A6/B18 expression patient heart tissue obtained at autopsy and from tissue obtained from normal hearts.
Table S4. Normal cardiac cells tested for activation of a3a-engineered T cells.
Table S5. qRT-PCR analysis of MAGE A3 expression in iCells and NALM/6 cells.
Table S6. Peptides identified in a BLAST search and tested for cross-reactivity with a3a-engineered T cells.
Video S1. Actively beating iCells.
Acknowledgments
We would like to thank J. Oates for assistance in manuscript preparation.
Funding: Funding for this study was provided by Immunocore Ltd. and Adaptimmune Ltd.
Footnotes
SUPPLEMENTARY MATERIALS
www.sciencetranslationalmedicine.org/cgi/content/full/5/197/197ra103/DC1 Materials and Methods
Author contributions: B.J.C. conceived and designed alanine scanning approach and performed in silico analyses; A.B.G., J.D., J.V.H., J.E.B., G.B., K.J.A., G.P., J.L.R., and A.V.-R. designed and performed cellular assays; F.C.B. and A.V. performed biochemical assays; V.K. and A.S.P. performed MS; F.G. and A.L. performed RT-PCR; M.G. performed qRT-PCR analyses; N.J.P. performed affinity maturation; A.D.B. generated TCR constructs; I.K. performed animal studies; B.L.L. supervised TCR manufacturing; G.P.L., A.P.R., E.A.S., D.D.W., and G.B.-S. wrote clinical protocols; C.H.J. was the regulatory sponsor; N.J.H., M.K., and B.K.J. designed the experiments, analyzed the data, and assisted in the preparation of the manuscript. All authors contributed to manuscript preparation.
Competing interests: B.J.C., J.D., J.V.H., V.K., F.C.B., F.G., G.B., A.V., A.S.P., A.L., N.J.H., and B.K.J. are employees of Immunocore Ltd. A.B.G., J.E.B., K.J.A., A.D.B., N.J.P., D.D.W., G.B.-S., and B.K.J. are employees of Adaptimmune Ltd. A patent has been filed on the sequence and utility of the TCRs used in this study (WO12/03913). The remaining authors declare no competing interests.
REFERENCES AND NOTES
- 1.Restifo NP, Dudley ME, Rosenberg SA. Adoptive immunotherapy for cancer: Harnessing the T cell response. Nat Rev Immunol. 2012;12:269–281. doi: 10.1038/nri3191. [DOI] [PMC free article] [PubMed] [Google Scholar]
- 2.Morgan RA, Yang JC, Kitano M, Dudley ME, Laurencot CM, Rosenberg SA. Case report of a serious adverse event following the administration of T cells transduced with a chimeric antigen receptor recognizing. ERBB2 Mol Ther. 2010;18:843–851. doi: 10.1038/mt.2010.24. [DOI] [PMC free article] [PubMed] [Google Scholar]
- 3.Parkhurst MR, Yang JC, Langan RC, Dudley ME, Nathan DA, Feldman SA, Davis JL, Morgan RA, Merino MJ, Sherry RM, Hughes MS, Kammula US, Phan GQ, Lim RM, Wank SA, Restifo NP, Robbins PF, Laurencot CM, Rosenberg SA. T cells targeting carcinoembryonic antigen can mediate regression of metastatic colorectal cancer but induce severe transient colitis. Mol Ther. 2011;19:620–626. doi: 10.1038/mt.2010.272. [DOI] [PMC free article] [PubMed] [Google Scholar]
- 4.Robbins PF, Morgan RA, Feldman SA, Yang JC, Sherry RM, Dudley ME, Wunderlich JR, Nahvi AV, Helman LJ, Mackall CL, Kammula US, Hughes MS, Restifo NP, Raffeld M, Lee CC, Levy CL, Li YF, El-Gamil M, Schwarz SL, Laurencot C, Rosenberg SA. Tumor regression in patients with metastatic synovial cell sarcoma and melanoma using genetically engineered lymphocytes reactive with NY-ESO-1. J Clin Oncol. 2011;29:917–924. doi: 10.1200/JCO.2010.32.2537. [DOI] [PMC free article] [PubMed] [Google Scholar]
- 5.Kalos M, Rapoport AP, Stadtmauer EA, Vogl DT, Weiss BM, Binder-Scholl GK, Smethurst DP, Kulikovskaya I, Gupta M, Macatee TL, Finklestein JM, Brewer JE, Bennett AD, Gerry AB, Pumphrey NJ, Tayton-Martin HK, Veloso E, Zheng Z, Badros AZ, Yanovich S, Akpek G, McConville H, Philip S, Levine BL, Jakobsen BK, June CH. Prolonged T cell persistence, homing to marrow and selective targeting of antigen positive tumor in multiple myeloma patients following adoptive transfer of T cells genetically engineered to express an affinity-enhanced T cell receptor against the cancer testis antigens NY-ESO-1 and Lage-1. Blood (ASH Annu Meet Abstr) 2012;120:755. [Google Scholar]
- 6.Aleksic M, Liddy N, Molloy PE, Pumphrey N, Vuidepot A, Chang KM, Jakobsen BK. Different affinity windows for virus and cancer-specific T-cell receptors: Implications for therapeutic strategies. Eur J Immunol. 2012;42:3174–3179. doi: 10.1002/eji.201242606. [DOI] [PMC free article] [PubMed] [Google Scholar]
- 7.Manning TC, Parke EA, Teyton L, Kranz DM. Effects of complementarity determining region mutations on the affinity of an α/β T cell receptor: Measuring the energy associated with CD4/CD8 repertoire skewing. J Exp Med. 1999;189:461–470. doi: 10.1084/jem.189.3.461. [DOI] [PMC free article] [PubMed] [Google Scholar]
- 8.Manning TC, Schlueter CJ, Brodnicki TC, Parke EA, Speir JA, Garcia KC, Teyton L, Wilson IA, Kranz DM. Alanine scanning mutagenesis of an αβ T cell receptor: Mapping the energy of antigen recognition. Immunity. 1998;8:413–425. doi: 10.1016/s1074-7613(00)80547-6. [DOI] [PubMed] [Google Scholar]
- 9.Robbins PF, Li YF, El-Gamil M, Zhao Y, Wargo JA, Zheng Z, Xu H, Morgan RA, Feldman SA, Johnson LA, Bennett AD, Dunn SM, Mahon TM, Jakobsen BK, Rosenberg SA. Single and dual amino acid substitutions in TCR CDRs can enhance antigen-specific T cell functions. J Immunol. 2008;180:6116–6131. doi: 10.4049/jimmunol.180.9.6116. [DOI] [PMC free article] [PubMed] [Google Scholar]
- 10.Holler PD, Chlewicki LK, Kranz DM. TCRs with high affinity for foreign pMHC show self-reactivity. Nat Immunol. 2003;4:55–62. doi: 10.1038/ni863. [DOI] [PubMed] [Google Scholar]
- 11.Weber KS, Donermeyer DL, Allen PM, Kranz DM. Class II-restricted T cell receptor engineered in vitro for higher affinity retains peptide specificity and function. Proc Natl Acad Sci USA. 2005;102:19033–19038. doi: 10.1073/pnas.0507554102. [DOI] [PMC free article] [PubMed] [Google Scholar]
- 12.Li Y, Moysey R, Molloy PE, Vuidepot AL, Mahon T, Baston E, Dunn S, Liddy N, Jacob J, Jakobsen BK, Boulter JM. Directed evolution of human T-cell receptors with picomolar affinities by phage display. Nat Biotechnol. 2005;23:349–354. doi: 10.1038/nbt1070. [DOI] [PubMed] [Google Scholar]
- 13.Chervin AS, Aggen DH, Raseman JM, Kranz DM. Engineering higher affinity T cell receptors using a T cell display system. J Immunol Methods. 2008;339:175–184. doi: 10.1016/j.jim.2008.09.016. [DOI] [PMC free article] [PubMed] [Google Scholar]
- 14.Varela-Rohena A, Carpenito C, Perez EE, Richardson M, Parry RV, Milone M, Scholler J, Hao X, Mexas A, Carroll RG, June CH, Riley JL. Genetic engineering of T cells for adoptive immunotherapy. Immunol Res. 2008;42:166–181. doi: 10.1007/s12026-008-8057-6. [DOI] [PMC free article] [PubMed] [Google Scholar]
- 15.van Loenen MM, de Boer R, Amir AL, Hagedoorn RS, Volbeda GL, Willemze R, van Rood JJ, Falkenburg JH, Heemskerk MH. Mixed T cell receptor dimers harbor potentially harmful neoreactivity. Proc Natl Acad Sci USA. 2010;107:10972–10977. doi: 10.1073/pnas.1005802107. [DOI] [PMC free article] [PubMed] [Google Scholar]
- 16.Amos SM, Duong CP, Westwood JA, Ritchie DS, Junghans RP, Darcy PK, Kershaw MH. Autoimmunity associated with immunotherapy of cancer. Blood. 2011;118:499–509. doi: 10.1182/blood-2011-01-325266. [DOI] [PubMed] [Google Scholar]
- 17.Johnson LA, Morgan RA, Dudley ME, Cassard L, Yang JC, Hughes MS, Kammula US, Royal RE, Sherry RM, Wunderlich JR, Lee CC, Restifo NP, Schwarz SL, Cogdill AP, Bishop RJ, Kim H, Brewer CC, Rudy SF, VanWaes C, Davis JL, Mathur A, Ripley RT, Nathan DA, Laurencot CM, Rosenberg SA. Gene therapy with human and mouse T-cell receptors mediates cancer regression and targets normal tissues expressing cognate antigen. Blood. 2009;114:535–546. doi: 10.1182/blood-2009-03-211714. [DOI] [PMC free article] [PubMed] [Google Scholar]
- 18.Caballero OL, Chen YT. Cancer/testis (CT) antigens: Potential targets for immunotherapy. Cancer Sci. 2009;100:2014–2021. doi: 10.1111/j.1349-7006.2009.01303.x. [DOI] [PMC free article] [PubMed] [Google Scholar]
- 19.Gaugler B, Van den Eynde B, van der Bruggen P, Romero P, Gaforio JJ, De Plaen E, Lethé B, Brasseur F, Boon T. Human gene MAGE-3 codes for an antigen recognized on a melanoma by autologous cytolytic T lymphocytes. J Exp Med. 1994;179:921–930. doi: 10.1084/jem.179.3.921. [DOI] [PMC free article] [PubMed] [Google Scholar]
- 20.Brasseur F, Rimoldi D, Liénard D, Lethé B, Carrel S, Arienti F, Suter L, Vanwijck R, Bourlond A, Humblet Y, Vacca A, Conese M, Lahaye T, Degiovanni G, Deraemaecker R, Beauduin M, Sastre X, Salamon E, Dréno B, Jäger E, Knuth A, Chevreau C, Suciu S, Lachapelle JM, Pouillart P, Parmiani G, Lejeune F, Cerottini JC, Boon T, Marchand M. Expression of MAGE genes in primary and metastatic cutaneous melanoma. Int J Cancer. 1995;63:375–380. doi: 10.1002/ijc.2910630313. [DOI] [PubMed] [Google Scholar]
- 21.Patard JJ, Brasseur F, Gil-Diez S, Radvanyi F, Marchand M, François P, Abi-Aad A, Van Cangh P, Abbou CC, Chopin D, Boon T. Expression of mage genes in transitional-cell carcinomas of the urinary bladder. Int J Cancer. 1995;64:60–64. doi: 10.1002/ijc.2910640112. [DOI] [PubMed] [Google Scholar]
- 22.van der Bruggen P, Traversari C, Chomez P, Lurquin C, De Plaen E, Van den Eynde B, Knuth A, Boon T. A gene encoding an antigen recognized by cytolytic T lymphocytes on a human melanoma. Science. 1991;254:1643–1647. doi: 10.1126/science.1840703. [DOI] [PubMed] [Google Scholar]
- 23.Karanikas V, Lurquin C, Colau D, van Baren N, De Smet C, Lethé B, Connerotte T, Corbière V, Demoitié MA, Liénard D, Dréno B, Velu T, Boon T, Coulie PG. Monoclonal anti-MAGE-3 CTL responses in melanoma patients displaying tumor regression after vaccination with a recombinant canarypox virus. J Immunol. 2003;171:4898–4904. doi: 10.4049/jimmunol.171.9.4898. [DOI] [PubMed] [Google Scholar]
- 24.Marchand M, van Baren N, Weynants P, Brichard V, Dréno B, Tessier MH, Rankin E, Parmiani G, Arienti F, Humblet Y, Bourlond A, Vanwijck R, Liénard D, Beauduin M, Dietrich PY, Russo V, Kerger J, Masucci G, Jäger E, De Greve J, Atzpodien J, Brasseur F, Coulie PG, van der Bruggen P, Boon T. Tumor regressions observed in patients with metastatic melanoma treated with an antigenic peptide encoded by gene MAGE-3 and presented by HLA-A1. Int J Cancer. 1999;80:219–230. doi: 10.1002/(sici)1097-0215(19990118)80:2<219::aid-ijc10>3.0.co;2-s. [DOI] [PubMed] [Google Scholar]
- 25.Gotter J, Brors B, Hergenhahn M, Kyewski B. Medullary epithelial cells of the human thymus express a highly diverse selection of tissue-specific genes colocalized in chromosomal clusters. J Exp Med. 2004;199:155–166. doi: 10.1084/jem.20031677. [DOI] [PMC free article] [PubMed] [Google Scholar]
- 26.Connerotte T, Van Pel A, Godelaine D, Tartour E, Schuler-Thurner B, Lucas S, Thielemans K, Schuler G, Coulie PG. Functions of anti-MAGE T-cells induced in melanoma patients under different vaccination modalities. Cancer Res. 2008;68:3931–3940. doi: 10.1158/0008-5472.CAN-07-5898. [DOI] [PubMed] [Google Scholar]
- 27.Linette GP, Stadtmauer EA, Maus MV, Rapoport AP, Levine BL, Emery L, Litzky L, Bagg A, Carreno BM, Cimino PJ, Binder-Scholl GK, Smethurst DP, Gerry AB, Pumphrey NJ, Bennett AD, Brewer JE, Dukes J, Harper J, Tayton-Martin HK, Jakobsen BK, Hassan NJ, Kalos M, June CH. Cardiovascular toxicity and titin cross-reactivity of affinity enhanced T cells in myeloma and melanoma. Blood. 2013 doi: 10.1182/blood-2013-03-490565. [DOI] [PMC free article] [PubMed] [Google Scholar]
- 28.Ma J, Guo L, Fiene SJ, Anson BD, Thomson JA, Kamp TJ, Kolaja KL, Swanson BJ, January CT. High purity human-induced pluripotent stem cell-derived cardiomyocytes: Electrophysiological properties of action potentials and ionic currents. Am J Physiol Heart Circ Physiol. 2011;301:H2006–H2017. doi: 10.1152/ajpheart.00694.2011. [DOI] [PMC free article] [PubMed] [Google Scholar]
- 29.Morgan RA, Chinnasamy N, Abate-Daga D, Gros A, Robbins PF, Zheng Z, Dudley ME, Feldman SA, Yang JC, Sherry RM, Phan GQ, Hughes MS, Kammula US, Miller AD, Hessman CJ, Stewart AA, Restifo NP, Quezado MM, Alimchandani M, Rosenberg AZ, Nath A, Wang T, Bielekova B, Wuest SC, Akula N, McMahon FJ, Wilde S, Mosetter B, Schendel DJ, Laurencot CM, Rosenberg SA. Cancer regression and neurological toxicity following anti-MAGE-A3 TCR gene therapy. J Immunother. 2013;36:133–151. doi: 10.1097/CJI.0b013e3182829903. [DOI] [PMC free article] [PubMed] [Google Scholar]
- 30.Bendle GM, Linnemann C, Hooijkaas AI, Bies L, de Witte MA, Jorritsma A, Kaiser AD, Pouw N, Debets R, Kieback E, Uckert W, Song JY, Haanen JB, Schumacher TN. Lethal graft-versus-host disease in mouse models of T cell receptor gene therapy. Nat Med. 2010;16:565–570. doi: 10.1038/nm.2128. [DOI] [PubMed] [Google Scholar]
- 31.Rosenberg SA. Of mice, not men: No evidence for graft-versus-host disease in humans receiving T-cell receptor–transduced autologous T cells. Mol Ther. 2010;18:1744–1745. doi: 10.1038/mt.2010.195. [DOI] [PMC free article] [PubMed] [Google Scholar]
- 32.Wooldridge L, Ekeruche-Makinde J, van den Berg HA, Skowera A, Miles JJ, Tan MP, Dolton G, Clement M, Llewellyn-Lacey S, Price DA, Peakman M, Sewell AK. A single autoimmune T cell receptor recognizes more than a million different peptides. J Biol Chem. 2012;287:1168–1177. doi: 10.1074/jbc.M111.289488. [DOI] [PMC free article] [PubMed] [Google Scholar]
- 33.Van der Loop FT, Van Eys GJ, Schaart G, Ramaekers FC. Titin expression as an early indication of heart and skeletal muscle differentiation in vitro. Developmental re-organisation in relation to cytoskeletal constituents. J Muscle Res Cell Motil. 1996;17:23–36. doi: 10.1007/BF00140321. [DOI] [PubMed] [Google Scholar]
- 34.Carpenito C, Milone MC, Hassan R, Simonet JC, Lakhal M, Suhoski MM, Varela-Rohena A, Haines KM, Heitjan DF, Albelda SM, Carroll RG, Riley JL, Pastan I, June CH. Control of large, established tumor xenografts with genetically retargeted human T cells containing CD28 and CD137 domains. Proc Natl Acad Sci USA. 2009;106:3360–3365. doi: 10.1073/pnas.0813101106. [DOI] [PMC free article] [PubMed] [Google Scholar]
- 35.Bertozzi CC, Chang CY, Jairaj S, Shan X, Huang J, Weber BL, Chu CS, Carroll RG. Multiple initial culture conditions enhance the establishment of cell lines from primary ovarian cancer specimens. In Vitro Cell Dev Biol Anim. 2006;42:58–62. doi: 10.1290/0512084.1. [DOI] [PubMed] [Google Scholar]
- 36.Parry RV, Rumbley CA, Vandenberghe LH, June CH, Riley JL. CD28 and inducible costimulatory protein Src homology 2 binding domains show distinct regulation of phosphatidylinositol 3-kinase, Bcl-xL, and IL-2 expression in primary human CD4 T lymphocytes. J Immunol. 2003;171:166–174. doi: 10.4049/jimmunol.171.1.166. [DOI] [PubMed] [Google Scholar]
- 37.Dull T, Zufferey R, Kelly M, Mandel RJ, Nguyen M, Trono D, Naldini L. A third-generation lentivirus vector with a conditional packaging system. J Virol. 1998;72:8463–8471. doi: 10.1128/jvi.72.11.8463-8471.1998. [DOI] [PMC free article] [PubMed] [Google Scholar]
- 38.Boulter JM, Glick M, Todorov PT, Baston E, Sami M, Rizkallah P, Jakobsen BK. Stable, soluble T-cell receptor molecules for crystallization and therapeutics. Protein Eng. 2003;16:707–711. doi: 10.1093/protein/gzg087. [DOI] [PubMed] [Google Scholar]
- 39.Garboczi DN, Hung DT, Wiley DC. HLA-A2–peptide complexes: Refolding and crystallization of molecules expressed in Escherichia coli and complexed with single antigenic peptides. Proc Natl Acad Sci USA. 1992;89:3429–3433. doi: 10.1073/pnas.89.8.3429. [DOI] [PMC free article] [PubMed] [Google Scholar]
- 40.O’callaghan CA, Byford MF, Wyer JR, Willcox BE, Jakobsen BK, McMichael AJ, Bell JI. BirA enzyme: Production and application in the study of membrane receptor–ligand interactions by site-specific biotinylation. Anal Biochem. 1999;266:9–15. doi: 10.1006/abio.1998.2930. [DOI] [PubMed] [Google Scholar]
- 41.Liddy N, Bossi G, Adams KJ, Lissina A, Mahon TM, Hassan NJ, Gavarret J, Bianchi FC, Pumphrey NJ, Ladell K, Gostick E, Sewell AK, Lissin NM, Harwood NE, Molloy PE, Li Y, Cameron BJ, Sami M, Baston EE, Todorov PT, Paston SJ, Dennis RE, Harper JV, Dunn SM, Ashfield R, Johnson A, McGrath Y, Plesa G, June CH, Kalos M, Price DA, Vuidepot A, Williams DD, Sutton DH, Jakobsen BK. Monoclonal TCR-redirected tumor cell killing. Nat Med. 2012;8:980–987. doi: 10.1038/nm.2764. [DOI] [PubMed] [Google Scholar]
- 42.McCormack E, Adams KJ, Hassan NJ, Kotian A, Lissin NM, Sami M, Mujić M, Osdal T, Gjertsen BT, Baker D, Powlesland AS, Aleksic M, Vuidepot A, Morteau O, Sutton DH, June CH, Kalos M, Ashfield R, Jakobsen BK. Bi-specific TCR-anti CD3 redirected T-cell targeting of NY-ESO-1- and LAGE-1-positive tumors. Cancer Immunol Immunother. 2012;62:773–785. doi: 10.1007/s00262-012-1384-4. [DOI] [PMC free article] [PubMed] [Google Scholar]
- 43.Altschul SF, Madden TL, Schäffer AA, Zhang J, Zhang Z, Miller W, Lipman DJ. Gapped BLAST and PSI-BLAST: A new generation of protein database search programs. Nucleic Acids Res. 1997;25:3389–3402. doi: 10.1093/nar/25.17.3389. [DOI] [PMC free article] [PubMed] [Google Scholar]
- 44.Storkus WJ, Zeh HJ, III, Salter RD, Lotze MT. Identification of T-cell epitopes: Rapid isolation of class I-presented peptides from viable cells by mild acid elution. J Immunother Emphasis Tumor Immunol. 1993;14:94–103. [PubMed] [Google Scholar]
- 45.Pfaffl MW. A new mathematical model for relative quantification in real-time RT-PCR. Nucleic Acids Res. 2001;29:e45. doi: 10.1093/nar/29.9.e45. [DOI] [PMC free article] [PubMed] [Google Scholar]
- 46.Du MR, Zhou WH, Yan FT, Zhu XY, He YY, Yang JY, Li DJ. Cyclosporine A induces titin expression via MAPK/ERK signalling and improves proliferative and invasive potential of human trophoblast cells. Hum Reprod. 2007;22:2528–2537. doi: 10.1093/humrep/dem222. [DOI] [PubMed] [Google Scholar]
Associated Data
This section collects any data citations, data availability statements, or supplementary materials included in this article.
Supplementary Materials
Fig. S1. Efficacy of a3a-engineered T cells in a mouse model of ovarian cancer.
Fig. S2. Activation of a3a-engineered T cells by differentiated human skeletal muscle myoblasts (HSMM) and B cell lymphoma NALM/6 cells.
Fig. S3. Mass spectrometry fragmentation of Titin peptide.
Fig. S4. T cells engineered with wild-type TCR respond to iCells pulsed with Titin peptide.
Table S1. qRT-PCR analysis of MAGE A3/A6/B18 expression in the tumor cell lines used in this study.
Table S2. Alternative MAGE antigens tested for cross-reactivity with a3a-engineered T cells.
Table S3. qRT-PCR analysis of MAGE A3/A6/B18 expression patient heart tissue obtained at autopsy and from tissue obtained from normal hearts.
Table S4. Normal cardiac cells tested for activation of a3a-engineered T cells.
Table S5. qRT-PCR analysis of MAGE A3 expression in iCells and NALM/6 cells.
Table S6. Peptides identified in a BLAST search and tested for cross-reactivity with a3a-engineered T cells.
Video S1. Actively beating iCells.