

Abstract
Background
Debate over the cardiometabolic risk associated with metabolically healthy obesity (MHO) continues. Many studies have investigated this relationship by examining MHO at baseline with longitudinal follow-up, with inconsistent results.
Objectives
We hypothesized that MHO at baseline is transient and that transition to metabolic syndrome (MetS) and duration of metabolic syndrome explains heterogeneity in incident cardiovascular disease (CVD) and all-cause mortality.
Methods
Among 6,809 participants of the Multi-Ethnic Study of Atherosclerosis we used Cox proportional hazards and logistic regression models to investigate the joint association of obesity (≥30kg/m2) and MetS (IDF consensus definition) with CVD and mortality across a median of 12.2 years. We tested for interaction and conducted sensitivity analyses for a number of conditions.
Results
Compared to metabolically healthy normal weight, baseline MHO was not significantly associated with incident CVD; however, almost half of those participants developed MetS during follow-up (unstable MHO). Those who had unstable MHO had increased odds of CVD (OR=1.60 (1.14-2.25)), compared to those with stable MHO and healthy normal weight. Dose response for duration of MetS was significantly and linearly associated with CVD (1 visit with MetS OR=1.62 (1.27-2.07); 2 visits OR=1.92 (1.48-2.49); 3+ visits OR=2.33 (1.89-2.87); p-value for trend <0.001) and MetS mediated approximately 62% (44-100%) of the relationship between obesity at any point during follow-up and CVD.
Conclusions
Metabolically healthy obesity is not a stable or reliable indicator of future risk for CVD. Weight loss and lifestyle management for CVD risk factors should be recommended to all individuals with obesity.
Keywords: Metabolically healthy obesity, Cardiovascular disease, Mortality, Metabolic syndrome, Obesity, Epidemiology
Introduction
The high prevalence of obesity is a costly burden on the US healthcare system.(1) Finding a subset of the population that is resilient to the effects of obesity on cardiovascular outcomes is of great interest in order to focus limited resources on those most at risk and to develop novel treatments that might target these resiliencies. This condition of having obesity without metabolic syndrome (MetS) is referred to as metabolically healthy obesity (MHO). Individuals with MHO display a relatively favorable metabolic profile compared to the group that has already developed the health consequences of obesity referred to as metabolically unhealthy obesity (MUO), despite having comparable levels of total excess body fat.(2-4) MHO has also been associated with intermediate levels of visceral adiposity and cardiovascular risk,(5,6) between metabolically healthy normal weight (MHN) and MUO.(7-10) MHO is not a stable state,(11-15) with our prior work showing that a large proportion of individuals with MHO will transition to MUO, at a rate associated with their cumulative exposure to obesity.(16) The level of risk remains contentious, especially for mortality, with MHO seen as either a marker of true resilience or as a transient state on the pathway to risk.
While the accumulating evidence is leaning towards the consensus that MHO is not a low risk state compared to MHN,(7-10,17) many questions remain about the risk stratification for this group and what causes the heterogeneity seen in the literature.(18) To answer those questions, we posed 3 a priori hypotheses in the Multi-Ethnic Study of Atherosclerosis:
Those with MHO at baseline will be at intermediate risk for CVD events and all-cause mortality between estimates for those with MHN and MUO.
Transition to MetS will explain a significant portion of the variance in CVD risk for those with MHO at baseline, and there will be a significant dose response relationship between duration of MetS and CVD.
The relationship between obesity and CVD will be substantially mediated by MetS, explaining a lack of an independent association of obesity with CVD when adjusted for MetS.
Methods
Study Population
The Multi-Ethnic Study of Atherosclerosis (MESA) is a population-based longitudinal cohort study started in 2000 with 6,814 participants recruited from six sites in the United States (19). Clinical evaluation was repeated every 2 years, for a total of 5 study visits included in this analysis. We excluded participants with CVD events before baseline (n=5). Other exclusions are described below. All participants provided written informed consent and data collection was overseen by institutional review boards at all MESA sites.
Measurement of Metabolic Status
We divided the MESA participants into 4 groups, based on their obesity and MetS status at baseline. We defined obesity as a BMI ≥30kg/m2 and used the harmonized International Diabetes Federation criteria for MetS (Table 1) (20). All MetS components were measured using a standardized protocol at all study visits.(19) We used this definition to characterize MetS as present or absent at baseline; ever as having MetS at any time during follow-up; intermittent as having MetS at any visit followed by not having MetS at the subsequent visit and consistent as having MetS at any visit followed only by visits with MetS; and MetS duration as the cumulative number of visits with MetS. Combining obesity status with MetS, we categorized 4 metabolic status groups as shown in Table 1. We generated these categories separately for every visit in MESA and used them to define metabolic status groups at baseline, as well as transition from MHO to MUO during follow-up. For our primary analysis of transition from MHO to MUO, we excluded 968 participants with metabolically unhealthy normal weight at baseline (MUN) and 836 participants who transitioned from MHN to MUN during follow-up, for a final sample size of 5005. Of the 5005 participants included in the primary analysis, 2,254 had obesity at baseline.
Table 1. Definition of metabolic syndrome and metabolically healthy obesity.
| Harmonized International Diabetes Federation criteria for metabolic syndrome (MetS): ≥3 of the following components: |
|---|
|
| Metabolic Status Groups: |
|
Cardiovascular Disease Events and All-Cause Mortality
Primary outcomes for this analysis included incident coronary heart disease (fatal and non-fatal), stroke (fatal and non-fatal), heart failure, combined cardiovascular disease (coronary heart disease, stroke, and heart failure), and all-cause mortality. Systematic attainment and adjudication of events in MESA has been described in detail elsewhere.(21).
Covariates
Age, sex, race/ethnicity, education and income, and smoking status, were self-reported at baseline. Physical activity was also self-reported at baseline as total intentional exercise in metabolic equivalent units. Since CVD risk factors are included in the MetS definition, most were not included in statistical models as potential confounders. LDL cholesterol and statin use were measured at clinic visits similar to MetS components.
Statistical Analysis
We characterized the metabolic status groups at baseline using means and standard deviations and Cuzick's non-parametric test for trend. We similarly described baseline characteristics by groups with different MetS duration across follow-up. We used Cox proportional hazards models to estimate the associations for metabolic status groups at baseline with MHN as the reference. We used nested models to adjust for confounding that included: Model 1- No adjustment; Model 2- Age; Model 3- Age, sex, race/ethnicity, education, and income; Model 4- Model 3 with the addition of smoking, LDL cholesterol, and statin use. We then used logistic regression with the final adjustment model instead of Cox proportional hazards models for the rest of the analyses, because variables that accounted for cumulative exposure did not allow for a calculation of person-time. As such, we assessed whether transitioning from MHO at baseline to MUO during follow-up was associated with higher odds of CVD and mortality compared to remaining MHO. We also determined the association for never vs. ever having MetS during follow-up, and duration of MetS adjusted for concurrent obesity status to assess dose response to cumulative exposure. We estimated the association of having intermittent compared to consistent MetS. We also formally tested for mediation of the relationship between obesity and CVD by MetS using the Hicks and Tingley method (22). All analyses were conducted using Stata 14.(23).
Sensitivity Analysis
We assessed the sensitivity of our results to the use of hard CVD events (myocardial infarction, resuscitated cardiac arrest, CHD death, stroke, and stroke death) compared to all CVD events and to adjustment for physical activity. We formally tested for effect modification by age, sex, and race/ethnicity using interaction terms. We also determined whether results were similar for different definitions of MetS including 1. Harmonized IDF definition that does not include waist circumference as a component and 2. A definition with a “super healthy” reference group that has no components of MetS. Finally, we estimated the association with CVD for a certain specific subgroup of interest with resilience to long-term exposure to obesity, defined by participants with obesity at every visit but no MetS. All sensitivity analyses were conducted using the final adjustment model (Model 4).
Results
Baseline demographic and socioeconomic factors differed significantly between the metabolic status groups, as did statin use, but not total or LDL cholesterol or current smoking status (Table 2). Baseline risk factor prevalence, including BMI, for those who transitioned from MHO to MUO were generally in between estimates of those who were consistently MHO or MUO across the study period. Estimates for events exhibited a similar pattern, with the exception of mortality. Baseline risk factors and CVD and mortality prevalence at follow-up also showed a significant increasing trend across MetS duration (Table 3).
Table 2. Characteristics (Mean (SD)) of 5,005 MESA participants by obesity and metabolic syndrome status across follow-up.
| Characteristic | MHN (n=2751) | MHO (n=550) | MHO to MUO (n=501) | MUO (n=1203) | p-value * |
|---|---|---|---|---|---|
| Baseline | |||||
| Age (years) | 62.1 (0.20) | 58.0 (0.41) | 59.5 (0.41) | 61.0 (0.27) | 0.001 |
| Sex (% Female) | 45.9 (1.00) | 60.7 (2.08) | 54.5 (2.23) | 59.9 (1.41) | <0.001 |
| Race | |||||
| Caucasian | 44.8 (0.95) | 35.6 (2.04) | 37.9 (2.17) | 20.7 (1.33) | |
| Asian | 16.2 (0.70) | 1.09 (0.44) | 1.60 (0.56) | 2.49 (0.45) | <0.001 |
| African American | 23.0 (0.80) | 41.3 (2.10) | 36.5 (2.15) | 26.7 (1.39) | |
| Hispanic | 15.9 (0.70) | 22.0 (1.77) | 24.0 (1.91) | 30.2 (1.32) | |
| Education (% ≥ high school) | 96.6 (0.65) | 87.8 (1.40) | 83.8 (1.65) | 77.2 (1.21) | <0.001 |
| Income (% ≥$35,000) | 61.4 (0.93) | 60.4 (2.11) | 59.8 (2.20) | 49.8 (1.46) | <0.001 |
| Current Smoking (%) | 13.0 (0.64) | 12.0 (1.39) | 11.6 (1.43) | 14.1 (1.00) | 0.52 |
| Physical Activity (METS) | 1767 (48.5) | 1658 (112.0) | 1479 (90.7) | 1226 (57.1) | <0.001 |
| Total Cholesterol (mg/dL) | 193.3 (0.64) | 195.8 (1.42) | 195.6 (1.61) | 192.4 (1.09) | 0.67 |
| LDL Cholesterol (mg/dL) | 116.8 (0.59) | 120.2 (1.20) | 120.9 (1.44) | 115.9 (0.97) | 0.97 |
| Statin Use (%) | 11.6 (0.61) | 10.5 (1.31) | 17.2 (1.69) | 21.9 (1.19) | <0.001 |
| BMI (kg/m2) | 24.6 (0.06) | 32.7 (0.19) | 34.0 (0.20) | 34.5 (0.14) | <0.001 |
| Waist Circumference (cm) | 88.6 (0.19) | 106.0 (0.53) | 111.2 (0.52) | 112.9 (0.36) | <0.001 |
| HDL Cholesterol (mg/dL) | 56.8 (0.30) | 55.3 (0.58) | 47.8 (0.54) | 44.6 (0.32) | <0.001 |
| Triglycerides (mg/dL) | 98.4 (0.95) | 99.0 (2.02) | 136.3 (3.52) | 163.1 (2.93) | <0.001 |
| Hypertension (%) | 27.4 (0.85) | 23.5 (1.81) | 53.7 (2.23) | 65.8 (1.37) | <0.001 |
| Systolic BP (mmHg) | 120.6 (0.39) | 121.0 (0.76) | 128.2 (0.92) | 132.8 (0.58) | <0.001 |
| Type 2 Diabetes (%) | 3.72 (0.36) | 2.74 (0.70) | 5.04 (0.98) | 31.1 (1.34) | <0.001 |
| Fasting Glucose (mg/dL) | 88.7 (0.37) | 87.6 (0.57) | 94.5 (0.93) | 112.5 (1.18) | <0.001 |
| Across Follow-Up | |||||
| Coronary Heart Disease (%) | 5.74 (0.44) | 3.64 (0.80) | 6.59 (1.11) | 11.3 (0.91) | <0.001 |
| Stroke (%) | 2.33 (0.29) | 2.18 (0.62) | 3.19 (0.79) | 5.15 (0.64) | <0.001 |
| Heart Failure (%) | 2.69 (0.31) | 2.55 (0.67) | 3.79 (0.85) | 6.57 (0.71) | <0.001 |
| Combined CVD (%) | 8.43 (0.52) | 6.00 (1.01) | 10.2 (1.35) | 16.5 (1.07) | <0.001 |
| Mortality (%) | 14.1 (0.66) | 8.55 (1.19) | 7.19 (1.15) | 15.8 (1.05) | 0.81 |
p-value from Cizick's non-parametric test for trend.
MHN = Metabolically healthy normal weight throughout; MHO = Metabolically healthy obesity throughout; MHO to MUO = Transition from metabolically healthy obesity at baseline to metabolically unhealthy obesity; MUO = Metabolically unhealthy obesity throughout
Table 3. Characteristics (Mean (SD)) of 2,254 MESA participants with obesity by metabolic syndrome duration across follow-up.
| Characteristic | No MetS (n=550) | 1 Visit (n=382) | 2 Visits (n=302) | 3+ Visits (n=1020) | p-value * |
|---|---|---|---|---|---|
| Baseline | |||||
| Age (years) | 58.0 (0.41) | 60.9 (0.51) | 60.8 (0.55) | 60.3 (0.29) | <0.001 |
| Current Smoking (%) | 12.0 (1.39) | 13.1 (1.73) | 17.2 (2.18) | 12.4 (1.03) | 0.84 |
| Total Cholesterol (mg/dL) | 196 (1.42) | 193 (1.71) | 192 (2.27) | 194 (1.19) | 0.27 |
| LDL Cholesterol (mg/dL) | 120 (1.200 | 119 (1.53) | 117 (2.10) | 117 (1.06) | 0.008 |
| Statin Use (%) | 10.5 (1.31) | 16.2 (1.89) | 19.2 (2.27) | 22.5 (1.31) | <0.001 |
| BMI (kg/m2) | 32.7 (0.19) | 34.0 (0.23) | 33.9 (0.28) | 34.6 (0.15) | <0.001 |
| Waist Circumference (cm) | 106 (0.53) | 111 (0.60) | 111 (0.80) | 113 (0.37) | <0.001 |
| HDL Cholesterol (mg/dL) | 55.3 (0.58) | 48.9 (0.66) | 46.5 (0.64) | 44.1 (0.340 | <0.001 |
| Triglycerides (mg/dL) | 99.0 (2.02) | 130 (5.700 | 141 (4.57) | 169 (2.88) | <0.001 |
| Hypertension (%) | 23.5 (1.81) | 49.7 (2.560 | 57.9 (2.85) | 68.1 (1.56) | <0.001 |
| Systolic BP (mmHg) | 121 (0.76) | 129 (1.05) | 130 (1.19) | 133 (0.63) | <0.001 |
| Type 2 Diabetes (%) | 2.74 (0.70) | 12.4 (1.70) | 15.4 (2.10) | 29.9 (1.44) | <0.001 |
| Fasting Glucose (mg/dL) | 87.6 (0.57) | 98.8 (1.65) | 101 (1.68) | 112 (1.25) | <0.001 |
| Across Follow-Up | |||||
| Combined CVD (%) | 6.0 (1.01) | 12.0 (1.67) | 12.6 (1.91) | 16.2 (1.150 | <0.001 |
| Mortality (%) | 8.5 (1.19) | 19.1 (2.01) | 14.9 (2.05) | 10.6 (0.96) | 0.88 |
p-value for Cizick non-parametric test for trend
MetS=Metabolic syndrome
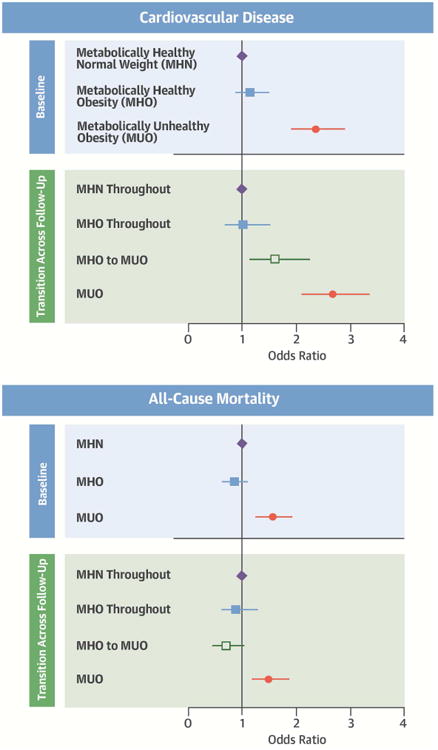
With a median follow-up time of 12.2 years, 791 CVD events and 975 deaths were recorded. Cox proportional hazards models for each event type produced estimates of significantly increased risk for the groups with MetS (MUN and MUO), but not for MHO compared to MHN at baseline (Online Table 1). Survival estimates for MHO at baseline were predominantly non-significant and even close to null, with the exception of positive estimates for heart failure and inverse for the unadjusted model for mortality. There was no evidence of deviation from the proportional hazards assumption using scaled Schoenfeld residuals. Models investigating transition in metabolic status groups across follow-up are similar to Cox proportional hazards results, but indicate significant heterogeneity in the group with MHO at baseline (Central Illustration). Of those with MHO at baseline, 48% (501/1051) developed MetS during follow-up and then had an increased risk for CVD compared to those who stayed MHO, and to the MHN reference group. Results for coronary heart disease, stroke, and heart failure were similar to combined CVD results (Online Figure 1).
Central Illustration. Metabolically Healthy Oobesity with Cardiovascular Disease.
Association of metabolically healthy obesity with cardiovascular disease and all-cause mortality (Odds ratios and 95% confidence intervals) in 5841 MESA participants. MHN=Metabolically heathy normal weight; MHO=Metabolically healthy obesity; MUO=Metabolically unhealthy obesity (categories are mutually exclusive). Metabolically healthy indicates <3 metabolic syndrome components. Unhealthy indicates 3 or more metabolic syndrome components. All models adjusted for age, sex, race/ethnicity, education, income, smoking status, LDL cholesterol, and statin use. Sample sizes: At baseline n=3587 for MHN; n=1051 for MHO; n = 1,203 for MUO. For transition across follow-up n = 2,751 for MHN; n = 550 for MHO throughout; n = 501 for MHO to MUO; and n = 1,203 for MUO.
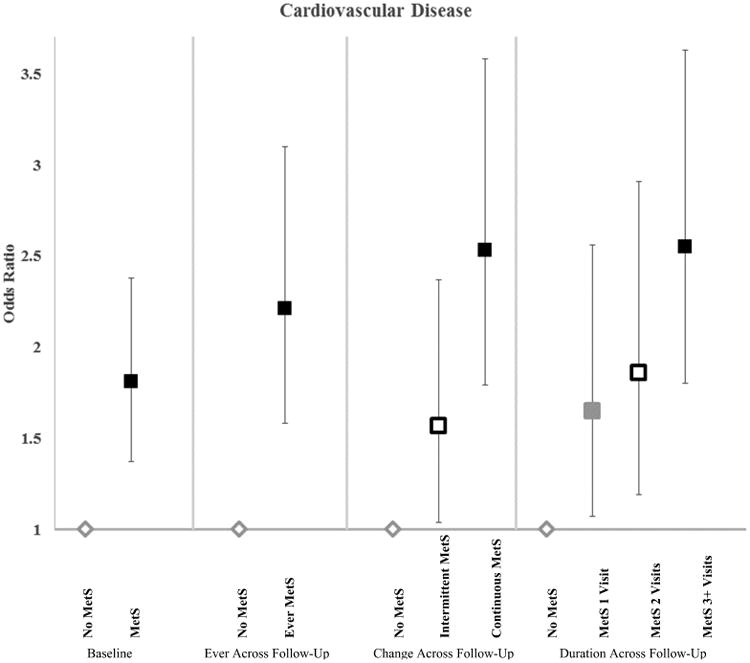
Among participants with obesity, CVD estimates for the group that had ever had MetS were similar to baseline estimates, and the estimates for intermittent MetS fell between those with no MetS and those with consistent MetS (Figure 1). Duration of MetS was significantly associated with higher odds of CVD in a graded and linear fashion (p-value for trend <0.001), with an odds ratio of 1.42 (1.07-1.89) for every additional visit of MetS specifically after transition from MHO at baseline. Results were similar for participants who were normal weight (Online Table 2).
Figure 1. Association of metabolic syndrome with cardiovascular disease (Odds ratios and 95% confidence intervals) in 2744 MESA participants with obesity.
Estimates for Baseline, Ever Across Follow-Up, and Change Across Follow-Up are significantly different at the p<0.05 level. For duration of MetS p-value for trend was p<0.001. MetS=Metabolic syndrome. All models adjusted for age, sex, race/ethnicity, education, income, smoking status, LDL cholesterol, and statin use. Sample sizes: At baseline n=1033 for No MetS; n=1159 for MetS. Ever across follow-up n=685 for No MetS and n=2059 for Ever MetS. Change across follow-up n=685 for No MetS; n=1434 for Intermittent MetS; n=625 for Continuous MetS. Duration across follow-up n=685 for No MetS; n=448 for MetS 1 visit; n=371 for MetS 2 Visits; n=1240 for MetS 3+ Visits.
CVD odds ratios for obesity compared to normal weight, unadjusted for MetS, displayed a similar pattern to those of MetS with a significant estimate for baseline obesity (OR=1.49 (1.26-1.78)); an intermediate estimate for intermittent (OR=1.12 (0.83-1.52) compared to consistent obesity (1.52 (1.27-1.81); and a significant linear trend for higher obesity duration (p<0.001). Estimates for obesity are strongly attenuated and non-significant when adjusted for MetS (not shown). Mediation analysis indicated that 62% (44-100%) of the ever obesity effect was mediated by ever MetS.
Sensitivity Analyses
Formal analysis of interaction produced little evidence of significant heterogeneity (p>0.10), except for CVD by age (p<0.001) and race/ethnicity (p=0.079), with stronger associations for younger participants and Hispanics (Table 4). Estimates for Asian participants were omitted due to instability from small sample sizes. We found some mild attenuation for smoking status subgroup analysis, adjustment for physical activity, including only hard CVD events, excluding waist circumference from the MetS definition, and excluding overweight from the reference group. Using a definition of healthy with only one MetS component produced attenuated results for MHO; however, with only 0.4% (27/6890) participants categorized as MHO at baseline there were few participants left to transition to the unhealthy state. Compared to participants who were MHN at all visits, those who had obesity at all 5 visits but did not have MetS had an odds ratio for CVD of 0.41 (0.15-1.13); obesity and one visit with MetS (OR=1.06 (0.52-2.16)); obesity and 2 or 3 visits with MetS (OR=2.19 (1.37-3.51)); and obesity and 4-5 visits with MetS (OR=2.50(1.79-3.49)).
Table 4. Sensitivity analyses for combined cardiovascular disease and all-cause mortality (odds ratios and 95% confidence intervals) by metabolic status and metabolic syndrome transition.
| Cardiovascular Disease | Mortality | ||||
|---|---|---|---|---|---|
| Model (n) | Metabolic Status* | OR | 95% CI | OR | 95% CI |
| Primary Analysis | |||||
| (4859) | MHN | 1.0 | Ref | 1.0 | Ref |
| MHO | 1.03 | 0.69-1.52 | 0.91 | 0.64-1.30 | |
| MHO to MUO | 1.60 | 1.14-2.25 | 0.70 | 0.48-1.03 | |
| MUO | 2.67 | 2.12-3.37 | 1.51 | 1.20-1.89 | |
| Adjustment for Physical activity | |||||
| (4857) | MHN | 1.0 | Ref | 1.0 | Ref |
| MHO | 1.01 | 0.68-1.50 | 0.74 | 0.53-1.02 | |
| MHO to MUO | 1.57 | 1.12-2.21 | 0.81 | 0.60-1.10 | |
| MUO | 2.60 | 2.06-3.28 | 1.69 | 1.31-2.18 | |
| Hard Events | |||||
| (4859) | MHN | 1.0 | Ref | ||
| MHO | 1.16 | 0.75-1.81 | NA | ||
| MHO to MUO | 1.64 | 1.10-2.42 | |||
| MUO | 2.53 | 1.94-3.30 | |||
| Sex | |||||
| Women | MHN | 1.0 | Ref | 1.0 | Ref |
| (2516) | MHO | 1.46 | 0.81-2.62 | 1.13 | 0.68-1.88 |
| MHO to MUO | 2.00 | 1.17-3.42 | 0.69 | 0.38-1.25 | |
| MUO | 3.18 | 2.17-4.65 | 1.83 | 1.30-2.57 | |
| Men | |||||
| (2343) | MHN | 1.0 | Ref | 1.0 | Ref |
| MHO | 0.80 | 0.46-1.39 | 0.79 | 0.47-1.32 | |
| MHO to MUO | 1.40 | 0.90-2.19 | 0.71 | 0.43-1.18 | |
| MUO | 2.46 | 1.83-3.31 | 1.33 | 0.97-1.82 | |
| p-value for difference | 0.19 | 0.33 | |||
| Age | |||||
| <70 years | MHN | 1.0 | Ref | 1.0 | Ref |
| (3721) | MHO | 0.83 | 0.49-1.41 | 0.70 | 0.43-1.14 |
| MHO to MUO | 1.95 | 1.30-2.90 | 0.61 | 0.37-1.03 | |
| MUO | 3.39 | 2.52-4.55 | 1.53 | 1.13-2.06 | |
| ≥70 years | MHN | 1.0 | Ref | 1.0 | Ref |
| (1138) | MHO | 1.18 | 0.64-2.17 | 0.89 | 0.53-1.50 |
| MHO to MUO | 0.89 | 0.45-1.76 | 0.75 | 0.42-1.33 | |
| MUO | 1.46 | 0.99-2.13 | 1.28 | 0.92-1.78 | |
| p-value for difference | <0.001 | 0.44 | |||
| Race/Ethnicity | |||||
| Caucasian | MHN | 1.0 | Ref | 1.0 | Ref |
| (1938) | MHO | 1.32 | 0.76-2.29 | 1.01 | 0.58-1.76 |
| MHO to MUO | 1.07 | 0.59-1.93 | 0.56 | 0.28-1.12 | |
| MUO | 2.65 | 1.86-3.79 | 1.87 | 1.30-2.69 | |
| African American | |||||
| (1416) | MHN | 1.0 | Ref | 1.0 | Ref |
| MHO | 0.64 | 0.29-1.40 | 0.81 | 0.46-1.46 | |
| MHO to MUO | 1.48 | 0.82-2.68 | 0.65 | 0.35-1.20 | |
| MUO | 2.60 | 1.71-3.93 | 1.34 | 0.92-1.96 | |
| Hispanic | |||||
| (1020) | MHN | 1.0 | Ref | 1.0 | Ref |
| MHO | 1.00 | 0.40-2.51 | 0.86 | 0.37-1.98 | |
| MHO to MUO | 2.98 | 1.55-5.74 | 0.89 | 0.41-1.90 | |
| MUO | 2.80 | 1.69-4.65 | 1.25 | 0.77-2.04 | |
| p-value for difference | 0.079 | 0.50 | |||
| Smoking | |||||
| No | |||||
| (4235) | MHN | 1.0 | Ref | 1.0 | Ref |
| MHO | 1.08 | 0.71-1.65 | 1.06 | 0.73-1.56 | |
| MHO to MUO | 1.66 | 1.16-2.39 | 0.79 | 0.53-1.18 | |
| MUO | 2.70 | 2.10-3.46 | 1.63 | 1.27-2.09 | |
| Yes | |||||
| (624) | MHN | 1.0 | Ref | 1.0 | Ref |
| MHO | 0.73 | 0.24-2.21 | 0.37 | 1.13-1.03 | |
| MHO to MUO | 1.28 | 0.45-3.61 | 0.31 | 0.09-1.12 | |
| MUO | 2.45 | 1.34-4.47 | 1.02 | 0.58-1.78 | |
| p-value for difference | 0.51 | 0.13 | |||
| Metabolic syndrome without waist circumference | |||||
| (4273) | MHN | 1.0 | Ref | 1.0 | Ref |
| MHO | 1.09 | 0.72-1.65 | 0.96 | 0.67-1.39 | |
| MHO to MUO | 1.57 | 1.10-2.25 | 0.65 | 0.43-0.96 | |
| MUO | 2.83 | 2.20-3.64 | 1.48 | 1.16-1.88 | |
| Metabolic syndrome as ≥1 component | |||||
| (2668) | MHN | 1.0 | Ref | 1.0 | Ref |
| MHO | No obs | No obs | |||
| MHO to MUO | 0.92 | 0.11-7.80 | 1.08 | 0.26-4.52 | |
| MUO | 3.69 | 2.12-6.41 | 0.85 | 0.58-1.25 | |
| Reference group excludes overweight | |||||
| (3621) | MHN | 1.0 | Ref | 1.0 | Ref |
| MHO | 1.05 | 0.69-1.61 | 0.84 | 0.58-1.22 | |
| MHO to MUO | 1.63 | 1.12-2.38 | 0.65 | 0.43-0.97 | |
| MUO | 2.74 | 2.07-3.62 | 1.39 | 1.07-1.80 | |
MHN = Metabolically healthy normal weight throughout follow-up
MHO = Metabolically healthy obesity throughout follow-up
MHO to MUO=Transition from metabolically healthy obesity at baseline to metabolically unhealthy obesity during follow-up
MUO = Metabolically unhealthy obesity throughout follow-up
All models are adjusted for age, sex, race/ethnicity, education, income, smoking, LDL, and statin use. Asian participants are excluded only from the race-specific interaction analysis. Hard CVD events include only myocardial infarction, resuscitated cardiac arrest, coronary heart disease death, stroke, and stroke death.
BOLD Indicates estimates that are significantly different from the reference at the p<0.05 level.
Discussion
Among MESA participants, having MHO at baseline was not associated with risk for incident CVD or all-cause mortality; however, this association obscured the heterogeneity in this group. Supporting our hypothesis, almost half of those with MHO at baseline developed MetS during follow-up and then had significantly higher odds of CVD, although lower than for those with MUO from baseline. Higher MetS duration was also significantly associated with CVD, adding dose response evidence to the theory that risk due to obesity is cumulative. The association between obesity and CVD was strongly mediated by MetS, reinforcing the premise that obesity is an originating cause of cardiometabolic risk.
A growing body of work has sought to end the controversy about MHO, but confusion about appropriate clinical recommendations and public health messaging lingers and many questions remain unanswered regarding appropriate advice for individuals. While 4 main meta-analyses came to the similar conclusion that MHO is not necessarily a low risk condition,(7-9,17) they also found high levels of heterogeneity for MHO and MUO and suggest that the literature provides few answers about risk due to longitudinal changes between categories, differences in length of follow-up, adjustment for differing MetS definitions and cardiometabolic fitness, and a lack of diversity in study populations.
Our results support and build on this foundation in several key areas. First, our results provide an explanation at the individual level for why the meta-analyses found an increased risk for MHO only with longer duration of follow-up. Both transition to MetS and longer duration of MetS were associated with CVD, indicating that those with MHO may experience a lag in risk while they progress to MetS and develop the resultant cardiometabolic risk. Similarly, it may be that MHO estimates for mortality are not increased because the lag time is longer for mortality than for CVD and therefore cannot be observed during the follow-up of most studies. There has been special interest in those who appear to have long-term resistance to the consequences of obesity. In MESA, participants with obesity at all 5 visits and no MetS were not at increased risk compared to MHN; however, as reported previously that group differs from the rest of the MESA participants in highly specific ways and makes up only 3% of the cohort.(16) These results and our prior work in MESA suggest that very few individuals can truly maintain long-term metabolic health when exposed to continued obesity (16).
Second, we found that being MHO at baseline does not confer low risk of CVD for individuals who transition to MetS later. The likelihood of underestimating risk based on MHO at a single time point has clear implications for clinical practice and resource management. These results are not entirely consistent with the few prior studies that assessed risk associated with the persistence of MHO.(11-15) While all four conclude that MHO is not a stable condition, their analyses and resulting conclusions differ, from no significant association with MHO,(13) to increased CVD risk from persistent MHO compared to persistent MHN.(12,14) As the only one who addressed the question of transition to MetS directly, Appleton et al. found non-significant associations for MHO at baseline and for transition to MetS.(11) These differences are likely explained by small numbers of events, wide variation in definitions for obesity and MetS, and diverging analytical choices.
Finally, our results fully support the concept that cardiometabolic risk is due to cumulative exposure from obesity, and that prevention of obesity will be central to the prevention of CVD. While the full mechanisms for the pathway from obesity to MetS to CVD remain unknown, evidence like the findings from this study increasingly explain variation in the MetS/CVD relationship through differences in exposure to obesity. MetS prevalence is consistently graded by BMI category (9), and obesity has been repeatedly shown to be one of the strongest risk factors for the development of MetS and its CVD risk factor components (16,24-26). In this respect, MetS may be a marker of the threshold of cumulative obesity exposure that translates to measureable CVD risk. Consistent with our results, a growing consensus indicates that when obesity and MetS are considered together for CVD and mortality, obesity is not an independent risk factor (8). In contrast to the conclusion that obesity is less important for the development of CVD, multiple mediation analyses, including this one, indicate that obesity is likely a major primary cause of both MetS and the resulting CVD risk (27,28).
Study limitations
This study has several limitations. First, this study may not be powered to fully assess interaction and has small numbers of events, which may limit the interpretation of results for certain subgroups. Second, there may be differential loss to follow-up for later visits, which would likely underestimate the associations for CVD. Third, additional considerations for mortality separate from CVD may be necessary to understand why the estimates differ between these 2 outcomes. Lastly, limited measurement of physical activity and cardiorespiratory fitness in MESA restricted our ability to address issues relating to fitness as a determinant and confounder of MHO (29-32).
These limitations are compensated for by numerous strengths and a novel approach. Primarily, this is one of the only studies that directly tests whether those with MHO at baseline maintain this status over time, and are at increased risk for incident CVD. This approach provides answers to several unresolved questions by providing the following evidence: 1. Shows that MHO at baseline may mischaracterize the CVD risk for half the group 2. Explains why studies with longer follow-up report higher risks for MHO on the individual level and 3. Demonstrates a dose response between cumulative exposure to MetS and CVD 4. Provides additional evidence that obesity is an originator of metabolic dysfunction and CVD risk through mediation analysis. Finally, this study presents exceptional consideration of concerns about prior work through extensive sensitivity analyses including removing overweight from the reference group, assessing different definitions of MetS, restricting analysis to hard CVD events, investigating interaction by age, sex, and race/ethnicity, and adjusting for physical activity.
Transition to MetS from MHO at baseline and higher duration of MetS were significantly associated with incident CVD in MESA. Our prior work showed that MHO is an unstable condition for many individuals in MESA.(16) Combined, these results imply that while stable MHO may be a lower risk state, the lack of reliable predictors for MHO stability and the increased risk of transitioning to MUO from continuing obesity itself severely limit the use of MHO to predict future risk in the clinical setting. Further supporting this premise, the higher index of suspicion for all CVD risk factors due to obesity, even in the MHO group, indicates that constant vigilance is necessary to avoid transitioning to MetS and the associated increased likelihood of incident CVD.
Conclusions
These results implicate MHO as an opportunity for primary prevention of CVD, while MUO offers the opportunity only for secondary prevention through treatment of already existing risk factors. Given the strong mediation of the obesity/CVD relationship by MetS, prevention of incident MetS and resulting CVD at the population level will necessitate the prevention of obesity. This study provides new evidence that MHO alone is not a stable or reliable characterization of lower clinical risk. Instead, MHO signals an opportunity for weight reduction, and prevention and management of existing MetS components should be prioritized.
Supplementary Material
Online Figure 1. Transition from metabolically healthy obesity to metabolic syndrome and risk for specific cardiovascular disease events in MESA (Odds ratios and 95% confidence intervals) MHN = Metabolically healthy normal weight throughout; MHO = Metabolically healthy obesity throughout; MHO to MUO = Transition from metabolically healthy obesity at baseline to metabolically unhealthy obesity; MUO = Metabolically unhealthy obesity from baseline
Online Table 1. Cox proportional hazards models incident cause-specific cardiovascular disease and all-cause mortality (hazard ratios and 95% confidence intervals) by baseline obesity and metabolic syndrome status
Online Table 2. Logistic regression for combined cardiovascular disease and all-cause mortality (odds ratios and 95% confidence intervals) by metabolic syndrome status in 4470 MESA participants with normal weight
Acknowledgments
The authors thank the other investigators, the staff, and the participants of the MESA study for their valuable contributions. The information contained herein was derived in part from data provided by the Bureau of Vital Statistics, New York City Department of Health and Mental Hygiene.
Funding: This research was supported by contracts HHSN268201500003I, N01-HC-95159, N01-HC-95160, N01-HC-95161, N01-HC-95162, N01-HC-95163, N01-HC-95164, N01-HC-95165, N01-HC-95166, N01-HC-95167, N01-HC-95168, N01-HC-95169, and HL088451 from the National Heart, Lung, and Blood Institute, as well as UL1-TR-000040 and UL1-TR-001079 from NCRR.
Abbreviations
- BMI
Body mass index
- CVD
Cardiovascular disease
- MESA
Multi-Ethnic Study of Atherosclerosis
- MetS
Metabolic Syndrome
- MHN
Metabolically healthy normal weight
- MUN
Metabolically unhealthy normal weight
- MHO
Metabolically healthy obesity
- MUO
Metabolically unhealthy obesity
Footnotes
Disclosures: CTS was previously employed by Merck Research Laboratories, which played no role in any aspect of this research. The authors declare no other relationships or activities that could appear to have influenced the submitted work.
Clinical Perspectives: Competency in Medical Knowledge: Individuals with metabolically healthy obesity are likely to transition to metabolic syndrome over time. This group should not be considered low risk for cardiometabolic disease and may benefit from weight management and risk factor intervention.
Translational Outlook: Clinical trials of weight loss in patients with metabolically healthy obesity are needed to confirm the benefit of earlier intervention to prevent ischemic events.
Publisher's Disclaimer: This is a PDF file of an unedited manuscript that has been accepted for publication. As a service to our customers we are providing this early version of the manuscript. The manuscript will undergo copyediting, typesetting, and review of the resulting proof before it is published in its final citable form. Please note that during the production process errors may be discovered which could affect the content, and all legal disclaimers that apply to the journal pertain.
References
- 1.Kim DD, Basu A. Estimating the Medical Care Costs of Obesity in the United States: Systematic Review, Meta-Analysis, and Empirical Analysis. Value in Health. 19:602–613. doi: 10.1016/j.jval.2016.02.008. [DOI] [PubMed] [Google Scholar]
- 2.Primeau V, Coderre L, Karelis AD, et al. Characterizing the profile of obese patients who are metabolically healthy. Int J Obes (2005) 2011;35:971–81. doi: 10.1038/ijo.2010.216. [DOI] [PubMed] [Google Scholar]
- 3.Brochu M, Tchernof A, Dionne IJ, et al. What are the physical characteristics associated with a normal metabolic profile despite a high level of obesity in postmenopausal women? J Clin Endocrinol Metab. 2001;86:1020–5. doi: 10.1210/jcem.86.3.7365. [DOI] [PubMed] [Google Scholar]
- 4.Karelis AD, Faraj M, Bastard JP, et al. The metabolically healthy but obese individual presents a favorable inflammation profile. J Clin Endocrinol Metab. 2005;90:4145–50. doi: 10.1210/jc.2005-0482. [DOI] [PubMed] [Google Scholar]
- 5.Hwang YC, Hayashi T, Fujimoto WY, et al. Visceral abdominal fat accumulation predicts the conversion of metabolically healthy obese subjects to an unhealthy phenotype. Int J Obes. 2015;39:1365–1370. doi: 10.1038/ijo.2015.75. [DOI] [PMC free article] [PubMed] [Google Scholar]
- 6.Camhi SM, Katzmarzyk PT. Differences in body composition between metabolically healthy obese and metabolically abnormal obese adults. Int J Obes (2005) 2014;38:1142–5. doi: 10.1038/ijo.2013.208. [DOI] [PMC free article] [PubMed] [Google Scholar]
- 7.Eckel N, Meidtner K, Kalle-Uhlmann T, Stefan N, Schulze MB. Metabolically healthy obesity and cardiovascular events: A systematic review and meta-analysis. Eur J Prev Cardio. 2016;23:956–66. doi: 10.1177/2047487315623884. [DOI] [PubMed] [Google Scholar]
- 8.Fan J, Song Y, Chen Y, Hui R, Zhang W. Combined effect of obesity and cardio-metabolic abnormality on the risk of cardiovascular disease: a meta-analysis of prospective cohort studies. Int J Cardiol. 2013;168:4761–8. doi: 10.1016/j.ijcard.2013.07.230. [DOI] [PubMed] [Google Scholar]
- 9.Kramer CK, Zinman B, Retnakaran R. Are metabolically healthy overweight and obesity benign conditions?: A systematic review and meta-analysis. Ann Intern Med. 2013;159:758–69. doi: 10.7326/0003-4819-159-11-201312030-00008. [DOI] [PubMed] [Google Scholar]
- 10.Caleyachetty R, Thomas GN, Toulis KA, et al. Metabolically Healthy Obese and Incident Cardiovascular Disease Events Among 3.5 Million Men and Women. J Am Coll Cardiol. 2017;70:1429–1437. doi: 10.1016/j.jacc.2017.07.763. [DOI] [PubMed] [Google Scholar]
- 11.Appleton SL, Seaborn CJ, Visvanathan R, et al. Diabetes and cardiovascular disease outcomes in the metabolically healthy obese phenotype: a cohort study. Diabetes care. 2013;36:2388–94. doi: 10.2337/dc12-1971. [DOI] [PMC free article] [PubMed] [Google Scholar]
- 12.Arnlov J, Sundstrom J, Ingelsson E, Lind L. Impact of BMI and the metabolic syndrome on the risk of diabetes in middle-aged men. Diabetes care. 2011;34:61–5. doi: 10.2337/dc10-0955. [DOI] [PMC free article] [PubMed] [Google Scholar]
- 13.Kaur A, Johnston DG, Godsland IF. Does metabolic health in overweight and obesity persist?- Individual variation and cardiovascular mortality over two decades. Eur J Endocrinol. 2016;175:133–43. doi: 10.1530/EJE-16-0095. [DOI] [PubMed] [Google Scholar]
- 14.Kim NH, Seo JA, Cho H, et al. Risk of the Development of Diabetes and Cardiovascular Disease in Metabolically Healthy Obese People: The Korean Genome and Epidemiology Study. Medicine. 2016;95:e3384. doi: 10.1097/MD.0000000000003384. [DOI] [PMC free article] [PubMed] [Google Scholar]
- 15.Kuk JL, Ardern CI. Are metabolically normal but obese individuals at lower risk for all-cause mortality? Diabetes care. 2009;32:2297–9. doi: 10.2337/dc09-0574. [DOI] [PMC free article] [PubMed] [Google Scholar]
- 16.Mongraw-Chaffin M, Foster MC, Kalyani RR, et al. Obesity severity and duration are associated with incident metabolic syndrome: Evidence against metabolically healthy obesity from the Multi-Ethnic Study of Atherosclerosis. J Clin Endocrinol Metab. 2016;101:4117–4124. doi: 10.1210/jc.2016-2460. [DOI] [PMC free article] [PubMed] [Google Scholar]
- 17.Zheng R, Zhou D, Zhu Y. The long-term prognosis of cardiovascular disease and all-cause mortality for metabolically healthy obesity: a systematic review and meta-analysis. J Epidemiol Community Health. 2016;70:1024–31. doi: 10.1136/jech-2015-206948. [DOI] [PubMed] [Google Scholar]
- 18.Karelis AD. Metabolically healthy but obese individuals. Lancet (London, England) 2008;372:1281–3. doi: 10.1016/S0140-6736(08)61531-7. [DOI] [PubMed] [Google Scholar]
- 19.Bild DE, Bluemke DA, Burke GL, et al. Multi-Ethnic Study of Atherosclerosis: objectives and design. Am J Epidemiol. 2002;156:871–81. doi: 10.1093/aje/kwf113. [DOI] [PubMed] [Google Scholar]
- 20.Alberti KG, Eckel RH, Grundy SM, et al. Harmonizing the metabolic syndrome: a joint interim statement of the International Diabetes Federation Task Force on Epidemiology and Prevention; National Heart, Lung, and Blood Institute; American Heart Association; World Heart Federation; International Atherosclerosis Society; and International Association for the Study of Obesity. Circulation. 2009;120:1640–5. doi: 10.1161/CIRCULATIONAHA.109.192644. [DOI] [PubMed] [Google Scholar]
- 21.MESA Coordinating Center. MESA Events Data Documentation: MESA Events thru Calendar Years. 2013 [Google Scholar]
- 22.Tingley RHaD. mediation: STATA package for causal mediation analysis. 2011 [Google Scholar]
- 23.StataCorp. Stata Statistical Software: Release 14. College Station, TX: StataCorp LP; 2009. [Google Scholar]
- 24.Palaniappan L, Carnethon MR, Wang Y, et al. Predictors of the incident metabolic syndrome in adults: the Insulin Resistance Atherosclerosis Study. Diabetes care. 2004;27:788–93. doi: 10.2337/diacare.27.3.788. [DOI] [PubMed] [Google Scholar]
- 25.Liese AD, Mayer-Davis EJ, Tyroler HA, et al. Development of the multiple metabolic syndrome in the ARIC cohort: joint contribution of insulin, BMI, and WHR. Atherosclerosis risk in communities Ann Epidemiol. 1997;7:407–16. doi: 10.1016/s1047-2797(97)00047-1. [DOI] [PubMed] [Google Scholar]
- 26.Lavie CJ, Milani RV, Ventura HO. Obesity and Cardiovascular Disease: Risk Factor, Paradox, and Impact of Weight Loss. J Am Coll Cardiol. 2009;53:1925–1932. doi: 10.1016/j.jacc.2008.12.068. [DOI] [PubMed] [Google Scholar]
- 27.Global Burden of Metabolic Risk Factors for Chronic Diseases Collaboration (BMI Mediated Effects) Lu Y, Hajifathalian K, et al. Metabolic mediators of the effects of body-mass index, overweight, and obesity on coronary heart disease and stroke: a pooled analysis of 97 prospective cohorts with 1.8 million participants. Lancet (London, England) 2014;383:970–83. doi: 10.1016/S0140-6736(13)61836-X. [DOI] [PMC free article] [PubMed] [Google Scholar]
- 28.Dhana K, Koolhaas CM, van Rossum EF, et al. Metabolically Healthy Obesity and the Risk of Cardiovascular Disease in the Elderly Population. PloS one. 2016;11:e0154273. doi: 10.1371/journal.pone.0154273. [DOI] [PMC free article] [PubMed] [Google Scholar]
- 29.Ortega FB, Cadenas-Sanchez C, Sui X, Blair SN, Lavie CJ. Role of Fitness in the Metabolically Healthy but Obese Phenotype: A Review and Update. Prog Cardiovasc Dis. 2015;58:76–86. doi: 10.1016/j.pcad.2015.05.001. [DOI] [PubMed] [Google Scholar]
- 30.Ortega FB, Lavie CJ, Blair SN. Obesity and Cardiovascular Disease. Circ Res. 2016;118:1752–70. doi: 10.1161/CIRCRESAHA.115.306883. [DOI] [PubMed] [Google Scholar]
- 31.Lavie CJ, De Schutter A, Parto P, et al. Obesity and Prevalence of Cardiovascular Diseases and Prognosis-The Obesity Paradox Updated. Prog Cardiovasc Dis. 2016;58:537–47. doi: 10.1016/j.pcad.2016.01.008. [DOI] [PubMed] [Google Scholar]
- 32.Lavie CJ, McAuley PA, Church TS, Milani RV, Blair SN. Obesity and Cardiovascular Diseases: Implications Regarding Fitness, Fatness, and Severity in the Obesity Paradox. J Am Coll Cardiol. 2014;63:1345–1354. doi: 10.1016/j.jacc.2014.01.022. [DOI] [PubMed] [Google Scholar]
Associated Data
This section collects any data citations, data availability statements, or supplementary materials included in this article.
Supplementary Materials
Online Figure 1. Transition from metabolically healthy obesity to metabolic syndrome and risk for specific cardiovascular disease events in MESA (Odds ratios and 95% confidence intervals) MHN = Metabolically healthy normal weight throughout; MHO = Metabolically healthy obesity throughout; MHO to MUO = Transition from metabolically healthy obesity at baseline to metabolically unhealthy obesity; MUO = Metabolically unhealthy obesity from baseline
Online Table 1. Cox proportional hazards models incident cause-specific cardiovascular disease and all-cause mortality (hazard ratios and 95% confidence intervals) by baseline obesity and metabolic syndrome status
Online Table 2. Logistic regression for combined cardiovascular disease and all-cause mortality (odds ratios and 95% confidence intervals) by metabolic syndrome status in 4470 MESA participants with normal weight