

Abstract
Recent cochlear mechanical measurements show that active processes increase the motion response of the reticular lamina (RL) at frequencies more than an octave below the local characteristic frequency (CF) for CFs above 5 kHz. A possible correlate is that in high-CF (>5 kHz) auditory-nerve (AN) fibers, responses to frequencies 1–3 octaves below CF (“tail” frequencies) can be inhibited by medial olivocochlear (MOC) efferents. These results indicate that active processes enhance the sensitivity of tail-frequency RL and AN responses. Perhaps related is that some apical low-CF AN fibers have tuning-curve (TC) “side-lobe” response areas at frequencies above and below the TC-tip that are MOC inhibited. We hypothesized that the tail and side-lobe responses are enhanced by the same active mechanisms as CF cochlear amplification. If responses to CF, tail-frequency, and TC-side-lobe tones are all enhanced by prestin motility controlled by outer-hair-cell (OHC) transmembrane voltage, then they should depend on OHC stereocilia position in the same way. To test this, we cyclically changed the OHC-stereocilia mechano-electric-transduction (MET) operating point with low-frequency “bias” tones (BTs) and increased the BT level until the BT caused quasi-static OHC MET saturation that reduced or “suppressed” the gain of OHC active processes. While measuring cat AN-fiber responses, 50 Hz BT level series, 70–120 dB SPL, were run alone and with CF tones, or 2.5 kHz tail-frequency tones, or side-lobe tones. BT-tone-alone responses were used to exclude BT sound levels that produced AN responses that might obscure BT suppression. Data were analyzed to show the BT phase that suppressed the tone responses at the lowest sound level. We found that AN responses to CF, tail-frequency, and side-lobe tones were suppressed at the same BT phase in almost all cases. The data are consistent with the enhancement of responses to CF, tail-frequency, and side-lobe tones all being due to the same OHC-stereocilia MET-dependent active process. Thus, OHC active processes enhance AN responses at frequencies outside of the cochlear-amplified TC-tip region in both high- and low-frequency cochlear regions. The data are consistent with the AN response enhancements being due to enhanced RL motion that drives IHC-stereocilia deflection by traditional RL-TM shear and/or by changing the RL-TM gap. Since tail-frequency basilar membrane (BM) motion is not actively enhanced, the tail-frequency IHC drive is from a vibrational mode little present on the BM, not a “second filter” of BM motion.
Keywords: auditory nerve, cochlear mechanics, micromechanics
1. Introduction
The high sensitivity and frequency selectivity of mammalian hearing is due to active processes in outer hair cells (OHCs) that enhance cochlear mechanical responses to sound (reviewed in Dallos 1996; Guinan et al. 2014). This enhancement, termed “cochlear amplification,” has been attributed to an increase in basilar-membrane (BM) motion and that was thought to fully account for the sensitivity and frequency selectivity of auditory-nerve (AN) fiber responses (Narayan et al. 1998; Ashmore et al. 2010). In contrast to this widely-held view, recent mechanical measurements show that at low sound levels the reticular lamina (RL) moves more and is enhanced by active processes more than is the BM (Lee et al. 2016; Ren et al. 2016). Since the RL is closer to inner-hair-cell (IHC) stereocilia than the BM, RL motion can be expected to have a more direct influence than BM motion in driving IHCs (Guinan, 2012).
IHC stereocilia are deflected primarily by fluid motion, but the cochlear structural motion(s) that produce this fluid motion are poorly understood (Guinan, 2012). Classically, the drive to IHC stereocilia was attributed to direct radial sheer between the RL and the tectorial membrane (TM) (ter Kuile, 1900). With the more recent knowledge that IHC stereocilia are not imbedded in the TM, IHC stereocilia must be deflected by fluid forces and this has usually been attributed to fluid-drag from RL-TM radial shear (e.g. Sellick and Russell, 1980; Freeman and Weiss, 1990a, 1990b). However, in addition to this shear drive, oscillating changes in the width of the RL-TM gap can cause oscillating fluid flow within the gap that also deflects IHC stereocilia (Steele and Puria, 2005; Nowotny and Gummer, 2006, 2011; Guinan 2012). Thus, both radial RL motion (causing shear) and transverse RL motion (causing RL-TM gap changes), as well as other micromechanical motions, may be involved in driving IHC stereocilia. Active-process enhancement of these RL motions could enhance AN responses.
BM measurements in high-CF regions show that active-process enhancement of tone-evoked BM motion is restricted to within an octave of CF (Robles and Ruggero, 2001). In contrast, RL motion is enhanced over a much wider frequency range extending to frequencies more than an octave below CF (called “tail” frequencies) (Ren et al. 2016; Lee et al. 2016). This finding raises several questions: What is the relationship of the enhanced RL motion to the drive to IHCs? Does the enhanced tail-frequency RL motion produce enhanced excitation of AN fibers? Is the active-process that enhances tail-frequency RL motion the same active process that cochlear-amplifies BM motion at CF?
The active process that produces BM cochlear amplification at CF arises from OHC somatic motility. One way to study the effects of OHC active processes is to change OHC properties by stimulating medial olivocochlear (MOC) efferents that synapse on OHCs. Using electrical stimulation of MOC efferents, Stankovic and Guinan (1999, 2000) found that for cat AN fibers with CFs >5 kHz, AN responses were inhibited by MOC activity for near-threshold, tail-frequency tones 1–3 octaves below CF (e.g. Fig 1A). BM motion, in contrast, is little changed by MOC stimulation at frequencies an octave or more below CF (Cooper and Guinan, 2006; Guinan and Cooper, 2008). Stankovic and Guinan attributed the MOC inhibition of tail-frequency AN responses to MOC efferents changing cochlear micromechanics (i.e. the inhibition was not due to a change in BM motion). However, they were not able to say which cochlear structures had tail-frequency motions that were MOC inhibited. We now hypothesize that actively-enhanced RL motion is inhibited by MOC activity and this is what reduces AN tail-frequency responses.
Fig. 1.
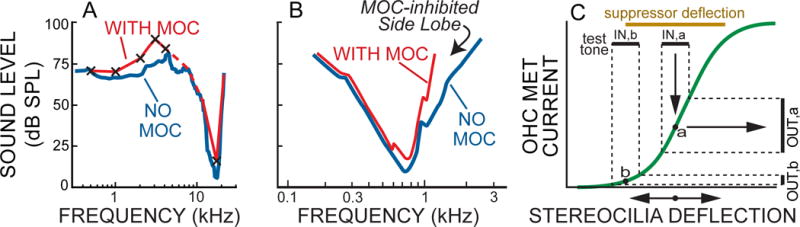
A, B Tuning curves (TCs) from cat auditory-nerve fibers with and without excitation of medial olivocochlear (MOC) efferents. A: A tail-frequency inhibition. B: A side-lobe inhibition. C: Bias-tone suppression of outer-hair-cell (OHC) mechano-electric transduction (MET) current variation at the test-tone frequency. In C, the horizontal lines at top represent the stereocilia-deflection excursions produced by a low-frequency suppressor tone (top line), and by a much-higher-frequency test tone (lower lines). The black line labeled IN,a shows the test-frequency input excursion when the suppressor is not present (this excursion is about point “a” of the MET function represented by the curved line), and the black line labeled IN,b shows the input excursion when the suppressor-produced OHC deflection is at one edge of its excursion (this test-frequency excursion is about point b). The vertical lines at right represent the corresponding OHC-MET-current output excursions at the test-tone frequency. When the suppressor response is at the extreme of its excursion, the output MET current variation at the test-tone frequency is reduced from its no-suppressor value. A was derived from Fig. 6 of Stankovic and Guinan (1999). The no-MOC TC is from their Fig. 6A and the with-MOC TC was derived from the no-MOC TC and the level-shifts from the other panels of their Fig. 6 (shown as X’s here). To fill in the TC, we assumed no MOC inhibition at the upper edges of the TC tip; the dashed line represents a tail region with no MOC-inhibition data. B is a stylized version of AN-fiber TCs from Gifford and Guinan (1988) (shown in Guinan, 2011).
An alternate to MOC stimulation for modifying OHC active processes is to use high-amplitude, low-frequency “bias” tones that produce large deflections of OHC stereocilia. Deflections of OHC stereocilia open and close OHC mechano-electric transduction (MET) channels and the resulting currents change OHC transmembrane voltage and OHC length, and the OHC length changes produce cochlear amplification. The slope of the OHC-current vs. stereocilia-deflection curve sets cochlear-amplification gain with higher slopes producing more amplification (Cai and Geisler, 1996c). A high-amplitude, low-frequency “bias tone” (BT) can quasi-statically push the OHC MET functions into low-slope, saturating edge regions (e.g., in Fig. 1C for a test tone much higher in frequency than the BT: from test-frequency variations around point “a” to variations around point “b”). During a BT-response phase in the low-slope region, the (temporary) effect of the BT is to decrease the MET slope seen by the higher-frequency test tone and thereby decrease or “suppress” the amplification of test-tone responses (OUT,b is smaller than OUT,a in Fig. 1C). Thus, the BT suppresses test-frequency responses whenever the BT quasi-statically moves OHC stereocilia into low-slope MET regions (Fig. 1C). When the OHC MET function is asymmetric (which it is along most of the cochlea in cats – Nam and Guinan, 2016), one low-slope MET edge is reached at a lower BT sound level than the other, which results in one gain reduction per bias-tone cycle and a modulation of the test-tone response that has a large first harmonic of the BT frequency. The BT phase at which this happens is termed the “major suppression phase.” At higher bias-tone levels, stereocilia deflections reach the low-slope regions on both ends of the MET function and there are two gain reductions per bias-tone cycle and modulation of the test-tone response has a large second harmonic of the BT frequency. Many experiments have provided evidence consistent with these bias-tone effects on responses to low-level tones near CF (Sachs and Hubbard, 1981; Sellick et al, 1982; Javel et al., 1983; Patuzzi et al, 1984a, b; Rhode and Cooper, 1993; Cooper 1996; Cai and Geisler 1996a, 1996b; Rhode 2007; Nam and Guinan, 2016).
The MOC inhibition of AN responses to tail-frequency tones is consistent with the hypothesis that the motion driving these responses was amplified. If this amplification is by the same OHC mechanism that amplifies responses to CF tones, then bias tones should affect tail-frequency and CF tone responses in the same way. In particular, both responses should be suppressed at the same phase of a low-frequency BT, i.e. they should have the same major suppression phase. Also, as BT sound level is increased, they should go through the same sequence of first being suppressed at one BT phase and at higher BT levels being suppressed at two (opposite) BT phases. In this paper we test the hypothesis that the active processes that drive AN tail-frequency responses depend on OHC stereocilia position in the same way as the active processes that drive AN responses to CF tones. To do this, AN single-fiber responses to tones at either CF or a tail frequency were measured while the OHC MET channel operating point was slowly changed with a low-frequency (50 Hz) “bias” tone.
Tail-frequency responses are from high-CF cochlear regions. In low-CF (<4 kHz) regions, active-process amplification of cochlear mechanical motion responses are different than in high-CF regions and are more poorly understood (Recio-Spinoso and Oghalai, 2017; Dong et al. 2017). Low-CF cat AN fibers have TCs with sensitive tips similar to those of high-CF fibers, and many low-CF TCs also show side lobes at frequencies above and/or below the tip region (e.g. Fig. 1B) (Liberman and Kiang, 1978; Kiang, 1984; Javel, 1994; van der Heijden and Joris, 2006; Versteegh et al. 2011). Excitation of MOC efferents strongly inhibits these side-lobe responses (Fig. 1B) (Guinan and Gifford, 1988). This MOC inhibition is consistent with the hypothesis that the mechanical drive to IHC stereocilia at the side-lobe frequencies is enhanced by active processes in OHCs. If the TC side lobes receive amplification by OHC processes that are similar to those that amplify responses to CF tones, then bias tones should affect both responses in the same way. In particular, both responses should be suppressed by the same phase of a low-frequency bias tone and go through the same sequence of one, then two, suppression phases as the BT sound level is increased. A second goal of this paper is to test the hypothesis that the active processes that drive AN side-lobe responses and CF tone responses depend on OHC stereocilia position in the same way.
2. Materials and Methods
2.1 Methods Overview and Rationale
Bias-tone suppression was measured by presenting the BT simultaneously with either a CF tone or a non-tip (tail or side-lobe) tone, and determining AN single-fiber tone responses at different phases of the BT period. Tones at CF and non-tip frequencies will be called “test tones” to distinguish them from “bias tones”. At a high-enough sound level, the BT itself can produce AN-response synchronization (or excite AN responses) that may obscure BT suppression. To avoid this problem, we determined an effective BT-alone synchronization threshold so we could exclude supra-threshold BT levels from further consideration. The rationale is that the BT effect of interest is suppression of cochlear amplification in OHCs, not direct BT effects on IHC stereocilia. Since OHC stereocilia are imbedded in the TM, their deflection is directly coupled RL-TM displacement shear. In contrast, IHC stereocilia are freestanding and for low-frequency-tones (e.g. BTs), IHCs are sensitive to the velocity of the fluid in the sub-tectorial space (Sellick and Russell, 1980; Freeman and Weiss, 1990a, b). The low-velocity fluid motion produced by low-frequency BTs drives IHC stereocilia much less than OHC stereocilia. Thus, there can be BT levels at which the BT deflects OHC stereocilia and produces suppression while producing minimal deflections of IHC stereocilia and no significant excitation or synchronization of AN responses. A major task of our methods is to distinguish when there is only BT suppression vs. when the BT, acting directly on IHC stereocilia, also significantly affects the AN firing pattern.
2.2 Animal Preparation
We report here on recordings from 92 single AN fibers from 14 anesthetized cats using methods approved by the Massachusetts Eye and Ear Infirmary animal care committee. The basic methods were similar to those described previously (for more detail see: Stankovic and Guinan, 1999; 2000; Nam and Guinan, 2016). Animals were anesthetized with Nembutal in urethane with boosters given when necessary. Both ear-canals were truncated for insertion of acoustic assemblies and the bulla cavities were exposed to reveal the round windows. A posterior craniotomy was followed by aspiration and retraction of cerebellar tissue to expose the AN. Single AN fibers were recorded using electrolyte-filled pipette electrodes (10–20 MΩ) inserted into the visually-identified AN.
Using a silver electrode near each round window, cochlear compound-action-potential (CAP) audiograms were measured from 2 to 32 kHz at octave intervals using a CAP threshold criterion of 10 μV pp. Cochlear sensitivity at unit CF was evaluated by interpolation of the CAP audiogram data versus frequency. For units with CFs > 2 kHz, all thresholds were within 20 dB of the tone-pip-threshold curve made from good animals. For units with CFs < 2 kHz, all but 4 units had thresholds at 2 kHz and above that were within 20 dB of the good CAP-threshold curves and the remaining 4 units were within 27 dB at 2 kHz and within 20 dB above 2 kHz.
Upon isolating an AN fiber, we obtained a threshold TC, determined CF, and measured spontaneous rate. We then ran BT level series with or without a fixed test tone. To determine the BT level that produced significant AN synchrony, we obtained AN responses using the “BT-alone” paradigm. To determine BT suppression of responses to CF, tail and side-lobe tones, the BT was paired with test-frequency tones using the “BT-on-tone” paradigm. Due to limited AN-fiber contact time, not all paradigms were run on every fiber. In some fibers for which a BT-alone response was not obtained, we used a BT-alone response series from a fiber that had a similar CF (a CF within 0.3 octaves) from the same animal. In the Figures, these fibers are indicated by different symbols than are used for fibers that have their own BT-alone response.
2.3 Acoustics
Test-frequency tones were produced by a reverse-driven condenser earphone. 50 Hz BTs were produced by a DT48 earphone. The BT zero phase reference was the cosine phase of the 50 Hz earphone drive voltage. Each earphone output was calibrated from the microphone response using prior calibrations of the microphone and probe tube.
2.4 BT-Alone and BT-on-Tone Paradigms
For both the BT-alone and the BT-on-tone paradigms, the BT was a 50 Hz tone burst (240 ms plateau, 10 ms rise/fall times, repetition period 500 ms) presented in a randomized level series from 70 to 110 or sometimes 120 dB SPL. The BT-on-tone paradigm also contained a fixed tone burst (225 ms plateau, 5 ms rise/fall times) at the test frequency that started 20 ms after the start of each BT burst (see Fig. 1A of Nam and Guinan, 2016). For a tail-frequency tone burst, the sound level was near the fiber’s threshold at the tail frequency. For side-lobe or CF tone bursts, the sound level was 10 to 20 dB above the fiber’s threshold at the side-lobe or CF frequency. Test-frequency thresholds were determined from the fiber TC.
We used 2.5 kHz as the frequency for tail-frequency tones, based on Stankovic and Guinan’s (1999) finding that MOC inhibition of tail-frequency tones was greatest at 2–3 kHz. Clear side lobes are not shown by many TCs, so for side-lobe frequencies we used tones at frequencies ~1 octave, or more, above or below CF. Side lobes are clearest when there is an upward inflection in the TC between the side lobe and the tip. Presumably this happens when, at a frequency in which the tip and side-lobe drives are equal in amplitude, the tip and side-lobe drives are out of phase and cancel. However, at the frequency where the tip and side-lobe drives are equal in amplitude, they may not be opposite in phase so that there is little or no cancellation and no upward TC cusp. Thus, the lack of a TC upward cusp does not mean that the mechanical vibration mode that produces the side lobe is not present. Based on TCs with visible side lobes (from our TCs and published TCs), our use of frequencies ~1 octave from CF would almost always put the test frequency within the side lobe.
For all paradigms, the data analysis used spikes within a 200 ms window (10 BT periods) starting 10 ms after the onset of the test-tone plateau. Spike times within this window were arranged into “cycle histograms” that show the number of spikes relative to the BT period (e.g. Fig. 2A–C). For BT-on-tone data, the cycle-histogram bin duration was set to the multiple of 10-μs (the spike-recording time resolution) that was closest to the period of the test tone. Making the cycle-histogram bins nearly equal to the tone period effectively filtered out almost all of the synchronization of the fiber to the test tone. Consequently, the BT cycle histograms were little different than they would have been with an exact-integer relationship between the BT and test tones as was used by Sachs and Hubbard (1981), Cai and Geisler (1996a) and others.
Fig. 2.
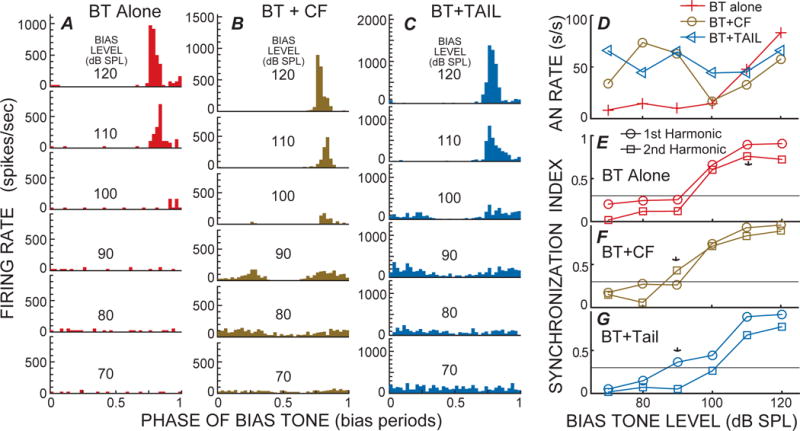
Level series of cycle histograms from 50 Hz bias tones (BTs), A: alone, B: with a low-level CF tone, and C: with a tail-frequency tone, from a fiber with CF=7.14 kHz. D: Rate-level series; E–G: Synchrony index (SI) for first and second harmonics of the BT period histograms from the structures labeled in each panel. * = criterion response. The lines at SI=0.3 show criterion synchrony.
From each BT-alone or BT-on-tone cycle histogram we determined spike synchronization at the first and second harmonics of the BT frequency as quantified by the synchronization index, “SI”. SI varies from zero (no synchronization) to one (all spikes at the same phase). A BT-alone response with a high SI at either the first or second harmonic indicates that the BT has modulated the response in a way that could obscure modulations from BT suppression of test-frequency responses. As in Stankovic and Guinan (1999; 2000) and Nam and Guinan (2016) we considered an SI to be significant if it was 0.3 or greater (termed the target SI (SItarget)). We normally determined the major suppression phase from the 1st harmonic when its SI reached SItarget, but when the 2nd harmonic exceeded SItarget, the major suppression phase was determined by a “half-period synchrony analysis” (Nam and Guinan, 2016). For this, the BT-cycle histogram was divided into two 2nd-harmonic cycle histograms and for each we calculated the synchrony index at the 2nd-harmonic frequency. The suppression phase of the half-period histogram with the higher synchrony was used as the major suppression phase in the original cycle histogram. A second method, in which the major suppression phase was the time of maximum suppression in a cycle histogram that combined the 1st and 2nd harmonics of the original histogram, normally yielded almost identical results.
2.6 Analysis to determine Excitation and Suppression
First we had to determine when the BT alone produced enough spike synchronization that it might interfere with determining when there was BT suppression of the test-tone response. Determining this is complicated because AN spike responses are probabilistic. For a given stimulus with a stationary set of parameters, the synchronization index produced in a histogram with an infinite number of spikes is termed the “underlying SI” (SIun) for that stimulus. However, in a real measurement there are a finite number of spikes and the resulting measured synchronization (SIm) is usually different from SIun. The fewer the spikes recorded, the greater the scatter in measured SIm’s. Thus, the degree to which a SIm shows that SIun>0.3 depends on the number of spikes in the cycle histogram. The relationship is complex. A detailed presentation of the factors involved in setting appropriate criteria is given in Nam and Guinan (2016). In addition to the SI based criterion, to achieve adequate confidence that a SIm indicates that SIun>0.3, cycle histogram data were used only when the expected error in the determination of the phase was less than a criterion value (larger expected phase errors occur when there are fewer spikes). We used a phase-error criteria of 16° or less in Nam and Guinan (2016) but here we relaxed it to 17° or less to allow an extra tail-frequency point to be used. The full rationale and detailed methods for our analysis are in Nam and Guinan (2016).
To determine that a histogram showed a significant BT-induced suppression we used the same procedure, SItarget of 0.3, and phase error <17° as for determining that a BT-alone histogram had significant synchrony. BT suppressions were only used if they were from BTs below the level at which the BT alone produced criterion synchronization and phase error. This was termed the “modified criterion” in Nam and Guinan (2016). The major phase of BT suppression was measured at the lowest BT level that produced criterion suppression.
3. Results
3.1 Example Data
Example BT-alone cycle histograms from a high-CF fiber with a tail-frequency response, and from a low-CF fiber with a side-lobe response, are shown in Figures 2A and 3A (the AN fibers in these will be called fiber 1 and fiber 2). In both cases the BT-alone level series reached a SI value of 0.3 at 100 dB SPL (Figs. 2E and 3E), but the phase-error criterion was not reached because there were too few spikes in the histograms. Responses with criterion SIs and phase errors were reached at 110 dB SPL (* in Figs. 2E and 3E). This is also the lowest level that shows a substantial increase in BT-alone firing rate (Figs. 2D, 3D). At the highest two sound levels, fiber 1 had only one excitatory phase per cycle but fiber 2 had two (Figs. 2A, 3A). Both patterns were common. In most fibers that had high-level, BT-alone responses with two peaks, one peak was narrow and the other was wide as in Fig 3A, top.
Fig. 3.
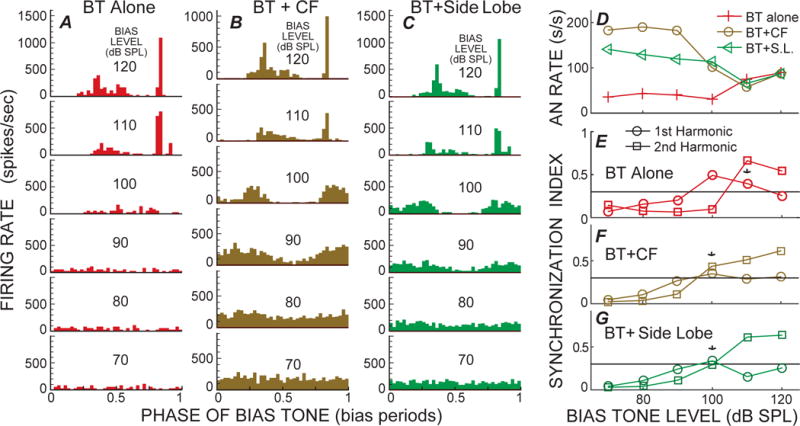
Level series of cycle histograms from 50 Hz bias tones (BTs), A: alone, B: with a low-level CF tone, and C: with a 2.35 kHz side-lobe tone, from a fiber with CF=0.79 kHz. D: Rate-level series; E–G: Synchrony index (SI) for first and second harmonics of the BT period histogram histograms from the structures labeled in each panel. * = criterion response.
Examples of BT suppression of responses to test tones at CF are shown in Figures 2B and 3B. The criterion threshold for BT-suppression was reached at 90 dB SPL for fiber 1 and at 100 dB SPL for fiber 2 (* in Figs. 2F and 3F). In both cases, modulation of the cycle histograms (with one suppression per cycle) can be qualitatively seen at 10 dB below the criterion suppression threshold (Figs 2F and 3F). At and above threshold, two suppressions per cycle can be seen, as also shown by the cycle histogram having a large second-harmonic (Figs 2F and 3F). At the highest two sound levels the BT+CF cycle histograms look like the BT-alone cycle histograms, presumably because the BT excitatory response is dominant at the highest sound levels. At these same high sound levels, the AN firing rate of the BT-alone response was the same or larger than the BT+CF response, but, in contrast, at lower sound levels the BT-alone response was less than the BT+CF response (Figs. 2D, 3D).
An example of BT-suppression of tail-frequency responses is shown in Figure 2C. The criterion threshold for suppression was reached at 90 dB SPL (Fig 2C, G), which is the same as the threshold for suppression of CF responses (Fig. 2F). One difference is that at suppression threshold, the BT+tail-frequency response had one suppression per cycle (1st greater than 2nd harmonic at 90 dB SPL in Fig. 2G) whereas the BT+CF response has two suppressions per cycle (2nd harmonic larger at 90 dB SPL in Fig. 2F). At the highest two sound levels, the BT+tail-frequency response resembles the BT alone response. This is similar to the BT+CF response, and presumably is because the excitatory response to the BT alone is dominant at the highest sound levels.
An example of BT-suppression of side-lobe-frequency responses is shown in Figure 3C. The criterion threshold for suppression was reached at 100 dB SPL (Fig 3C, G), which is the same as the threshold for suppression of CF responses (Fig 3B, F). Above threshold, the second harmonic is much larger than the first harmonic in the side-lobe-suppression cycle histogram (Fig. 3C, G). As before, at the highest two sound levels, the BT+side-lobe-frequency response resembles the BT alone response.
3.2 Suppression phases
In most cases, the BT-induced major suppression phases (MSPs) of responses to tones at tail, side-lobe and CF frequencies were similar (Fig. 4, circles, triangles and pluses). All six tail-frequency responses had MSPs similar to CF MSPs (Fig. 4A). The differences between the tail-frequency phases and the corresponding CF-suppression phases are shown in Figure 4B. Although there are not many points, they came from 4 different experiments, and they are mutually consistent. Overall, these suppression results are consistent with tail-frequency and CF tone responses both being due to the same OHC-MET-controlled active processes in OHCs.
Fig. 4.
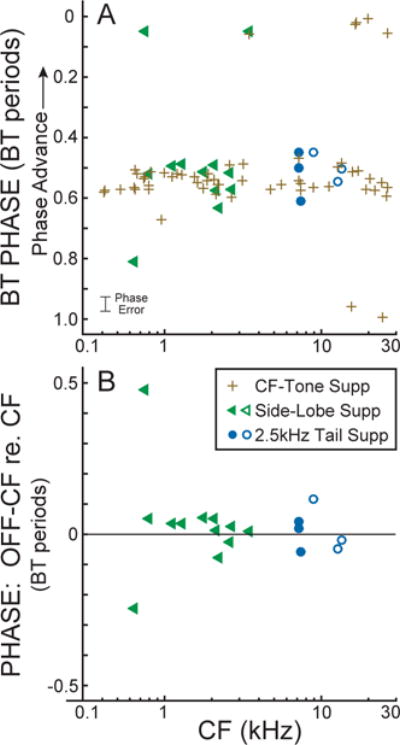
(A) BT major suppression phase at threshold suppression for CF, side-lobe and tail-frequency tones (see key) vs. fiber CF. (B) The phase difference between the off-CF-suppression and the CF-suppression vs. fiber CF. Filled symbols = BT-alone from same fiber. Open symbols = BT-alone from a fiber with a close CF.
The side-lobe and CF MSPs are shown in Figure 4A and the differences between these are shown in Figure 4B. The frequencies used for the side-lobe tones (all approximately one octave from the CF) are shown in Figure 5. Three side-lobe MSPs (triangles in Fig. 4A) were outside of the main cluster of CF MSPs but only one (CF=0.64 kHz) was inconsistent with the hypothesis. On this fiber the side-lobe MSP was 1/4 cycle later than the CF MSP (Fig. 4B); this “MSP” may have been due to contamination by BT excitation (see Nam and Guinan, 2016). The other two fibers with MSPs outside of the main CF MSP cluster had MSPs ~1/2 cycle from the main CF MSP cluster. For the fiber at CF=3.44 kHz, the CF and side-lobe MSPs were similarly displaced (i.e. the side-lobe and CF MSPs agreed – a striking agreement of the two since both are different than usual), and this-fiber’s phase difference in Figure 4B is near zero. The fiber at CF=0.75 kHz had a highly symmetric BT suppression which indicates that the no-BT operating point for this fiber was near the center of the OHC MET curve. In such cases, small differences in the operating point, or sampling noise, can determine which ½ cycle of BT phase excites at the lowest level. Overall, the results are consistent with side-lobe and CF tone responses both being due to the same OHC-MET-controlled active processes in OHCs.
Fig. 5.
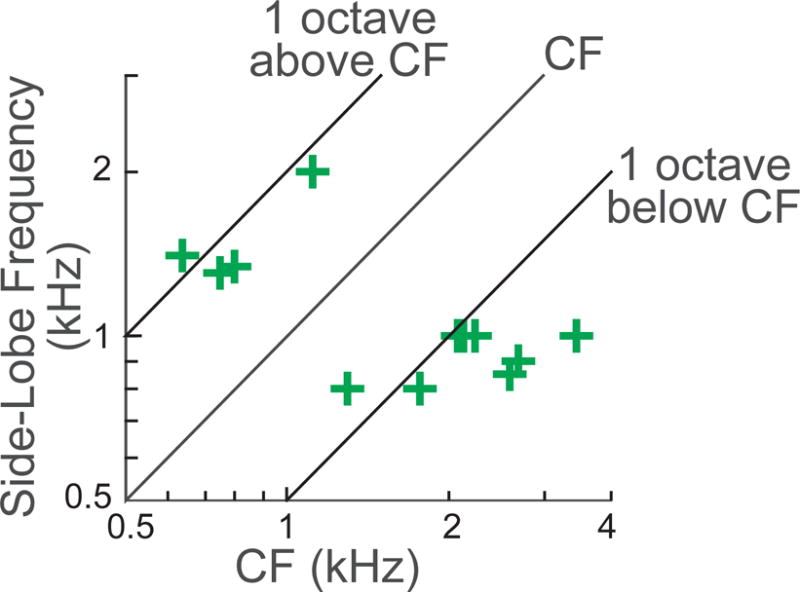
The frequencies used for the side-lobe test tone (+) vs. the CF of the fiber.
3.3 Suppression thresholds
The BT level at the threshold for criterion suppression generally increased with fiber CF for suppression of tail-frequency, side-lobe and CF tones (Fig. 6). Presumably, this is because BM stiffness increases with CF so that the BT produces less BM motion and smaller deflections of OHC stereocilia at higher CFs. Tail-frequency (circles in Fig. 6) and CF (plus signs) thresholds greatly overlapped and were not significantly different (p = 0.34, comparing the 6 tail-frequency and 8 CF suppressions in the CF range 6–15 kHz). In contrast, side-lobe suppression thresholds (triangles) were significantly higher, on average, than CF-tone suppression thresholds (pluses) (p<0.04 comparing the 12 side-lobe and 28 CF suppressions in the CF range 0.6–4 kHz). This may be due, at least in part, because the side-lobe thresholds were higher than the corresponding CF thresholds.
Fig. 6.
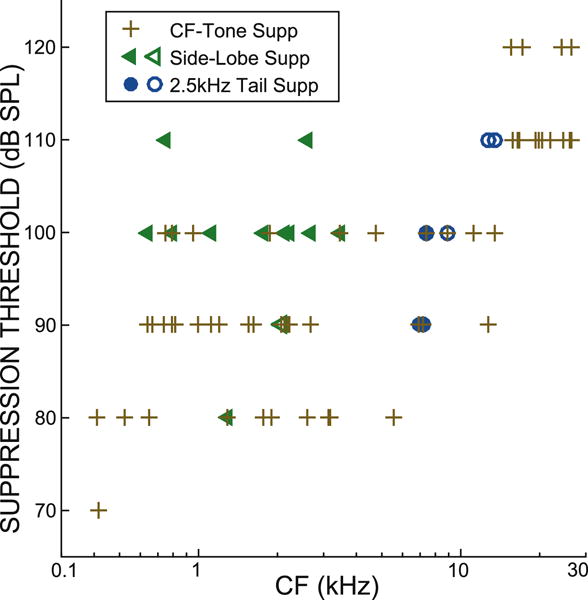
Suppression thresholds for CF, side-lobe and tail-frequency tones (see key) vs. CF. Filled symbols = BT-alone from same fiber. Open symbols = BT-alone from fiber with a close CF.
3.4 Synchronization Index Ratio
The Synchronization Index Ratio or “SIR” (the 2nd harmonic synchrony divided by the 1st harmonic synchrony) at suppression threshold provides a measure of a fiber’s no-BT OHC MET asymmetry (higher SIR = more symmetric MET function). At criterion suppression, the SIR clearly increased with CF for BT suppression of CF responses (R=0.57, p<0.001) (Fig. 7). The SIRs of tail-frequency suppressions were lower on average than the SIR of CF suppressions but the difference was not statistically significant (p = 0.09, comparing the 6 tail-frequency and 8 CF suppressions in the CF range 6–15 kHz). In contrast, the SIRs of side-lobe-frequency suppressions were significantly higher, on average, than the SIRs of CF-tone suppressions (p<0.001 comparing the 12 side-lobe and 28 CF suppressions in the CF range 0.6–4 kHz). The origin of this difference is unknown.
Fig. 7.
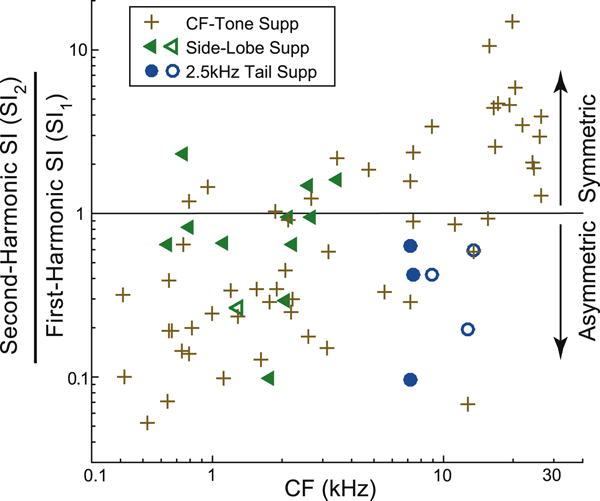
Synchronization Index Ratio for CF, side-lobe and tail-frequency tones (see key) vs. CF. Filled symbols = BT-alone from samse fiber. Open symbols = BT-alone from fiber with a close CF.
4. Discussion
Our main result is that bias tones suppress AN responses to CF, tail-frequency, and side-lobe tones with a major suppression phase that is similar for almost all AN fibers. Furthermore, these suppressions all go through the same sequence of one, then two, suppression phases as the bias-tone level is increased, which is a strong indication that current through the OHC MET channels drives these motions. Further, the suppressions cannot be accounted for by the bias tone itself modulating IHC responses. Responses to CF, tail-frequency, and side-lobe tones are also reduced by MOC stimulation (Guinan and Gifford, 1988; Stankovic and Guinan, 1999; 2000). Both sets of data are consistent with the hypothesis that these CF, tail-frequency, and side-lobe AN tone responses are enhanced by OHC somatic motility activated by deflections of OHC stereocilia.
When only the MOC inhibition data were available, a viable hypothesis to explain the inhibition was that MOC stimulation hyperpolarizes the OHCs, which causes OHC elongation, which distorts the organ of Corti (OoC) and this somehow reduces the coupling of BM motion to IHC stereocilia drive (Stankovic and Guinan, 1999). This hypothesis was generated because there is no cochlear amplification of BM motion an octave or more below CF, which fostered the (incorrect) idea that there was no enhancement of any cochlear motion an octave or more below CF. The OoC-distortion hypothesis is no longer necessary given the demonstration that RL motion more than an octave below CF is enhanced by active processes (Ren et al. 2016; Lee et al. 2016). In addition, the OoC-distortion hypothesis posits that the AN inhibition is produced by a reduction of the coupling of BM motion to IHC-stereocilia deflection which doesn’t easily fit with the finding that the tail-frequency suppressions progressed from once-a-cycle to twice-a-cycle as the BT level was raised (despite that the tail-frequency BM motion is unamplified and constant) and of similar bias-tone suppressions of CF, tail-frequency, and side-lobe responses. The BM-centric view, that BM motion leads almost directly to the drive to IHC stereocilia and the resultant AN firing, needs to be rethought.
4.1 Tail-frequency Responses
In the present study we did not attempt to determine the frequency and amplitude range over which active processes enhance tail-frequency responses, but this region was outlined in the more extensive study of Stankovic and Guinan (1999, 2000) using MOC inhibition. For cat AN fibers with CFs > 5 kHz, MOC-induced inhibition peaked at ~2.5 kHz (2–3 octaves below fiber CF) and diminished as the tone frequency decreased so that near 1 kHz, inhibition was very small (e.g. Fig. 1A). MOC inhibition also appeared to decrease as the test frequency was increased above 2.5 kHz, but the extent of MOC inhibition for tones >4 kHz is unknown because technical reasons made these frequencies difficult to test (Stankovic and Guinan, 1999). MOC inhibition was greatest for near-threshold tones (typically 65–75 dB SPL) and decreased as sound level increased so that in most cases inhibition was near zero ~20 dB above the tail threshold.
We hypothesize that the tail-frequency AN responses that are enhanced by active processes are due to the active-process-enhanced, below-CF RL motion described by Ren et al. 2016, and Lee et al. 2016. This hypothesis does not specify the mechanism by which the RL motion drives the IHC stereocilia to produce the AN response. The drive could be from transverse RL motion squeezing the RL-TM gap and producing oscillatory flow within the gap that drives IHC stereocilia, or it could be from RL-TM shear produced either directly by radial RL motion or indirectly by the RL transverse motion producing a greater overall motion of both the RL and TM resulting in greater traditional RL-TM shear. All of these processes, and/or other drive processes, could be involved (Guinan, 2012).
The influence of active processes on tail-frequency responses is consistent with the idea that OHC somatic motility acts whenever OHC stereocilia are deflected, not just near CF for cochlear amplification. Although BM responses to tones one octave or more below CF are much smaller than near CF, they are not zero and can be expected to deflect OHC stereocilia and elicit OHC somatic motility. Presumably, the motion from this OHC motility affects the RL much more than the BM because the RL is much less stiff than the BM (Mammano and Ashmore, 1993). Active-process enhancement of mechanical or neural responses at tail frequencies have now been found in mice (Ren et al., 2016; Lee et al. 2016) and cats (this paper).
All of our data are consistent with the Cai and Geisler (1996c) hypothesis that a low-frequency tone suppresses responses by transiently pushing the OHC stereocilia MET function into low-slope, saturated, edge regions. A key part of this interpretation is that OHC stereocilia are affected only by RL-TM radial shear displacements, whereas IHC stereocilia are velocity sensitive, which greatly reduces IHC excitation by the 50 Hz bias tone, so that bias-tone suppression of OHC MET transduction can be reached without significant IHC excitation. Furthermore, the fluid coupling of the IHC stereocilia allows them to be excited by RL-TM gap changes as well as RL-TM radial shear.
While we only tested suppression by 50 Hz tones, it is interesting to consider the frequency range of off-CF tones that might suppress the enhancement of tail-frequency responses. We hypothesized that tail-frequency responses are enhanced by OHC somatic motility that is driven by local (at CF) BM and RL motion, while, in contrast, current theory indicates that cochlear amplification at CF occurs by amplification of BM motion that takes place basal to the CF place and is carried to the CF place by the traveling wave (e.g. Guinan et al., 2014). With our hypothesis, responses to a tail-frequency tone would be suppressed by a second tone (above or below CF) that pushes OHC stereocilia MET functions at the CF place into saturating nonlinear slope regions (the second tone might excite AN responses so the suppression might only be seen in the motion at the first-tone’s frequency). In contrast, tones at higher-than-CF frequencies (in the upper-frequency part of the CF amplification region) that produce negligible BM motion at CF can, nonetheless, suppress BM responses to CF tones (Cooper, 1996). We would expect that such high-frequency tones that produce negligible motion at the CF place could suppress amplified responses to CF tones but would not suppress amplified responses to tail-frequency tones. In other words, BM amplification is carried by the traveling wave but RL amplification is local. This hypothesis needs to be tested.
Insights into the mechanical origin of tail-frequency responses may be obtained from group delays calculated from phase-vs.-frequency plots of AN responses. We can not compare tail-frequency group delays with delays at CF because of the lack of neural synchrony at CF in high-CF fibers and because no other suitable measurements of AN group delays at CF are available. However, AN-response group delays in the tail-frequency region that is MOC inhibited (near 2.5 kHz) are less than group delays in the lower-frequency tail region that shows little MOC inhibition (~1 kHz and below) (Guinan et al. 2005). This is in the opposite direction from the normal frequency dispersion of the traveling wave in which, at a fixed cochlear place, lower-frequency energy arrives before higher-frequency energy (Shera 2001; Ramamoorthy et al. 2010).
4.2 Side-Lobe Responses
An important feature of low-CF, AN-fiber side-lobe responses is their short group delays. AN-response phase-vs.-frequency plots, for tones swept in frequency across both tip and side-lobe regions, show slopes in the side-lobe region that are shallower than slopes in the CF region, i.e. group delays are shorter in the side-lobe region than in the CF region (Kiang, 1984; van der Heijden and Joris, 2006; Versteegh et al. 2011; also see Pfeiffer and Molnar, 1970).
An attractive candidate for a mechanical motion related to the AN side-lobe response is the apical-turn “RL” motion just above the cut-off frequency that produces a bulge in the frequency response (Recio-Spinoso and Oghalai, 2017; Dong et al. 2017). In both guinea pigs (Recio-Spinoso and Oghalai, 2017) and gerbils (Dong et al. 2017), measurements in the cochlear apex show overall low-pass-like mechanical responses, but additionally, just above the cut-off frequency, there is an upward bulge in the frequency response that corresponds approximately to a side-lobe frequency (this is clearest in the highest CF region that was tested in each study). Furthermore, in this bulge-frequency region there is more nonlinearity than in the lower frequency region, which implies it receives more amplification. The greater gain in the bulge-frequency region may correspond to the greater efferent inhibition seen in side lobes than at CF. Finally, in the guinea pig data, the slope of the phase-vs.-frequency response in the bulge region, is less than the slopes at the presumed CF, i.e. there is a shorter group delay in the bulge region than at CF. Based on these similarities, we hypothesize that a mechanical correlate of cat AN side-lobe-region responses is shown by the mechanical responses in the guinea-pig and gerbil bulge regions (Recio-Spinoso and Oghalai, 2017; Dong et al. 2017). Note that in these mechanical measurements, the voxel size was large and included more than just the RL.
4.3 Comparison of Tail-frequency and Side-lobe responses
The tail and side-lobe responses have many similar characteristics, for example: They are suppressed by bias tones in similar ways (Figs. 2–4); they are MOC inhibited near their response thresholds (Guinan and Gifford, 1988; Stankovic and Guinan, 1999; Guinan, 2011), and they have shorter group delays than responses at nearby frequencies. However, there are also differences: First, side-lobe responses can show much more MOC inhibition than tail-frequency responses. Second, at tail-frequencies, MOC inhibition is present only near threshold and ~20 dB or more above threshold the response appears to be passive (Stankovic and Guinan, 1999). In contrast, at some side-lobe frequencies, inhibition extended upward to as high a sound level as tested without any sign of a high-level passive response (showing level-shifts of 40 dB or more – where the level shift is the amount the sound level needs to be increased when there is MOC inhibition to equal the response without MOC inhibition; Guinan and Gifford 1988; Guinan 2011). Third, at suppression threshold, synchronization index ratios were similar for tail and CF responses but were significantly higher in side lobes than at the corresponding CF. Considering the above similarities and differences, it does not seem likely that the active-process enhancement in TC side lobes and TC tails are due to exactly the same mechanisms, although aspects of their underlying mechanisms may be similar (e.g. they may share the same force generation mechanism but have different transmission pathways to the inner-hair-cell stereocilia).
4.4 Implications for understanding how the cochlea works
Is there a role of stereocilia motility in the phenomena reported here? We have argued that motion amplification by stereocilia motility has no role at high frequencies because it requires cycle-by-cycle binding and unbinding of Ca2+ on some site near the OHC MET channel, and that this cannot be accomplished fast enough (Guinan, 2014). However, the side-lobe and tail frequencies considered here are a few kHz and below, so the unbinding-speed limitation is less important and stereocilia motility might play a role. Nonetheless, the progression of BT effects from one-per-cycle to two-per-cycle suppressions is difficult to reconcile with the observed amplification coming from OHC stereocilia motility. There are no data that support a role for IHC stereocilia motility but the data do not rule out that IHC stereocilia motility might have some effect on IHC responses.
Neural responses that do not have the same frequency characteristics as the BM response at the same cochlear location have sometimes been said to have gone through a “second filter” after the first filter of BM response (Evans and Wilson, 1975; Ramamoorthy et al. 2014). For the AN tail-frequency response that is enhanced by active processes, there is no corresponding tail-frequency, active-process-enhanced BM motion (at least not one that is readily distinguished from the tail-frequency passive BM response). Instead of a “second filter,” it seems more useful to think of the OoC vibration pattern as a superposition of vibrational modes that are excited by the traveling wave and that BM motion may show the motion of some modes but not others. With this complex-vibrational-structure formulation, the IHC drive is different from BM motion not because there is a “second filter” but because it gets a different mix of the vibrational modes.
5. Conclusions
Low-frequency bias tones produce similar patterns of suppression on AN responses to tail-frequency, side-lobe and CF tones. These results are consistent with the enhancements of all of these responses being due to OHC-stereocilia-deflection-controlled OHC somatic motility that enhances RL motion. The results indicate BM motion and IHC stereocilia deflection are affected by different mixes of OoC vibrational modes, some passive and some that receive active enhancement.
Highlights.
Tail-frequency and TC-side-lobe AN responses that are efferent inhibited are tested
Low-frequency “bias” tones suppress CF and these non-tip responses in the same way
Conclude OHC stereocilia-controlled somatic motility enhances these responses
Reticular lamina motion, not basilar-membrane motion, drives these responses
Acknowledgments
We thank Dr. M.C. Brown, Dr. D.C. Mountain and Dr. C.A. Shera for comments on early versions of this work, as well as Dr. K.D. Karavitaki and Dr. Sunil Puria for comments on recent versions. This work was supported by NIH NIDCD grants: RO1 DC000235, T32 DC00038 and P30 DC005209 and was part H.N’s Ph.D and MS theses.
Footnotes
Publisher's Disclaimer: This is a PDF file of an unedited manuscript that has been accepted for publication. As a service to our customers we are providing this early version of the manuscript. The manuscript will undergo copyediting, typesetting, and review of the resulting proof before it is published in its final citable form. Please note that during the production process errors may be discovered which could affect the content, and all legal disclaimers that apply to the journal pertain.
Conflict of Interest Statement
The authors declare that they have no conflict of interest.
References
- Ashmore J, Avan P, Brownell WE, Dallos P, Dierkes K, Fettiplace R, Grosh K, Hackney CM, Hudspeth AJ, Julicher F, Lindner B, Martin P, Meaud J, Petit C, Sacchi JR, Canlon B. The remarkable cochlear amplifier. Hear Res. 2010;266:1–17. doi: 10.1016/j.heares.2010.05.001. [DOI] [PMC free article] [PubMed] [Google Scholar]
- Cai Y, Geisler CD. Temporal patterns of the responses of auditory-nerve fibers to low-frequency tones. Hear Res. 1996a;96:83–93. doi: 10.1016/0378-5955(96)00033-0. [DOI] [PubMed] [Google Scholar]
- Cai Y, Geisler CD. Suppression in auditory-nerve fibers of cats using low-side suppressors. I. Temporal aspects. Hear Res. 1996b;96:94–112. doi: 10.1016/0378-5955(96)00034-2. [DOI] [PubMed] [Google Scholar]
- Cai Y, Geisler CD. Suppression in auditory-nerve fibers of cats using low-side suppressors. III. Model results. Hear Res. 1996c;96:126–140. doi: 10.1016/0378-5955(96)00036-6. [DOI] [PubMed] [Google Scholar]
- Cooper NP. Two-tone suppression in cochlear mechanics. J Acoust Soc Am. 1996;99:3087–3098. doi: 10.1121/1.414795. [DOI] [PubMed] [Google Scholar]
- Cooper NP, Guinan JJ., Jr Efferent-Mediated Control of Basilar Membrane Motion. J Physiol. 2006;576:49–54. doi: 10.1113/jphysiol.2006.114991. [DOI] [PMC free article] [PubMed] [Google Scholar]
- Dallos PJ, Popper AN, Fay RR. The Cochlea. Vol. 8. Springer-Verlag; New York: 1996. [Google Scholar]
- Dong W, Xia A, Puria S, Applegate BE, Oghalai JS. Signal processing within apical turn of the intact gerbil cochlea measured by Volumetric Optical Coherence Tomography and Vibrometry (VOCTV) In: Bergevin C, Puria S, editors. Mechanics of Hearing Workshop Proceedings. American Institute of Physics; Melville, New York, USA: 2017. 2017. [Google Scholar]
- Evans EF, Wilson JP. Cochlear tuning properties: concurrent basilar membrane and single nerve fiber measurements. Science. 1975;190:1218–21. doi: 10.1126/science.1198110. [DOI] [PubMed] [Google Scholar]
- Freeman DM, Weiss TF. Hydrodynamic forces on hair bundles at low frequencies. Hear Res. 1990a;48:17–30. doi: 10.1016/0378-5955(90)90196-v. [DOI] [PubMed] [Google Scholar]
- Freeman DM, Weiss TF. Hydrodynamic forces on hair bundles at high frequencies. Hear Res. 1990b;48:31–36. doi: 10.1016/0378-5955(90)90197-w. [DOI] [PubMed] [Google Scholar]
- Guinan JJ., Jr . Physiology of the Medial and Lateral Olivocochlear Systems. In: Ryugo DK, Fay RR, Popper AN, editors. Auditory and Vestibular Efferents Springer Handbook of Auditory Research. Springer Science+Business Media; LLC, New York: 2011. pp. 39–81. Vol. [Google Scholar]
- Guinan JJ., Jr How are inner hair cells stimulated? Evidence for multiple mechanical drives. Hear Res. 2012;292:35–50. doi: 10.1016/j.heares.2012.08.005. [DOI] [PMC free article] [PubMed] [Google Scholar]
- Guinan JJ., Jr . Cochlear Mechanics, Otoacoustic Emissions, and Medial Olivocochlear Efferents: Twenty Years of Advances and Controversies Along with Areas Ripe for New Work. In: Popper AN, Fay RR, editors. Perspectives on Auditory Research. Springer Science+Business Media; LLC, New York: 2014. pp. 229–246. (Springer Handbook of Auditory Research). Vol. [Google Scholar]
- Guinan JJ, Jr, Cooper NP. Medial olivocochlear efferent inhibition of basilar-membrane responses to clicks: evidence for two modes of cochlear mechanical excitation. J Acoust Soc Am. 2008;124:1080–92. doi: 10.1121/1.2949435. [DOI] [PMC free article] [PubMed] [Google Scholar]
- Guinan JJ, Jr, Gifford ML. Effects of electrical stimulation of efferent olivocochlear neurons on cat auditory-nerve fibers. III. Tuning curves and thresholds at CF. Hear Res. 1988;37:29–46. doi: 10.1016/0378-5955(88)90075-5. [DOI] [PubMed] [Google Scholar]
- Guinan JJ, Jr, Lin T, Cheng H. Medial-olivocochlear-efferent inhibition of the first peak of auditory-nerve responses: Evidence for a new motion within the cochlea. J Acoust Soc Am. 2005;118:2421–33. doi: 10.1121/1.2017899. [DOI] [PMC free article] [PubMed] [Google Scholar]
- Guinan JJ, Jr, Salt A, Cheatham MA. Progress in cochlear physiology after Bekesy. Hear Res. 2012;293:12–20. doi: 10.1016/j.heares.2012.05.005. [DOI] [PMC free article] [PubMed] [Google Scholar]
- Javel E. Shapes of cat auditory nerve fiber tuning curves. Hear Res. 1994;81:167–88. doi: 10.1016/0378-5955(94)90163-5. [DOI] [PubMed] [Google Scholar]
- Javel E, McGee JA, Walsh EJ, Farley GR, Gorga MP. Suppression of auditory nerve responses. II. Suppression threshold and growth, iso-suppression contours. J Acoust Soc Am. 1983;74:801–813. doi: 10.1121/1.389867. [DOI] [PubMed] [Google Scholar]
- Kiang NYS. Am Physiological Soc. Bethesda, MD: 1984. Peripheral neural processing of auditory information, Handbook of Physiology, Section 1: The Nervous System, Vol. 3 (Sensory Processes) pp. 639–674. [Google Scholar]
- Lee HY, Raphael PD, Xia A, Kim J, Grillet N, Applegate BE, Ellerbee Bowden AK, Oghalai JS. Two-Dimensional Cochlear Micromechanics Measured In Vivo Demonstrate Radial Tuning within the Mouse Organ of Corti. J Neurosci. 2016;36:8160–73. doi: 10.1523/JNEUROSCI.1157-16.2016. [DOI] [PMC free article] [PubMed] [Google Scholar]
- Liberman MC, Kiang NYS. Acoustic trauma in cats. Cochlear pathology and auditory-nerve activity. Acta Otolaryngologica Supplement. 1978;358:1–63. [PubMed] [Google Scholar]
- Mammano F, Ashmore JF. Reverse transduction measured in the isolated cochlea by laser Michelson interferometry. Nature. 1993;365:838–841. doi: 10.1038/365838a0. [DOI] [PubMed] [Google Scholar]
- Nam H, Guinan JJ., Jr Low-frequency bias tone suppression of auditory-nerve responses to low-level clicks and tones. Hear Res. 2016;341:66–78. doi: 10.1016/j.heares.2016.08.007. [DOI] [PMC free article] [PubMed] [Google Scholar]
- Narayan SS, Temchin AN, Recio A, Ruggero MA. Frequency tuning of basilar membrane and auditory nerve fibers in the same cochleae. Science. 1998;282:1882–84. doi: 10.1126/science.282.5395.1882. [DOI] [PMC free article] [PubMed] [Google Scholar]
- Nowotny M, Gummer AW. Nanomechanics of the subtectorial space caused by electromechanics of cochlear outer hair cells. Proc Natl Acad Sci U S A. 2006;103:2120–5. doi: 10.1073/pnas.0511125103. [DOI] [PMC free article] [PubMed] [Google Scholar]
- Nowotny M, Gummer AW. Vibration responses of the organ of Corti and the tectorial membrane to electrical stimulation. J Acoust Soc Am. 2011;130:3852–72. doi: 10.1121/1.3651822. [DOI] [PubMed] [Google Scholar]
- Patuzzi R, Sellick PM, Johnstone BM. The modulation of the sensitivity of the mammalian cochlea by low frequency tones. I. Primary afferent activity. Hear Res. 1984a;13:1–8. doi: 10.1016/0378-5955(84)90089-3. [DOI] [PubMed] [Google Scholar]
- Patuzzi R, Sellick PM, Johnstone BM. The modulation of the sensitivity of the mammalian cochlea by low frequency tones. III. Basilar membrane motion. Hear Res. 1984b;13:19–27. doi: 10.1016/0378-5955(84)90091-1. [DOI] [PubMed] [Google Scholar]
- Pfeiffer RR, Molnar CE. Cochlear nerve fiber discharge patterns: Relationship to the cochlear microphonic. Science. 1970;167:1614–16. doi: 10.1126/science.167.3925.1614. [DOI] [PubMed] [Google Scholar]
- Ramamoorthy S, Zha DJ, Nuttall AL. The biophysical origin of traveling-wave dispersion in the cochlea. Biophys J. 2010;99:1687–95. doi: 10.1016/j.bpj.2010.07.004. [DOI] [PMC free article] [PubMed] [Google Scholar]
- Ramamoorthy S, Zha D, Chen F, Jacques SL, Wang R, Choudhury N, Nuttall AL, Fridberger A. Filtering of Acoustic Signals within the Hearing Organ. J Neurosci. 2014;34:9051–8. doi: 10.1523/JNEUROSCI.0722-14.2014. [DOI] [PMC free article] [PubMed] [Google Scholar]
- Recio-Spinoso A, Oghalai JS. Mechanical tuning and amplification within the apex of the guinea pig cochlea. J Physiol. 2017;595:4549–4561. doi: 10.1113/JP273881. [DOI] [PMC free article] [PubMed] [Google Scholar]
- Ren T, He W, Kemp D. Reticular lamina and basilar membrane vibrations in living mouse cochleae. Proc Natl Acad Sci U S A. 2016;113:9910–15. doi: 10.1073/pnas.1607428113. [DOI] [PMC free article] [PubMed] [Google Scholar]
- Rhode WS. Mutual suppression in the 6 kHz region of sensitive chinchilla cochleae. J Acoust Soc Am. 2007;121:2805–18. doi: 10.1121/1.2718398. [DOI] [PubMed] [Google Scholar]
- Rhode WS, Cooper NP. Two-tone suppression and distortion production on the basilar membrane in the hook region of cat and guinea pig cochlea. Hear Res. 1993;66:31–45. doi: 10.1016/0378-5955(93)90257-2. [DOI] [PubMed] [Google Scholar]
- Robles L, Ruggero MA. Mechanics of the mammalian cochlea. Physiological Reviews. 2001;81:1305–1352. doi: 10.1152/physrev.2001.81.3.1305. [DOI] [PMC free article] [PubMed] [Google Scholar]
- Sachs MB, Hubbard AE. Responses of auditory-nerve fibers to characteristic-frequency tones and low-frequency suppressors. Hear Res. 1981;4:309–24. doi: 10.1016/0378-5955(81)90015-0. [DOI] [PubMed] [Google Scholar]
- Sellick PM, Russell IJ. The responses of inner hair cells to basilar membrane velocity during low frequency auditory stimulation in the guinea pig cochlea. Hear Res. 1980;2:439–445. doi: 10.1016/0378-5955(80)90080-5. [DOI] [PubMed] [Google Scholar]
- Sellick PM, Patuzzi R, Johnstone BM. Modulation of responses of spiral ganglion cells in guinea pig cochlea by low frequency sound. Hear Res. 1982;7:199–221. doi: 10.1016/0378-5955(82)90014-4. [DOI] [PubMed] [Google Scholar]
- Shera CA. Frequency Glides in Click Responses of the Basilar Membrane and Auditory Nerve: Their scaling behavior and origin in traveling-wave dispersion. J Acoust Soc Am. 2001;109:2023–2034. doi: 10.1121/1.1366372. [DOI] [PubMed] [Google Scholar]
- Stankovic KM, Guinan JJ., Jr Medial efferent effects on auditory-nerve responses to tail-frequency tones I: Rate reduction. J Acoust Soc Am. 1999;106:857–869. doi: 10.1121/1.427102. [DOI] [PubMed] [Google Scholar]
- Stankovic KM, Guinan JJ., Jr Medial efferent effects on auditory-nerve responses to tail-frequency tones II: Alteration of Phase. J Acoust Soc Am. 2000;108:664–678. doi: 10.1121/1.429599. [DOI] [PubMed] [Google Scholar]
- Steele CR, Puria S. Force on inner hair cell cilia. Int J Sol Struct. 2005;42:5887–5904. [Google Scholar]
- ter Kuile E. Die Ubertragung der Energie von der Grundmembran auf die Haarzellen. Pflug Arch Ges Physiol. 1900;79:146–157. [Google Scholar]
- van der Heijden M, Joris PX. Panoramic measurements of the apex of the cochlea. J Neurosci. 2006;26:11462–73. doi: 10.1523/JNEUROSCI.1882-06.2006. [DOI] [PMC free article] [PubMed] [Google Scholar]
- Versteegh CP, Meenderink SW, van der Heijden M. Response Characteristics in the Apex of the Gerbil Cochlea Studied Through Auditory Nerve Recordings. J Assoc Res Otolaryngol. 2011;12:301–16. doi: 10.1007/s10162-010-0255-y. [DOI] [PMC free article] [PubMed] [Google Scholar]