

Abstract
With the introduction of the large number of fitness devices on the market, there are numerous possibilities for their use in managing chronic diseases in older adults. For example, monitoring people with dementia using commercially available devices that measure heart rate, breathing rate, lung volume, step count, and activity level could be used to predict episodic behavioral and psychological symptoms before they become distressing or disruptive. However, since these devices are designed primarily for fitness assessment, validation of the sensors in a controlled environment with the target cohort population is needed. In this study, we present validation results using a commercial fitness tracker, the Hexoskin sensor vest, with thirty-one participants aged 65 and older. Estimated physiological measures investigated in this study are heart rate, breathing rate, lung volume, step count, and activity level of the participants. Findings indicate that while the processed step count, heart rate, and breathing rate show strong correlations to the clinically accepted gold standard values, lung volume and activity level do not. This indicates the need to proceed cautiously when making clinical decisions using such sensors, and suggests that users should focus on the three strongly correlated parameters for further analysis, at least in the older population. The use of physiological measurement devices such as the Hexoskin may eventually become a non-intrusive way to continuously assess physiological measures in older adults with dementia who are at risk for distressing behavioral and psychological symptoms.
Keywords: activity analysis, wearable health, physiological measurement, sensor validation, Bayesian analysis
1. INTRODUCTION
The number of devices that have been connected via the Internet, increased from around 200 million in 2000 to approximately 10 billion today, moving us from the age of the Internet of Things (IoT) towards the confluence of people, process, data, and things — the Internet of Everything (IoE) [1]. More emphasis is being placed on pushing the field forward from data towards knowledge by extracting meaning from data that assists in actionable information. Advancements in mobile health technologies [15] adds the IoE dimension to healthcare innovations bringing to attention the numerous commercial devices available in the market. Devices created by manufacturers including Fitbit, Jawbone, Garmin, Apple, and others have made physiological and activity information readily available to the public, as well as opened up a new world for continuous activity monitoring to manage chronic healthcare conditions. However, this also brings the challenges of ensuring that the sensor readings are accurate and sensitive enough for chronic disease management. This is crucial not only for ensuring the generalizability of a sensor within a target population, but also its capability to measure the day-to-day variability in measurement that can be corroborated with the symptoms pertaining to the chronic health condition. The aim of this study is to validate the parameters measured by the Hexoskin vest sensor against clinically established gold standard measures (clinically established ground truth measures [31]) with 31 older adults in order to check the feasibility of using the vest with the older adult population.
2. BACKGROUND
Studies described in [2] and [3] indicate the importance of longitudinal analysis of the daily routine of older adults to detect anomalies or deviations in their usual patterns using automated, non-intrusive methods. Moreover, analyzing physiological measures such as heart rate and breathing rate can also provide critical insights to the person’s stress levels and physical activity [6]. In order to detect these deviations, the instruments or the sensors must be validated prior to use in healthcare settings.
In [13], Schwartz et al. attempted to extract the energy expenditure from physical activity measured using motion sensor devices (Omron pedometer (OM), Sportbrain pedometer (SB), and Kenz Life-Corder (LC) accelerometer). One interesting observation from the study was that the motion sensors performed accurately at higher speeds, with lower accuracies at lower speeds. This was not surprising given their primary uses as fitness devices. What was surprising in this study was that energy expenditure was not measured well in either the normal body mass index (BMI < 25.0 kg·m−2) or obese participants (BMI ≥ 30.0 kg·m−2), but performed well in overweight participants (BMI between 25.0 and 30.0 kg·m−2), particularly the SB sensor, which had the highest performance. The LC sensor performed poorly across all participants, with the OM having a better performance than LC, but poorer than SB. The results highlighted performance differences across the different sensors in measurement of energy expenditure. In [14], Diaz et al. validated the use of Fitbit One to measure step count and energy expenditure in female adults. Here, different gait speeds were tested with 13 participants, and across Fitbit devices placed on the torso, hip, as well as wrist. While the step counts were strongly correlated across the devices, the error in energy estimate varied from 9–19% for the device placed on the torso, with lower performance for the other locations.
In [4], the authors compared the performance of three Fitbit One devices against one another to measure the inter-reliability of the devices in 30 healthy adults. The trackers were placed on both of the hips, and one in the shirt pocket. Using the step count metric, no significant difference was found across the three devices, with high inter-device reliability. In another study in [9], three different devices, Fitbit One, Jawbone Up, and Garmin Vivofit were used to measure two different activities running and walking for 14 adults. Energy expenditure was compared across the trackers and was validated against indirect calorimetry values for the participants. Their study showed less promising results, as the devices were found to be unsuitable as research measurement tools for recording precise and accurate energy expenditure estimates. However, the authors discussed the potential of using these devices in interventions of behavior change as they can provide estimates of relative changes in energy expenditure that allow users to understand activity patterns on an ongoing basis.
In our earlier study, we investigated the use of a fitness vest, the Hexoskin sensor as a tool for use in dementia care and management [5]. Specifically, we used a smaller group of adults where 4 participants were of ages 30–35 years, and 3 healthy older adults of age ~60 years as the preliminary study cohort. In the Hexoskin sensor, five parameters are measured: cadence (in steps per minute), activity level (net acceleration in units of g), heart rate and breathing rate (in beats per minute), and minute ventilation (in mL per minute). Gait-related activities were validated for the cadence measure, and the remaining parameters were compared with the cadence using multivariate analysis. This initial study indicated that for the diverse population across different activities, the cadence, activity level, breathing rate and minute ventilation were strongly correlated with one another.
In all the studies described above, the devices were analyzed specifically to understand their potential for use with the healthy population. However, in chronic disease management applications, specific target groups need to be investigated as discussed in the review paper by Remoortel et al. [10], which reviewed the use of activity monitors across different studies. The authors found that most of the studies conducted included only healthy cohorts (118 out of 134). They further cautioned against the use of activity monitors in chronic healthcare settings without a proper validation study, since activity monitors are less accurate at slow walking speeds, and need further examination prior to use in clinical trials.
In this study, we expand the scope of our previous analysis [5] to the older adult population of age 65 years and older with mobility impairment, cognitive impairment, neither, or both, using participants from the Fels Longitudinal Study (study population described in detail in Section 3 of this manuscript).
Specifically, we ask the following research questions:
What are the relationships between the different phenotype measures (such as demographic information on age, gender, ethnicity, cognitive status) in our study cohort? What are their similarities and differences?
How do the Hexoskin sensor readings compare to gold standard measures in terms of accuracy, precision, and bias?
3. STUDY COHORT ANALYSIS
Study visits from thirty-nine participants of the Fels Longitudinal Study were used for the validation study described in this manuscript. Information regarding the Fels Longitudinal Study has been previously published in detail [23]. Briefly, the study began in 1929 for the purpose of examining growth, maturation, and body composition of individuals residing in and around the Dayton/Yellow Springs, Ohio area. In many cases, participants were enrolled as infants or small children, and then followed throughout their lifespans. Others were added during adolescence or adulthood. Although the study is closed to additional recruitment, data collection in a substantial portion of participants is ongoing. Participants follow specific visit schedules depending on age and sex; for participants ⩾18 years of age, visits occur every 2–5 years. Fels participants are overwhelmingly of European descent and typically live in southwest Ohio, roughly mirroring that region’s distribution of socioeconomic status. Participants are not targeted for study enrollment because of any particular health conditions, diseases or body composition, and as such, the study can be considered to approximate normal population variation within the represented demographic. For this study, participants were prioritized for a study visit if they were over age 65 years (the same criterion as Medicare eligibility, hence we chose this age range) and on their previous study visit had, 1) mobility impairment as measured by usual gait speed <1.0 meters/sec [24], 2) mild/moderate cognitive impairment as measured by a Montreal Cognitive Assessment score <26 [25], 3) both, or 4) neither. The recruitment goal was to complete data collection to have N=10 in each of the four categories. Due to technical issues, Hexoskin data were not viable for N=9 participants, leaving N=31 (12 male, and 19 female participants) for final analyses. All study procedures were approved by the Institutional Review Board at Wright State University and all participants provided informed consent prior to participation.
3.1 Relationships between the Phenotype Variables
Graphical models are a marriage between graph theory and probability theory [20]. Specifically, Bayesian networks are graphical models that allow us to represent the probabilistic relationships between different variables, as well as understand the structure of the relationship between the different variables in a given dataset. Using probability theory, the relationships between different data variables can be computed. Among their many advantages, BNs allow a way to handle missing or noisy data, can utilize mechanisms to avoid overfitting the data (in our study, we used the BIC for structure learning as a means to retain a parsimonious model), and can be used for data modeling for smaller sample sizes [30]. In related activity modeling work using sensor information and probabilistic approaches, previous researchers [24], [25] utilized motion sensor data to learn context-aware rules using a BN. In our study, we generated a BN for all the phenotype information (including physiological and demographic) collected in the Fels study, describing the similarities and dissimilarities in the study cohort. Specifically, 1073 variables were investigated in this study and described in this section to provide context to the validity evidence described in the latter section of the manuscript. This included information regarding the age, gender, prior injuries, presence of comorbidities such as arthritis, width of girth, scores from the cognitive scale testing parameters such as performance in the subtraction testing, memory test [21], performance in the physical balance testing such as the number of sit-to-stands, balance score, etc [17] were computed. We discarded variables that were too sparse i.e. present in less than five participants, and discarded date information, leaving 98 variables. Then we created a BN using these parameters for structure learning to analyze the relationship between these components. We computed a BN for structure learning i.e. without any apriori structure using a score-based approach [22]. In this method, for each pair of parameters we compute the score of structure G, given the data D and using Bayes Rule, we get:
As an example, for two variables we use the following three paths, add a directional path, delete the directional path, and reverse the directional path [28]. This means the three possible relationships between the variables CLOCK_NUM and ABSTRACT2 are:
CLOCK_NUM -> ABSTRACT2 (CLOCK_NUM causes ABSTRACT2)
CLOCK_NUM ⊥ ABSTRACT2 (no connection, mutually independent)
CLOCK_NUM <- ABSTRACT2 (CLOCK_NUM is caused by ABSTRACT2)
The idea here is to compute the likelihood of the graph structure G using the data D for each of these possible paths to find the causal relationship that best fits the data. To get to a higher granular level across all the variables or parameters used in the model, for every variable p, we then compute the likelihood using:
Finally, to compare between the different permutations and combinations of the variables, we use the BIC score approximation [11] which has the added advantage of penalizing for complicated structures, preventing overfitting. In this example, if the model comprising case 1 i.e. CLOCK_NUM -> ABSTRACT2 yields the lowest BIC score, then that relationship is retained. This process is repeated for every pair of variables to obtain the optimal structure.
Using the structure learning technique described above, we generated a BN that excluded variables with no relations between them, and preserved the variables which either affected another variable, or were affected by another variable. The BN structure with the lowest BIC score is shown in Figure 2. We observed that the strongest relationships between the variables only occur for the physical and cognitive testing variables. The physical testing variables are the ones beginning with the letters PB. The measures are described in more detail in the SPPB test description [17]. These include:
PBSCHST (chair stand safe to stand (0-No, 1-Yes))
PBSCHST_R (chair stand results (0-Not completed, 1-Without arms, 2-With arms))
PBRCHST_TIME_DIS (chair stand time displayed (in seconds))
PBTSTAND (balance test tandem stand (0-Not attempted or less than 3 seconds, 01-Held for 3+ seconds and less than 10 seconds, 02-Held for more than 10 seconds))
PBTBSCORE (Balance score)
PBCSSCORE (Repeated chair stand score)
PBTOTALSCORE (total physical balance test score)
Fig. 2.
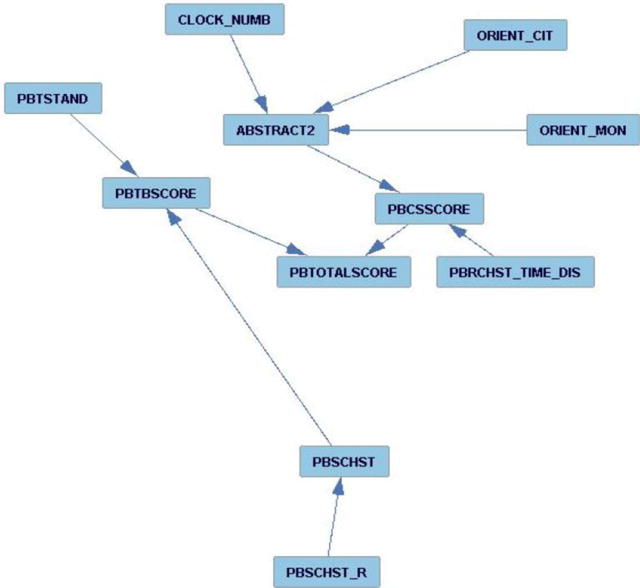
Bayesian Network obtained through structure learning to understand the relationship between different variables measured in the Fels study cohort.
The remaining measures are cognitive testing variables such as CLOCK_NUM or ABSTRACT2. These are part of the MOCA testing parameters and include:
CLOCK_NUM (identifying the time (0-No, 1-Yes))
ABSTRACT2 (Similarity between two entities such as banana – orange = fruit (0-No, 1-Yes))
ORIENT_CIT (Orientation, identification of current city (0-No, 1-Yes))
ORIENT_MON (Orientation, identification of current month (0-No, 1-Yes))
This implied that there is no significant relation between the demographic parameters, or the co-morbidities, or medications, and the performance in the physical (SPPB [17]) and cognitive (MOCA) tests [21] within the Fels cohort. This is surprising as there are indications that demographic information does play a role in cognitive and physical performance in older adults; however, within our Fels cohort, the differences are too small to generate any significant relationships with the other phenotype measures.
For our 31-participant cohort, we do see a relation between performance in the SPPB [17] and MOCA [21]. In particular, within the MOCA, we see that the participants’ performance in the abstraction i.e. semantic similarity between objects (ABSTRACT2) relies on their performance in other cognitive measures such as identifying the time (CLOCK_NUM), and identifying the current month (ORIENT_MON) as well as current city (ORIENT_CIT). Similarly, in the SPPB, we see that the chair stand (PBSCHST) plays a significant role in the participants’ performance in the overall balance score (PBTBSCORE). However, the most interesting observation here was the dependency between the MOCA and SPPB. The participants’ performance in the abstraction task affected their performance in the chair sit-to-stands. It is not surprising that there is a relation between physical and cognitive performance in older adults; in [26], Won et al. found that a decline in cognitive performance corroborated with a poor physical performance measure. However, this analysis points to the causal relationship between the cognitive measurements of the older adults with their physical performance. The main point that this feature analysis highlights is that based on our study, the demographic features do not have a strong relationship with the cognitive or the physical performance measures. This may suggest that the current validation study using the wearables could generalize across older adults of both genders, ages 65 and above, as well as different physical characteristics such as width of girth, height, body weight, etc. In the next section, we describe the validation of the physiological measurements collected using a promising new commercial wearable sensor, the Hexoskin vest.
4. SENSOR DATA ANALYSIS (COMPARISON AGAINST THE GOLD STANDARD MEASURES)
In this section, we validate the Hexoskin vest using our 31 participants of age 65 and above. Specifically, we describe our preliminary work in validating the parameters extracted from one of the most popular wearable sensors, Hexoskin [7]. We originally chose N=40 participants as a recruitment goal based on pilot funding constraints and feasibility of completing data collection in in a timely manner with available resources. Power calculations indicate that with N=40 we would have power to detect a significant correlation of 0.31. With N=31 participants, we were powered to detect a significant correlation of 0.36. Based on these values, our current sample size is more than sufficient to detect relatively weak agreements (and strong agreements) between the sensor and gold standard measures.
Five parameters were measured: heart rate (HR) in beats per minute (BPM), respiration rate (RR) in BPM, minute ventilation or exhaled volume (VE) to detect the volume of gas inhaled or exhaled by the lungs in lungs per minute (LPM), cadence in number of steps per minute (Cadence), as well as the activity level (A) on a scale of 0 to 1 using accelerometers in the X, Y, and Z directions (resolution of 0.004g) [7]. As compared to other commercially available sensors, the Hexoskin has the added benefit of being worn as an under-shirt by the person with dementia, instead of wearable bracelets like the Fitbit that patients may find confusing, and can easily discard. Moreover, the Hexoskin vest is Bluetooth enabled with over 14 hours of battery life and can locally store more than 150 hours of recording [7]. Each of these measures is compared against the gold standard metric corresponding to that measure. Each of these metrics are described in the corresponding physiological sensor section below. Cadence is discussed in Section 4.1, breathing rate and minute volume in Section 4.2, heart rate in Section 4.3 and Activity in Section 4.4.
4.1 Cadence
We assess the accuracy of the number of steps per minute (Cadence). The gold standard metric is our gait laboratory’s motion capture system, consisting of 6 Osprey cameras from the Motion Analysis Corp., with retroreflective markers placed according to the Helen Hayes marker system, and Cortex software used for spatiotemporal data collection and processing [16]. Participants performed the Short Physical Performance Battery (SPPB) [17] test for gait performance; in this section, the gait component of the SPPB was utilized for Cadence validation.
4.1.1 Initial Results (Without Signal Processing)
From our preliminary comparison of Cadence with the motion capture system data, we found that Cadence from the vest was consistently lower than Cortex values. Furthermore, we computed the correlation between the two measures. Correlation is a statistical measure of the linear relation between the two variables. The magnitude of the correlation coefficient indicates the strength of the linear relationship between the two variables. However, a high correlation between two variables does not necessarily imply that the two methods have strong agreement [18]. This is particularly true if the variables share a non-linear relationship. Similarly, the coefficient of determination measures the magnitude of variance shared by the two variables and measures the precision of the measurement between the two quantities of comparison. Initially, using the proprietary Hexoskin software, we found that the Pearson’s correlation (r) was equal to 0.42 between the two measures Cadence (vest) and the Cortex. Since this was a moderate correlation which we believed to be affected in part by the manner in which the vest’s software converted signal to final output numbers. Therefore, we re-analyzed the agreement between the Hexoskin and the motion capture system’s Cadence data by using the raw accelerometer data from the vest and extracting signal processing features to compute our own Cadence metric for comparison with the gold standard system.
4.1.2 Cadence Extraction (With Signal Processing)
We computed the magnitude of the acceleration of the x, y, and z measures, and then subtracted the mean from the signal. We extracted the peaks or local maxima of the signal that are of height of at least one standard deviation of the signal to indicate the number of steps present in the signal. Finally, we computed the number of steps per minute by multiplying the number of steps by 60 and dividing by the time duration to normalize the value. Figure 3 a) shows a sample number of steps (red inverted triangles) from the magnitude signal. The p-value of the relationship between a gold standard and Hexoskin measure was calculated with respect to the null hypothesis that there is no association between the two measures. We used the 0.05 alpha level for statistical significance. We therefore used a p-value below 0.05 to indicate that there was sufficient evidence in the data to establish that changes in the Hexoskin measure are associated with changes in the corresponding gold standard measure.
Fig. 3.
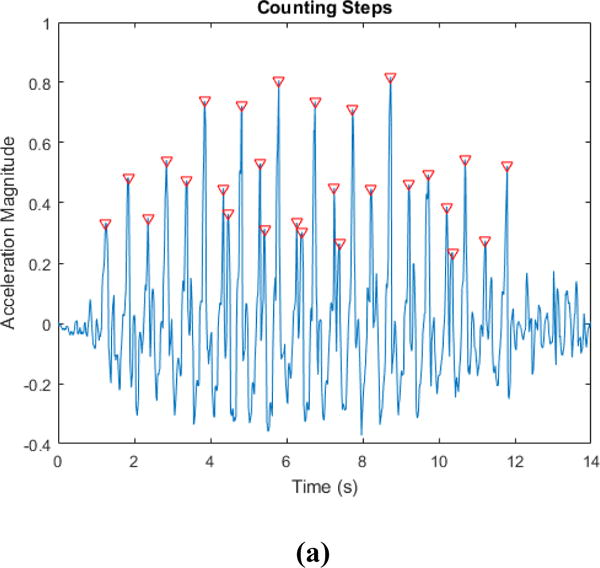
Cadence Plots with a) showing the magnitude of acceleration with the number of steps highlighted using red inverted triangles. Fig. 3 b) shows plot of the Cadence gold standard (Y-axis) vs the Cadence measured by the Hexoskin after signal processing (X-axis). (R = 0.79; P<0.0001). Fig. 3. c) Bland Altman Plot of the Difference (Y-axis) vs the Average (X-axis) for the gold standard and the Cadence measured by the Hexoskin (X-axis).
Using our cadence extraction technique, we obtained a much higher correlation of 0.79 (p < 0.0001). We also computed the coefficient of determination or r2 which was equal to 0.63. In 1983, Altman and Bland [19] proposed a method of plotting the difference between two variables against their average as a means of analyzing the agreement between two different variables that measure the same parameter or property; in this case the Cadence. In Figure 3 (c), we computed the Bland Altman plot of the two measures of Cadence from the vest and the motion capture system. We see the bias or the average of difference is close to 0 (bias less than +1). The red lines above and below the bias line indicate +/−1.96s (s = standard deviation) that describes the region representing 95% of the area under the normal distribution from the mean value.
4.2 Breathing Rate and Minute Ventilation
We analyzed the pulmonary readings for the respiration rate (RR) and the exhaled volume (VE). In our earlier study [5], we found the pulmonary readings to match well when compared with the other measures from the vest on a healthy participant cohort for gait specific activities. For our validation test, resting minute ventilation (VE) and respiratory rate (RR) were measured using a metabolic cart (SensorMedics VMax) in accordance with American Thoracic and European Respiratory Societies’ Guidelines [12]. Participants were seated quietly, with the breath-by-breath data collection for 5 minutes. The 20-second averages from the final two minutes of data collection were used for analyses and reporting.
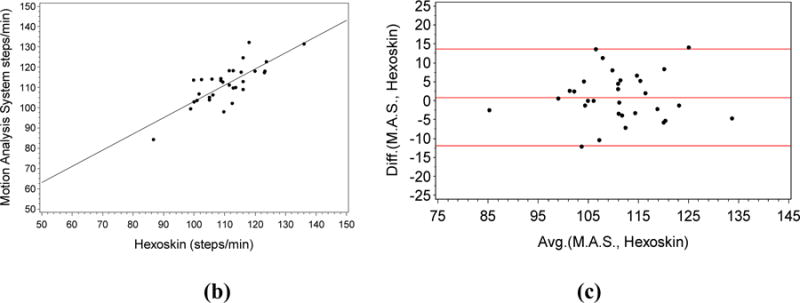
For VE, we obtained a weak positive correlation of 0.2 (Figure 4 a)) that was not significant at alpha level of 0.05 (p = 0.28). We also computed the coefficient of determination which is equal to 0.04.
Fig. 4.
a) Plot of the Volume Exhaled VMax gold standard (Y-axis) vs the VE measured by the Hexoskin (X-axis). (R = 0.2; P=0.28). Fig. 4. b) Bland Altman Plot of the Difference (Y-axis) vs the Average (X-axis) for the gold standard VE and the VE measured by the Hexoskin (X-axis).
From the Bland Altman plot in Figure 4, we saw the bias or the average of difference is close to 0 (bias < +0.5).
The readings for the RR obtained were much more promising. We obtained a much higher correlation of 0.52 (p < 0.005) as seen in Figure 5 a). We also computed the coefficient of determination or which is equal to 0.28.
Fig. 5.
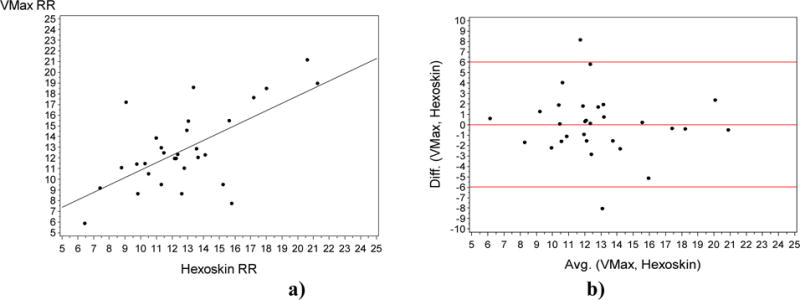
a) Plot of the Respiration Rate gold standard VMax (Y-axis) vs the Respiration rate measured by the Hexoskin (X-axis). (R = 0.52; P=0.004). Fig. 5. b) Bland Altman Plot of the Difference (Y-axis) vs the Average (X-axis) for the gold standard RR and the RR measured by the Hexoskin (X-axis).
From the Bland Altman plot, we saw the bias or the average of difference is almost 0, indicating that the measurement error in this case is low.
4.3 Heart Rate
We assessed the agreement between two quantitative measures of heart rate (HR): via palpation at the radial artery for one minute using the Polar Heart rate monitor and the Hexoskin vest simultaneously while at rest. In this case, we saw that there is a strong positive correlation between the two variables using the Pearson’s correlation [18] with r=0.80 (p < 0.05). We also computed the coefficient of determination or r2 which is equal to 0.64.
The Bland Altman (Figure 6 b)) plot of the two measures obtained the bias or the average of difference that was close to 0 (bias = −3).
Fig. 6.
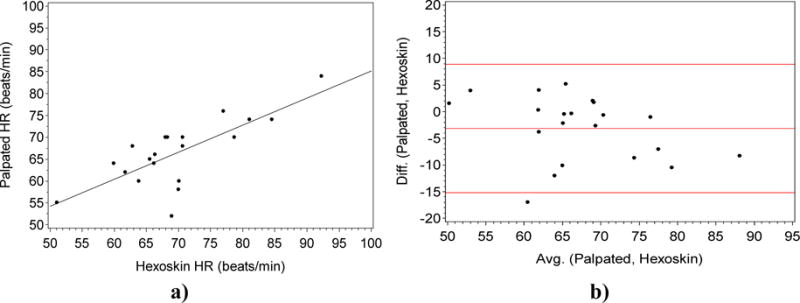
a). Plot of the palpated HR gold standard (Y-axis) vs the heart rate measured by the Hexoskin (X-axis). (R = 0.8; P<0.0001). Fig. 6 b). Bland Altman Plot of the Difference (Y-axis) vs the Average (X-axis) for the gold standard HR and the Hexoskin (X-axis).
4.4 Activity Level
We assessed the agreement between two quantitative measures: the motion capture system already described above in the Section 4.1 [16], and the Hexoskin vest. Specifically, we used the motion capture system to compute the magnitude of the acceleration in the x, y, and z directions of the retroreflective marker placed on the right anterior superior iliac spine (ASIS) of the pelvis, to compare with the accelerometer magnitude readings from the vest sensor. We specifically chose this marker since the accelerometer unit in the vest is located anatomically closest to that marker. From Figure 7 b), we saw that there was a weak negative correlation of −0.13, not significant at the alpha level of 0.05 (p=0.51) between the two variables. Furthermore, the coefficient of determination r2 = 0.0169 was very low for the two variables.
Fig. 7.
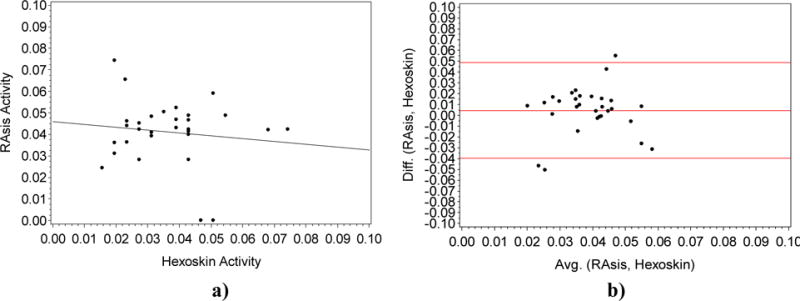
a). Plot of the Right Asis (RAsis) marker using the motion capture (Y-axis) vs the activity level measured by the Hexoskin (X-axis). (R = −0.13; P=0.51). Fig. 7 b). Bland Altman plot Difference (Y-axis) vs the Average (X-axis) for the gold standard Motion Capture and the Hexoskin (X-axis).
We plotted the Bland Altman measured for the two measured for the activity level. Ideally, 95% of the points should lie within +/− 2*(standard deviation of the mean difference). In this case, we saw the bias was very close to 0 (< 0.01).
4.5 Overall Sensor Data Evaluation
We shared the summary of our overall findings in Table I. The correlation between measures was calculated as the standardized regression coefficient of the Hexoskin measure with respect to the gold standard. The p-value of the correlation was calculated as the significance of this standardized coefficient (B/SEB (i.e. slope/standard error of slope), t-distributed with n-2 degrees of freedom) [29]. The three measures HR, RR and Cadence perform significantly well in our current validation study. The other measures do not fare as well in the current study design, but as mentioned in the earlier exploratory analysis conducted in [5], the pulmonary measure VE, as well as the activity level performed well across the diverse age group (including older adults) for activities of longer duration. One thing to note here is that the long-term goal of our project is to use sensing modalities for long-term physiological monitoring of older adults with potential cognitive conditions. This implies that while the raw sensor values themselves may not be useful, relative changes in the sensor readings across different activities over different time periods in the daily lives of the older adults might yet provide important information.
Table I.
Summary of Physiological Measures Using the Hexoskin Sensor.
| Physiological Measures | R | p-value | R-sq. (r2) |
|---|---|---|---|
| HR | 0.80 | <0.0001 | 0.64 |
| RR | 0.52 | 0.004 | 0.27 |
| VE | 0.20 | 0.28 | 0.04 |
| Cadence | 0.79 | <0.0001 | 0.63 |
| Activity | −.13 | 0.51 | 0.016 |
(HR= Heart Rate, RR=Respiration Rate, VE=Volume Exhaled)
5. DISCUSSION
In Figure 2, we discussed the Fels study cohort and the relationships between the different physical and cognitive measures within the cohort. One interesting point raised in this evaluation was the relatively homogeneous nature of the cohort: all the participants belonged to the same ethnicity and their age, gender, economic and physical differences did not play a role in their performance in the SPPB and MOCA tests. From the statistics shared by the Alzheimer’s Association [27], we see that these factors do have a relationship with dementia behaviors, which could affect their performance in the MOCA tests. However, given the limited (31) participant size of our current sample, further investigation needs to be done before determining any relationships between the demographic features, as well as the cognitive and physical performance scores.
5.1 Cadence
For the Cadence measure extracted directly from the vendors, one possible cause for the poor performance could be that in order to remove noise from the data, the manufacturers cleaned the signal such that if the number of steps for a given walk sequence was less than 7 strides, it was discarded. Given that this study involved an older cohort and more than half the participants were slow walkers, this indicated that parts of the SPPB walk sequences were discarded by the system from the Cadence measure computed by Hexoskin. It is important to be aware of the issues of using processed sensor data from commercial devices as some of the signal processing techniques used by the vendors may not be appropriate for the desired application. In such cases it is better to process the raw sensor data. Moreover, proprietary signal processing steps are not always described in detail by the commercial vendors, further justifying the need for the user to develop his or her own methods of processing the raw data.
After using signal processing (Figure 3), we obtained a much higher correlation of 0.79 (p < 0.0001) and a coefficient of determination 0.63. This indicates that 63% of the total variation in Cadence from the motion capture system was explained by the vest sensor. From the Bland Altman plot, we see that all the points are within the 95% data distribution region. This indicated that the Hexoskin did not consistently over or under estimate the gold standard estimates of the cadence readings indicating a lack of bias in the sensor readings for Cadence. We also obtained a standard error of the estimate for Cadence of 5.6. This indicated that if the vest measures number of steps per minute to be 70, the true value will be between 64.4 and 75.6 steps/minute with 68% confidence. From this estimate, we see that while precise measurements within the standard error value cannot be done using this sensor with the older population, a difference in number of steps of around 10 can be detectable, and a larger difference of 20 will be certainly detectable. Since we are exploring the utility of the measurements for continuous monitoring, this finding is of particular use as we want to detect changes in older adults’ activity behavior over months to detect variations in their daily movement patterns. Based on this analysis, and our previous study [5], we conclude that the Cadence measure from the vest can be used as a measure for detecting activity (as well as changes in activity) in the older population, our target cohort. The measure can also be used to detect physical decline over a longer time period (i.e. a change from an active to a sedentary lifestyle) that could indicate a change in the person’s cognitive and physical state.
5.2 Breathing Rate and Minute Ventilation
For VE, we obtained a weak positive correlation of 0.2 (Figure 4) that was not statistically significant at alpha level of 0.05 (p = 0.28), with a coefficient of determination of 4%. This indicated that most of the information from the gold standard is missing from the vest readings for the current cohort. From the Bland Altman plot in Figure 4 b), we see that all but two points are within the 95% area of the data distribution (between the red lines) with a very low bias of approximately 0.5. One possibility for the low accuracy reading of the vest is that the Hexoskin is not meant to be used when a person is completely still (the position of rest when the pulmonary data are collected). Thus, when the pulmonary testing is done with the subjects sitting, the stretch receptors in the vest may have gotten displaced, producing odd signals for changes in thoracic and abdominal volumes, from which the vest ultimately estimates changes in lung volume and thus ventilation. Variation in body composition, as well as body height are other inter-individual factors that can further affect how well the vest functions in a sitting position. From this analysis, we conclude that while the vest may be a reliable instrument for certain gait-related activities in the healthy population [5], the VE measure may not be suitable for measuring different activity states in the low activity older adult population for continuous activity monitoring.
The readings for the RR obtained are more promising. We obtained a much higher correlation of 0.52 (p < 0.005) as seen in Figure 5 a). We also computed the coefficient of determination or r2 which is equal to 0.28. This indicates that 28% of the total variation in the gold standard system is explained by the vest sensor. From the Bland Altman plot (Figure 5b)), we saw the bias was almost 0, indicating that the measurement error in this case is low. We also saw that all but two points (one above, one below) were within the 95% area of the data distribution which further indicated that the data are fairly normally distributed for the current measure.
One factor that could affect these readings is potential systematic error in collecting the pulmonary measures using the metabolic cart; however daily machine calibration is performed to specifications, tests are performed to clinical standards, and any systematic error would be borne out in the Bland-Altman plots. Hence, we see that while the position of rest still confounds the RR readings, the data are significantly correlated, although not as strongly correlated as the cadence measure. We also found the standard error of the estimate for RR to be 2.9. This indicates that if the vest measures RR to be 25, the true value will be between 22 and 28 BPM with 68% confidence. To further clarify this, consider a case where a patient’s respiration goes higher, to say 28 bpm when he is agitated as part of his dementia behavior. However, his normal respiration rate is 20 bpm. Since the standard error as measured by our validation of the RR is 2.9, if we look at the extreme cases, the sensor may measure the normal respiration rate greater than or equal to 22.9 bpm (at 68% confidence) at the upper confidence level, and for the agitated condition if we look at the lower confidence level for the RR, the value will be 25.1 bpm (again at 68% confidence). We see here that there is no overlap between the lower confidence level of the higher RR and the lower confidence level of the baseline RR. This would indicate that RR may be useful in distinguishing between the dementia behavior and the normal condition. However, if on the other hand, if the normal RR was 20 but his RR while agitated was 25, this physiological measure would not be sufficient to detect the differences between the dementia and normal behaviors. While the difference may be critical for certain clinical diagnoses, the RR has shown promise in this study cohort. In fact, the RR sensor from the vest can be used for continuous activity monitoring for extended time periods across different activities including walking, as well as sitting [5], as well as may be useful in detecting different emotional states (such as agitation). Hence, we conclude that we can utilize the RR measure for longitudinal activity monitoring in the older adult population; especially to distinguish between the different activity states over long durations such as walking and resting.
5.3 Heart Rate
We see that there was a strong positive correlation between the two variables using the Pearson’s correlation [18] with r=0.80 (p < 0.05) as well as a coefficient of determination of 0.64 as seen in Figure 6. This shows that there was a strong relationship between the two measures. While the variance is not very high, given the fact that the heart rate is measured in resting state across a population of 31 participants with different health conditions as well as cognition states; the results are quite promising. Also, the performance for this measure is much higher than our earlier study [5] which could be due to the improved vest fitting; in our earlier study, we used a single vest for all the female participants, and another vest for all the male participants. In this study, we use the participants’ shirt sizes to determine their vest size for the female as well as male participants. This allows better placement of the ECG leads for each body size that led to increased accuracy in our current study design. From the Bland Altman plot of the two measures, we obtain the low bias value of −3. From this, we gathered that the measurement error in this case is low. Within the 95% region of the data distribution (red lines in Figure 9), all but one point are within this region. This indicates that the Hexoskin does not consistently over or under estimate the gold standard estimates of the Polar monitor. We also found the standard error of the estimate for HR to be 5.2. This indicates that if the vest measures HR to be 90, the true value will be between 84.8 and 95.2 BPM with 68% confidence. Again we see that a change from 80 to 90 BPM will be a detectable change, and from 60 (resting pulse) to 100 (very active or agitated) will certainly be detected using the HR sensor. From this analysis we conclude that HR can substitute for the gold standard; especially if it is measuring continuous heart rate over an extended time period across different activities including walking, as well as sitting. We can further utilize this measure for longitudinal activity monitoring in the older adult population, especially to distinguish between different activity states over long durations such as walking and resting, as opposed to comparing differences in the same activity state across different individuals.
5.4 Activity Level
From Figure 7, we see that there was a weak negative correlation of −.13, not significant at the alpha level of 0.05 (p=0.51), between the two variables which indicated poor accuracy values. Furthermore, the coefficient of determination of 0.02 is very low for the two variables. From the Bland Altman plot, we see the bias was very close to 0 (< 0.01) indicating that the Hexoskin did not consistently over or under estimate the motion capture estimate for the activity level.
One drawback of the current validation scheme rose from the limited spatial range of the motion capture system that restricted the length of the walk as well as the duration of the activity: the actual gait sequence evaluated for this measure was only a few seconds. Our prior study evaluated gait activities lasting at least 10 minutes [5], but in this case, the sensor values were not precise enough to capture the activity magnitudes due to the smaller duration of the activity. From this analysis, we conclude that the activity measure may not be precise enough to use for longitudinal data analysis in the older adult cohort, at least for smaller time periods. That said, the measure may still be applicable for longer duration activities; especially to measure larger differences across activities. However, this will need to be explored in a further validation study.
CONCLUSION
The present study undertaken by an interdisciplinary team comprising computer scientists, biostatisticians, kinesiology expert, and geriatric researcher reports the results of a validation of the Hexoskin vest, a promising commercially available sensor for long term monitoring of older adults. Specifically, we validated the system in a target cohort of older adults with and without cognitive and physical impairment. Each Hexoskin parameter was directly compared to data collected using corresponding clinical gold standard methods. To our knowledge, previous studies have not investigated multiple sensor parameters in a specific cohort with ground truth comparison for sensor validation. Three of the five parameters measured by the sensor (cadence, respiration rate, and heart rate) showed strong correlations against the gold standard measurements. This indicates the need to proceed cautiously when making clinical decisions using such sensors, and suggests that users should focus on the three strongly correlated parameters for further analysis, at least in the older population. We also computed the standard error associated with the strongly correlated parameter measures that further highlights the type of applications that can use these devices for precision medicine applications. The use of physiological measurement devices such as the Hexoskin may eventually become a non-intrusive way to continuously assess physiological measures in older adults with dementia who are at risk for distressing behavioral and psychological symptoms. While we focus on the Hexoskin, this study will provide a model for validation of the many other wearables on the market today and in the future.
FUTURE WORK
The present study has highlighted the validity of the Hexoskin vest for use in the older adult population. Future work involves testing the sensor over longer time periods with a larger sample of older adults, both with and without cognitive impairment. The Hexoskin has continued to show promise as a sensor platform for detecting changes in activity and behavioral patterns. Additional research is required to study the efficacy of these physiological parameters as predictors for behavioral change in people with dementia as a means of quantifying the sensed data’s role for clinical assessment. The derived understanding can be used to alert caregivers and physicians so that appropriate measures can be taken to ensure the safety and well-being of both the people with dementia, as well as the caregivers.
Fig. 1.
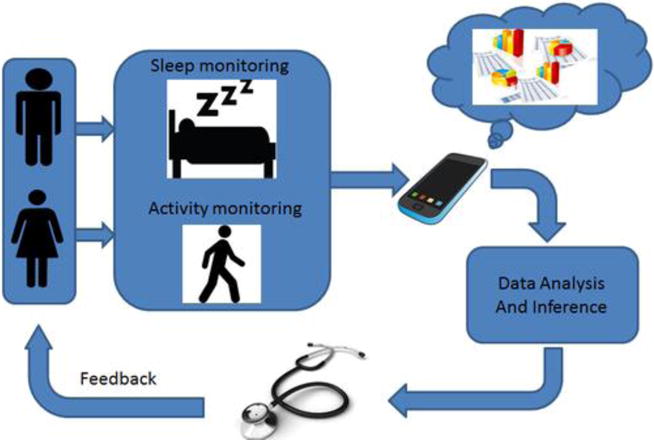
Block Diagram of the overall dementia management system. Wearable sensors will be used to measure activity and sleep in persons with dementia, as well as the caregivers to enable dementia management, as well as corroborate the dementia symptoms with caregiver stress.
Acknowledgments
This work was supported in part by the NIH under grant K01 LM012439-01 and the Boonshoft School of Medicine, Department of Geriatrics Endowment Fund. The authors would like to thank Ms. Traci Rackett, Ms. Gwendolyn Hall, and Ms. Rhonda Sheets for their impeccable professionalism with participant scheduling and data collection. We would also like to thank the participants of the Fels Longitudinal Study, without whom this work would not be possible.
Footnotes
Publisher's Disclaimer: This is a PDF file of an unedited manuscript that has been accepted for publication. As a service to our customers we are providing this early version of the manuscript. The manuscript will undergo copyediting, typesetting, and review of the resulting proof before it is published in its final citable form. Please note that during the production process errors may be discovered which could affect the content, and all legal disclaimers that apply to the journal pertain.
References
- 1.Cisco’s Report on Internet of Everything. Available at http://www.cisco.com/c/dam/en_us/about/ac79/docs/innov/IoE_Economy.pdf. Accessed on 2/20/2017.
- 2.Zisberg A, Young HM, Schepp K. Development and psychometric testing of the Scale of Older Adults’ Routine. Journal of Advanced Nursing. 2009;65(3):672–683. doi: 10.1111/j.1365-2648.2008.04901.x. [DOI] [PubMed] [Google Scholar]
- 3.Clark F, Azen SP, Carlson M, Mandel D, Labree L, Hay J, Lipson L. Embedding Health-Promoting Changes Into the Daily Lives of Independent-Living Older Adults: Long-Term Follow-Up of Occupational Therapy Intervention. The Journals of Gerontology Series B: Psychological Sciences and Social Sciences. 2001;56(1) doi: 10.1093/geronb/56.1.p60. [DOI] [PubMed] [Google Scholar]
- 4.Takacs J, Pollock CL, Guenther JR, Bahar M, Napier C, Hunt MA. Validation of the Fitbit One activity monitor device during treadmill walking. Journal of Science and Medicine in Sport. 2014;17(5):496–500. doi: 10.1016/j.jsams.2013.10.241. [DOI] [PubMed] [Google Scholar]
- 5.Banerjee T, Anantharam P, Romine WL, Lawhorne L, Sheth A. Evaluating a Potential Commercial Tool for Healthcare Application for People with Dementia. International Conference on Health Informatics and Medical Systems (HIMS); Las Vegas. July 27–30, 2015. [Google Scholar]
- 6.Understanding the stress response. Available at http://www.health.harvard.edu/staying-healthy/understanding-the-stress-response. Accessed on 2/20/2017.
- 7.Hexoskin website. Available at www.hexoskin.com. Accessed on 2/20/2017.
- 8.Pasolini A. Sensor-packed Hexoskin shirt measures performance in real time. Available at: http://www.gizmag.com/hexoskin-sensor-t-shirt-body-metrics/29098/Gizmag. September 19, 2013.
- 9.Price K, Bird SR, Lythgo N, Raj IS, Wong JYL, Lynch C. Validation of the Fitbit One, Garmin Vivofit and Jawbone UP activity tracker in estimation of energy expenditure during treadmill walking and running. Journal of Medical Engineering & Technology. 2016:1–8. doi: 10.1080/03091902.2016.1253795. [DOI] [PubMed] [Google Scholar]
- 10.Remoortel HV, Giavedoni S, Raste Y, Burtin C, Louvaris Z, Gimeno-santos E, Troosters T. Validity of activity monitors in health and chronic disease: a systematic review. International Journal of Behavioral Nutrition and Physical Activity. 2012;9:84. doi: 10.1186/1479-5868-9-84. 2012. [DOI] [PMC free article] [PubMed] [Google Scholar]
- 11.Schwarz G. Estimating the Dimension of a Model. The Annals of Statistics. 1978;6(2):461–464. [Google Scholar]
- 12.Miller MR, Crapo R, Hankinson J, Brusasco V, Burgos F, Casaburi R, Jensen R. General considerations for lung function testing. European Respiratory Journal. 2005;26(1):153–161. doi: 10.1183/09031936.05.00034505. [DOI] [PubMed] [Google Scholar]
- 13.Swartz AM, Strath SJ, Miller NE, Grimm EK, Ewalt LA, Loy MS, Gennuso KP. Validity of physical activity monitors in assessing energy expenditure in normal, overweight, and obese adults. The open sports sciences journal. 2009;2:58. doi: 10.2174/1875399X00902010058. [DOI] [PMC free article] [PubMed] [Google Scholar]
- 14.Diaz KM, Krupka DJ, Chang MJ, Shaffer JA, Ma Y, Goldsmith J, Schwartz JE, Davidson KW. Validation of the Fitbit One® for physical activity measurement at an upper torso attachment site. BMC research notes. 2016;9(1):213. doi: 10.1186/s13104-016-2020-8. [DOI] [PMC free article] [PubMed] [Google Scholar]
- 15.Banerjee T, Sheth A. IoT Quality Control for Data and Application Needs. IEEE Intelligent Systems. in press. [Google Scholar]
- 16.Osprey Motion Capture System. Available at: http://www.motionanalysis.com/html/animation/osprey.html. Accessed on 2/12/2017.
- 17.Guralnik JM, Simonsick EM, Ferrucci L, et al. A short physical performance battery assessing lower extremity function: association with self-reported disability and prediction of mortality and nursing home admission. J Gerontol. 1994;49(2):M85–M94. doi: 10.1093/geronj/49.2.m85. [DOI] [PubMed] [Google Scholar]
- 18.Giavarina D. Understanding Bland Altman analysis. Biochemia Medica. 2015;25(2):141–151. doi: 10.11613/BM.2015.015. [DOI] [PMC free article] [PubMed] [Google Scholar]
- 19.Bland JM, Altman DG. Measuring agreement in method comparison studies. Stat Methods Med Res. 1999;8:135–60. doi: 10.1177/096228029900800204. [DOI] [PubMed] [Google Scholar]
- 20.Murphy KP. Diss. University of California; Berkeley: 2002. Dynamic bayesian networks: representation, inference and learning. [Google Scholar]
- 21.Nasreddine ZS, Phillips NA, Bédirian V, Charbonneau S, Whitehead V, Collin I, Chertkow H. The Montreal Cognitive Assessment, MoCA: a brief screening tool for mild cognitive impairment. Journal of the American Geriatrics Society. 2005;53(4):695–699. doi: 10.1111/j.1532-5415.2005.53221.x. [DOI] [PubMed] [Google Scholar]
- 22.Raftery AE. Bayesian model selection in social research. Sociological methodology. 1995:111–163. [Google Scholar]
- 23.Roche AF. Growth, maturation, and body composition: the Fels Longitudinal Study 1929–1991. Cambridge University Press; 1992. [Google Scholar]
- 24.Studenski S, Perera S, Wallace D, Chandler JM, Duncan PW, Rooney E, Fox M, Guralnik JM. Physical performance measures in the clinical setting. J Am Geriatr Soc. 2003;51(3):314–322. doi: 10.1046/j.1532-5415.2003.51104.x. [DOI] [PubMed] [Google Scholar]
- 25.Ismail Z, Rajji TK, Shulman KI. Brief cognitive screening instruments: an update. Int J Geriatr Psychiatry. 2010;25(2):111–120. doi: 10.1002/gps.2306. [DOI] [PubMed] [Google Scholar]
- 26.Won H, Singh DKA, Din NC, Badrasawi M, Manaf ZA, Tan ST, Shahar S. Relationship between physical performance and cognitive performance measures among community-dwelling older adults. Clinical epidemiology. 2014;6:343. doi: 10.2147/CLEP.S62392. [DOI] [PMC free article] [PubMed] [Google Scholar]
- 27.Alzheimer’s Disease statistics. Available at https://www.alz.org/documents_custom/2016-facts-and-figures.pdf. Accessed on 2/20/2017.
- 28.Koller D, Friedman N. Probabilistic graphical models: principles and techniques. MIT press; 2009. 2009. [Google Scholar]
- 29.Witten JG, Hastie T, Tibshirani R. An introduction to statistical learning. Vol. 112. New York: springer; 2013. [Google Scholar]
- 30.Kontkanen P, Myllymäki P, Silander T, Tirri H, Grunwald P. Comparing predictive inference methods for discrete domains. Proceedings of the sixth international workshop on artificial intelligence and statistics 1997 [Google Scholar]
- 31.Versi E. ““Gold standard” is an appropriate term. BMJ. 1992 Jul;305(6846):187. doi: 10.1136/bmj.305.6846.187-b. PMC 1883235 Freely accessible. [DOI] [PMC free article] [PubMed] [Google Scholar]