Abstract
In both humans and mice, the Glu-99-Lys (E99K) mutation in the cardiac actin gene (ACTC) results in little understood apical hypertrophic cardiomyopathy (AHCM). To determine how cross-bridge kinetics change with AHCM development, we applied sinusoidal length perturbations to skinned papillary muscle fibres from 2- and 5-month old E99K transgenic (Tg) and non-transgenic (NTg) mice, and studied tension and its transients. These age groups were chosen because our preliminary studies indicated that AHCM develops with age. Fibres from 5-month old E99K mice showed significant decreases in tension, stiffness, the rate of the medium-speed exponential process and its magnitude compared to non-transgenic control. The nucleotide association constants increased with age, and they were significantly larger in E99K compared to NTg. However, there were no large differences in the rates of the crossbridge detachment step, the rates of the force generation step, or the phosphate association constant. Our result on force/cross-bridge demonstrates that the decreased active tension of E99K fibres was caused by a decreased amount of force generated per each cross-bridge. The effects were generally less or insignificant at 2 months. A pCa-tension study showed increased Ca2+-sensitivity (pCa50) with age in both the E99K and NTg sample groups, and pCa50 was significantly larger (but only for 0.05-0.06 pCa units) in E99K than in NTg groups. A significant decrease in cooperativity (nH) was observed only in 5-month old E99K mice. We conclude that the AHCM-causing ACTC E99K mutation is associated with progressive alterations in biomechanical parameters, with changes small at 2 months but larger at 5 months, correlating with the development of AHCM.
Keywords: sinusoidal analysis, tension transient, stiffness, rate constant, rigor state, nucleotide association, Ca ion sensitivity, pathogenic mechanisms
Introduction
Hypertrophic cardiomyopathy (HCM) is a disease of the left ventricle (LV), in which the LV wall and/or interventricular septum are thickened, thereby reducing the LV volume and thus diminishing cardiac output (Force et al., 2010). A recent study showed that this disease affects one in 200 individuals in the general population (Semsarian et al., 2015), and the health related cost is estimated to be $37 billion annually in the United States alone (AHA, 2009). Approximately 75% of HCM cases are caused by genetic mutations; the remaining cases are sporadic and caused by environmental factors (Seidman & Seidman, 2011). The genes affected encode mostly sarcomeric proteins, and larger proteins tend to have more mutations as expected (Marston, 2011). The cardiac actin gene (ACTC) encodes a medium sized molecule with a molecular weight of 42 kDa. To date, fifteen actin-related mutations are known to cause HCM (Mogensen et al., 1999; Olson et al., 2000; Van Driest et al., 2003; Mogensen et al., 2004; Kaski et al., 2009), and two others are known to cause dilated cardiomyopathy (DCM) (Olson et al., 1998; Olson et al., 2000; Mundia et al., 2012; Dahari & Dawson, 2015) in humans. Our study focuses on one actin mutation, E99K (Glu-99-Lys), which is known to cause apical HCM (AHCM) in both humans and mice (Song et al., 2011; Song et al., 2013). Hypertrophy of the right ventricle (RV) has also been reported with this mutation in felines (Schober et al., 2016) and in humans (Mozaffarian & Caldwell, 2001; D’Andrea et al., 2010).
Actin is the key component of the thin filament and its ability to function normally is vital for efficient force generation and transmission. The ventricles contain an 8:2 mixture of the cardiac and skeletal actin isoforms, and this ratio is conserved among mice, rabbits, bovines, and humans (Vandekerckhove et al., 1986). The genomic sequence of cardiac ACTC is identical in these species, allowing for comparisons across species. Moreover, the genomic sequences of the cardiac and skeletal actin isoforms are 99% identical, with only 5 homologous substitutions (cardiac→skeletal: D2E, E3D, T105L, L299M, and S358I) out of 375 aa residues. Cardiac actin is not phosphorylated in either the non-transgenic (NTg) or E99K mouse model (Song et al., 2011). Actin E99 is located on the surface of actin subdomain 1, and is thought to make an electrostatic interaction with K494 at loop 3 of the myosin head in its lower 50K domain. This may be important for the initial weak ionic actomyosin interaction, as are the negatively charged N-terminus of actin (4 negative residues) and the positively charged loop 2 of myosin (5 positive charges). The electrostatic interaction can take place at a long distance (7 Å at 200 mM ionic strength (Wang et al., 2015)). Therefore this interaction facilitates the search for the binding site of actin by myosin. The ionic interaction is followed by a stronger hydrophobic interaction, which takes place at a shorter distance (~1 Å) and must be stereospecific as multiple sites are involved.
The experiments in this report were designed to understand the pathogenesis caused by the cardiac ACTC E99K mutation, which is known to result in AHCM in both humans and mice. Because preliminary results indicate that AHCM develops with age (Song et al., 2011), samples were chosen from 2- and 5-month old (mo) mice. Skinned papillary muscle fibres (strips) from E99K transgenic (Tg) mice were subjected to various types of activation and to sinusoidal length perturbation to study tension transients, and the cross-bridge kinetics were compared with those for NTg littermates. The cross-bridge kinetics are essential to understand how the functions of the muscle are altered with AHCM development, however, this aspect was never studied before. Because the E99K mutation changes the electric field of subdomain 1 of actin, this mutation is expected to change the actomyosin interaction. The change of this interaction causes a change in force generated in the animal that harbors the E99K mutation, which eventually results in AHCM. Why and how this mutation affects the actin-myosin interaction at the level of cross-bridges is an essential feature of our study. We found that the force generated per cross-bridge was reduced in E99K mouse papillary muscles, resulting in an overall reduction of active tension that must trigger the disease.
Materials and methods
Transgenic mice
The generation of ACTC E99K mice based on C57Bl6 × CBA/Ca genetic background was carried out in Professor Steven Marston’s lab at the National Heart and Lung Institute, Imperial College London, London, UK. Their phenotypic characterization was done by echocardiography as described (Song et al., 2011). All animal procedures were performed according to the United Kingdom Animals Act of 1986. Breeding was performed by crossing E99K heterozygote mice and NTg mice, which yielded 37% E99K and 63% NTg in a litter (Song et al., 2011). Their genotypes were identified from an ear biopsy, and E99K vs. NTg littermates of male were compared at 2-mo and 5-mo. Mice were killed by decapitation, and their hearts were harvested with blood removed in Dr. Marston’s lab. The samples were stored in liquid nitrogen and sent to Iowa. Before the biophysical studies, the hearts were thawed slowly, first at −80°C for ~ 3h, then at −20°C for ~ 3h, followed by 0°C on ice for 2h. This thawing technique was developed by Dr. Amy Li at University of Sydney, to protect the fibres as much as possible from damage (personal communication). The heart samples were chemically skinned as reported previously (Wang et al., 2013; Wang et al., 2014). Papillary muscles were then isolated, split into several bundles in glycerol storage solution (50% glycerol, 50% skinning solution) and stored at −20°C.
Fibre preparations
Fibre preparations with a diameter of ~100 μm and a length of ~2 mm were dissected and mounted on the experimental apparatus by attaching their ends to two stainless-steel hooks with a small amount of nail polish. One hook was connected to a length driver (Kawai & Brandt, 1980) to control the fibre length, and the other to a Güth-type tension transducer (Myotronic UG, Heidelberg, Germany) to detect isometric tension and its transients. This method did not introduce much compliance at the ends; end compliance only affects slow rates such as the rate of tension redevelopment (kTR) measurements (Wang & Kawai, 2013), and fast rates 2πb and 2πc (those reported in this manuscript) are not affected (Wang et al., 1999). All measurements were performed at 25°C. Solutions used for experiments were described previously (Wang et al., 2014).
Mechanical studies
The standard activating solution contained 5 mM MgATP, 8 mM phosphate (Pi), 15 mM phosphocreatine (PCr), 80 unit/ml creatine kinase (CK), 1 mM Mg2+, 6 mM CaEGTA (pCa 4.66), 10 mM MOPS, 55 mM total Na; the ionic strength adjusted to 200 mM using potassium acetate (KAc) and pH to 7.00 with KOH. Other activating solution variants were prepared from the standard activating solution while keeping ionic strength at 200 mM using KAc.
When isometric tension reached a steady plateau, fibres were subjected to sinusoidal length oscillations with an amplitude of 0.125%, and the frequency (f) ranging from 0.5Hz to 140Hz. This amplitude corresponded to 0.7 nm at the cross-bridge level with 50% series compliance, and the frequency range corresponded to 1.1-320 ms in time domain analysis. The time courses of both tension and length were digitized simultaneously with two 16-bit A/D converters, and the complex modulus Y(f) data were calculated by performing discrete Fourier transforms on these time courses. Only the first harmonic was considered in this report; Y(f) is the stress-to-strain ratio expressed in the frequency domain and is the equivalent of tension transients in step analysis.
The results of sinusoidal analysis were fitted to Eq. 1 (Kawai & Brandt, 1980; Kawai et al., 1993; Wannenburg et al., 2000), which is based on two exponential processes:
| (1) |
where f=frequency of length oscillation, , Y(f)=complex modulus relating strain change (normalized length change) to tension change in the frequency domain, b=characteristic frequency of medium-speed exponential process, c=characteristic frequency of fast-speed exponential process (b<c), B and C are their respective magnitudes (amplitudes) and H=constant. 2πb and 2πc are the respective apparent (observed) rate constants of processes B and C. Stiffness of active muscle is the extrapolation of Y(f) to the infinite frequency (f→∞) and it is calculated as Y∞=H−B+C.
The results of ATP and ADP studies were fitted to Eq. 2 (Kawai & Halvorson, 1989; Kawai & Halvorson, 1991), which is based on a six-state cross-bridge model (Scheme 1).
| (2) |
where D=[MgADP], D0=contaminating ADP, S=[MgATP], K0=association constant of MgADP, and K1=association constant of MgATP to the myosin head, k2=the rate constant of cross-bridge detachment and k−2=the rate constant of its reversal step.
Scheme 1.

Cross-bridge model used for analysis. A=actin, M=myosin, S=MgATP, D=MgADP, P=Pi (phosphate). Upper case letter K represents equilibrium constants, and lower case letter k represents the rate constants of elementary steps.
The results of the Pi study were fitted to Eq. 3 (Kawai & Halvorson, 1991) and Eq. 4 (Kawai & Zhao, 1993), which are based on the six-state cross-bridge model (Scheme 1):
| (3) |
| (4) |
where k4=the rate constant of force generation step 4, k−4=its reversal step, K5=Pi association constant for the myosin head (1/K5=Pi dissociation constant), T5=tension generated by crossbridge state AM*DP (Scheme 1), and T6=tension supported by cross-bridge state AM*D. X5 and X6 are the probabilities of cross-bridges at the AM*DP and AM*D states, respectively. As shown previously (Fortune et al., 1991; Kawai & Halvorson, 1991; Dantzig et al., 1992), because tension develops on isomerization (step 4), and the same tension is maintained with the Pi release (step 5), it is assumed T5=T6. Actual fitting was performed first with Eq. 3 to find k−4 and K5, then with Eq. 4 to find K4 and T5, by using K5 deduced from the fitting to Eq. 3. k4 was calculated from k4=K4k−4.
The results of the pCa-tension study were fitted to the 3-parameter Hill equation (Eq. 5):
| (5) |
where Tact=Ca2+ activatable tension, Ca50=apparent Ca2+ dissociation constant, pCa50=−log10Ca50 =Ca2+-sensitivity and nH=cooperativity.
Statistical analysis
All data are expressed as mean ±SEM. Two-way ANOVA was performed to compare the differences in gene type and age, using SPSS 16.0 software for Windows. Because post-hoc test could not be performed with SPSS factor of two levels (as in our case), t-test was applied in this study with 2×2 experimental design to compare differences between groups when an interaction effect was discovered. The same statistic method was used in a previous study (Perhonen et al., 2001).
The difference between fibres of the same genotype from two age groups (2-mo and 5-mo) were marked as ** if p<0.01, as * if 0.01≤ p<0.05, and as (*) if 0.05≤ p<0.1. The difference between fibres of the two genotypes (NTg and E99K) from mice of the same age were marked as ## if p<0.01, as # if 0.01≤ p<0.05, and as (#) if 0.05≤p<0.1.
Results
Tension and stiffness of the standard activation
The four sample groups were first compared with respect to active tension (Fig. 1A), stiffness (Y∞; Fig. 1B) and the tension:stiffness ratio (Fig. 1C) in the standard activating solution. E99K fibres produced significantly less tension and stiffness (29–31% reduction) than NTg at 2 months, and this difference increased to 38-41% by 5 months. The tension:stiffness ratio was not significantly different among the 4 groups.
Fig. 1.
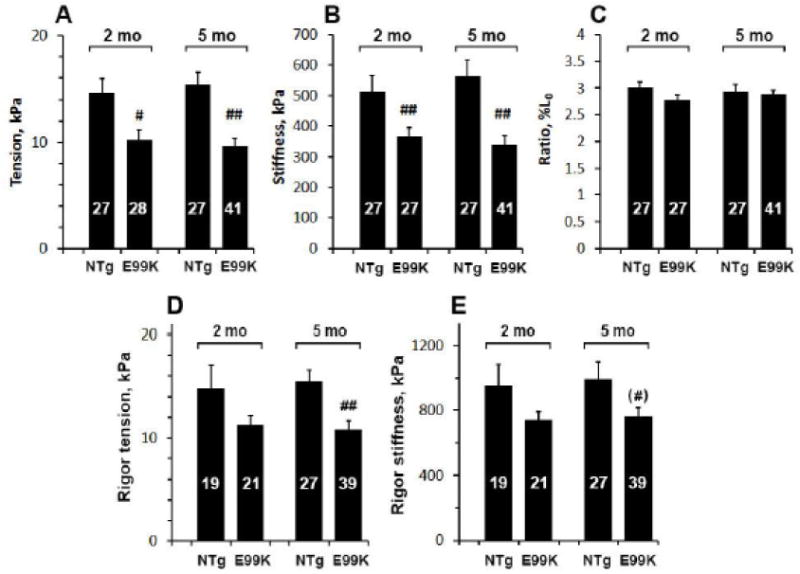
Steady-state parameters of the standard activation at 25°C: active tension in (A), stiffness (Y∞, elastic modulus) in (B), and tension:stiffness ratio in (C). Steady-state parameters of rigor tension in (D), and stiffness (E) among 4 sample groups. The mean and SEM are shown. The number on each bar indicate the number of preparations used for averaging. Significance marks (* and #) are described in “Statistical analysis” section and same for all figures.
Rigor tension and stiffness
The rigor state was induced by removing ATP from the standard activation with two solution changes, and tension and stiffness were measured (Fig. 1D and 1E). We found that the rigor tension at 2-mo was less in the E99K than NTg sample group, but this difference was not significant. At 5-mo, a significant difference developed and tension was much lower in E99K than NTg (Fig. 1D). Rigor stiffness had a similar trend, but the difference did not reach significance (Fig. 1E).
Sinusoidal analysis
The complex modulus data deduced from the sinusoidal analysis during the standard activation are plotted as elastic modulus vs. frequency (on semi-log scale, Fig. 2A), viscous modulus vs. frequency (Fig. 2B) and elastic vs. viscous moduli (Nyquist plot, Fig. 2C). The data were fitted to Eq. 1 to determine the apparent rate constants 2πb and 2πc and their magnitudes B and C. Continuous lines in Fig. 2 represent best-fit curves and the fittings were generally satisfactory, indicating the appropriateness of the fitting equation with the two exponential processes. Their magnitudes were less in E99K than in NTg, and their difference became larger with age (Fig. 3C and D). The magnitude parameters approximately scaled with tension (Fig. 1A). No difference in the rate constant 2πb was found at 2-mo, but 2πb was significantly smaller at 5-mo (Fig. 3A). 2πc did not differ significantly among the 4 sample groups (Fig. 3B).
Fig. 2.
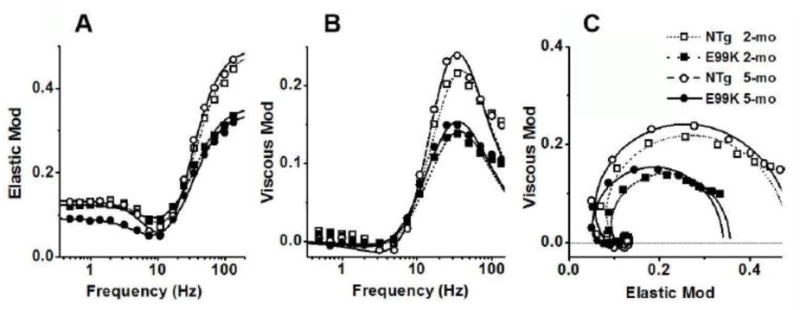
Complex modulus during the standard activation. (A) Frequency plot of elastic modulus, (B) frequency plot of viscous modulus and (C) plot of viscous modulus vs. elastic modulus (Nyquist plot). Averaged data for 23 experiments (NTg, 2-mo), 23 experiments (E99K, 2-mo), 25 experiments (NTg, 5-mo) and 30 experiments (E99K, 5-mo). The continuous lines represent best fit of the data to Eq. 1.
Fig. 3.
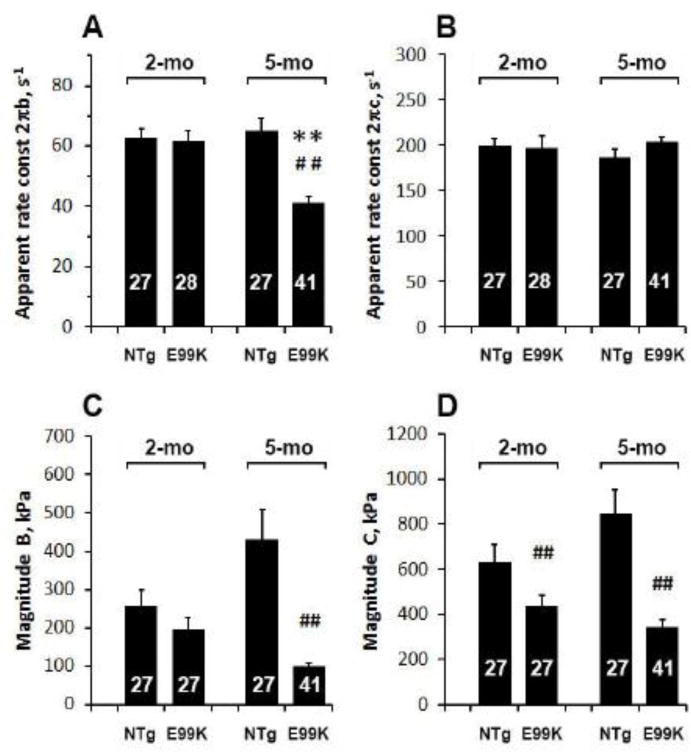
Comparison of two exponential processes among 4 sample groups during standard activation. The apparent rate constants 2πb and 2πc are plotted in (A) and (B), respectively, and their magnitudes B and C are plotted in (C) and (D), respectively.
Effect of ATP
To characterize ATP association (Step 1 in Scheme 1) and rapid cross-bridge detachment from the thin filament (Step 2), we changed the [MgATP] (0.05-10 mM) by keeping Pi at 8 mM, and performed sinusoidal analysis at each [MgATP]. Active tension is plotted in Fig. 4A, and the apparent rate constant 2πc in Fig. 4B, both on the semi-log scale. This shows that tension decreased and 2πc increased as [MgATP] was increased, and that they were saturated by 5 mM; the rate constant 2πc increased in sub mM range and saturated at 1-10 mM. These results were interpreted by Scheme 1 by fitting the data in Fig. 4B to Eq. 2. The continuous lines represent best fit curves, and the data fitting was generally satisfactory, indicating that Scheme 1 is the simplest interpretation of the data in Fig. 4B. The fitted parameters are plotted in Fig. 5 and the results are compared across the 4 sample groups. The ATP association constant K1 (Fig 5A) increased with both mutation and age, and was largest for the 5-mo E99K group. The rate constant k2 (Fig. 5B) did not differ significantly across sample groups, but k−2 (Fig. 5C) in the E99K group was significantly lower at 5-mo compared to 2-mo. The equilibrium constant, K2, did not change significantly with either mutation or aging (Fig. 5D).
Fig. 4.
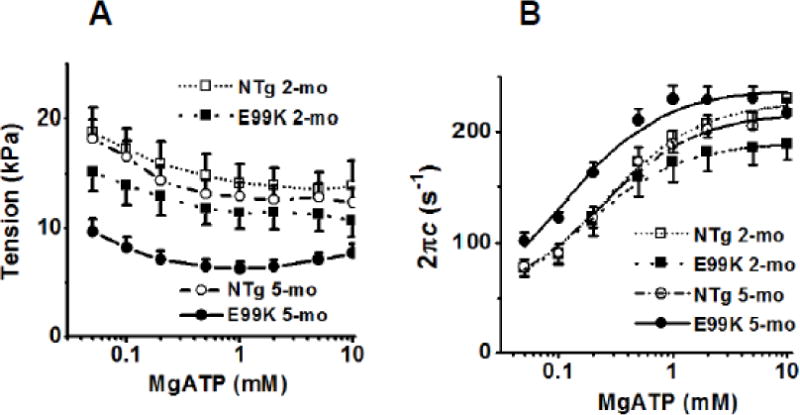
Effect of MgATP on (A) tension, and (B) the apparent rate constant 2πb. Averaged data of 10 experiments (NTg, 2-mo), 9 experiments (E99K, 2-mo), 13 experiments (NTg, 5-mo) and 15 experiments (E99K, 5-mo). In (B), continuous lines are best fit of the data to Eq. 2.
Fig. 5.

ATP association constant (K1 in A), the rate constant of detachment (k2 in B), its reversal rate constant (k−2 in C) and the equilibrium constant of cross-bridge detachment (K2=k2/k−2 in D), are compared among 4 sample groups.
Effect of ADP
To characterize ADP dissociation (Step 0 in Scheme 1), we changed the [MgADP] (0-3 mM) by keeping MgATP at 2 mM and Pi at 8 mM in the absence of PCr or CK. To determine the effects of PCr and CK when no ADP was added, two solutions were made: with PCr/CK (00D) and without PCr/CK (0D). As [MgADP] increased, tension increased (Fig. 6A) and 2πc (Fig. 2B) decreased, and both approached saturation. The data in Fig. 6B were fitted to Eq. 2 with K1, k2, and k−2 obtained from the ATP study; the continuous lines in Fig. 6B represent best fit curves. In Fig. 6C, the fitted parameter (K0) is compared across the 4 sample groups. The ADP association constant increased with both mutation and age; it was largest at 5-mo and this effect was similar to the ATP association constant K1 (Fig. 5A). This is consistent with the fact that ADP is a competitive inhibitor of ATP (Kawai & Halvorson, 1989) and they bind to the same site on the myosin head.
Fig. 6.
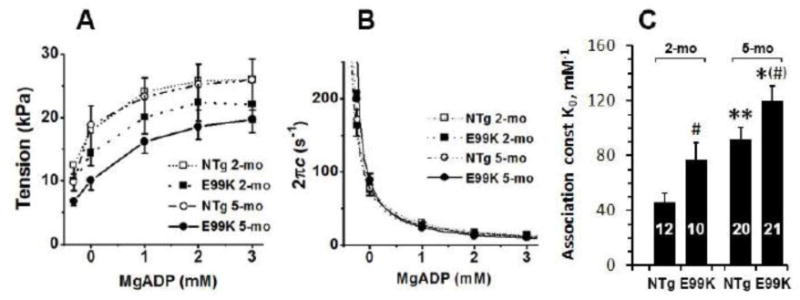
Results of the ADP study. (A) The effect of ADP on active tension. (B) The effect of ADP on the apparent rate constant 2πc. For (A) and (B), averaged data for 8 experiments (NTg, 2-mo), 6 experiments (E99K, 2-mo), 9 experiments (NTg, 5-mo) and 10 experiments (E99K, 5-mo). Continuous lines are best fit of the data to Eq. 2. (C) ADP association constant (K0) is compared among 4 sample groups. Abscissa value of 0 mM indicates that no ADP was added (0D solution). The point to the left of 0 mM is the solution with PCr/CK (00D solution) to determine D0 (contaminating ADP concentration).
Effect of Pi
To characterize force generation step 4 and phosphate release step 5, the Pi concentration was changed from 0 mM to 30 mM above baseline Pi (~0.7 mM) (Kawai & Halvorson, 1991; Dantzig et al., 1992). [MgATP] was kept at 5 mM and pCa was 4.66 in these experiments. The solutions in this series are variants of the standard activating solution in which ionic strength (200 mM) and other ionic constituents are maintained. Fig. 7A plots tension vs. [Pi] and Fig. 7B plots the sum of the apparent rate constants (2πb+2πc). Tension decreased and the sum increased as [Pi] was increased, and both approached saturation at 16–30 mM Pi. The rate constant results were fitted to Eq. 3 and tension to Eq. 4 sequentially, and the best fit curves are included in Fig. 7. The data fittings are generally satisfactory, indicating that the cross-bridge model (Scheme 1) and associated equations are appropriate for describing cross-bridge kinetics.
Fig. 7.
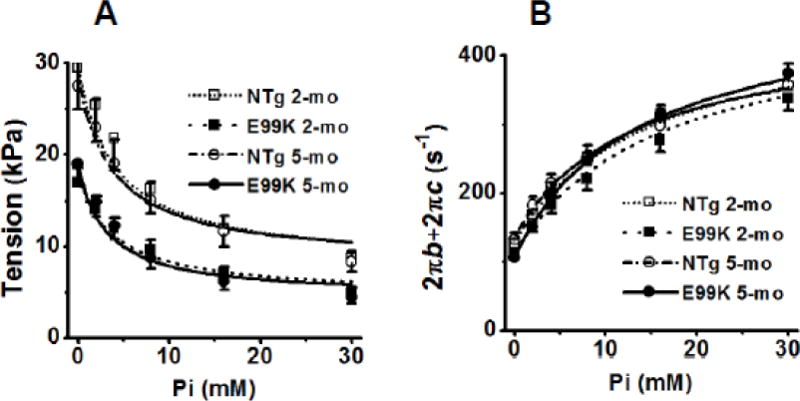
Effect of Pi on (A) tension and (B) the sum of the apparent rate constants (2πb+2πc). Averaged data for 14 experiments (NTg, 2-mo), 10 experiments (E99K, 2-mo), 8 experiments (NTg, 5-mo) and 19 experiments (E99K, 5-mo). Continuous lines represent best fit of the data to Eq. 4 (A) and Eq. 3 (B).
From these data fittings, the forward rate constant of step 4 (k4), its reversal rate constant (k−4), its equilibrium constant (K4=k4/k−4) and Pi association constant (K5) were deduced, and they are plotted in Fig. 8A-D. Step 5 is the Pi release step and its dissociation constant is 1/K5. Based on experimental results on fibres, it has been known for some time that force is generated on step 4 (Fortune et al., 1991; Kawai & Halvorson, 1991; Dantzig et al., 1992; Kawai & Zhao, 1993). The above fitting also yielded force generated by the crossbridge state AM*ADP.Pi (T5), as defined by Eq. 4. This result is also plotted in Fig. 8E and compared among the 4 sample groups. The rate constant of the force generation step (k4) and its reversal rate constant (k−4), respectively, did not differ significantly among the 4 sample groups (Fig. 8B). Thus K4 (=k4/k−4) was also similar among the 4 sample groups. With regard to the Pi association constant (K5), a trend towards a decrease was observed for the E99K samples, but this difference was not significant (Fig. 8D). The force/cross-bridge (T5; Fig. 8E) was 41% less in E99K than NTg at 2-mo and 39% less in E99K than NTg at 5-mo, and these differences were significant. However, age had no specific effect.
Fig. 8.
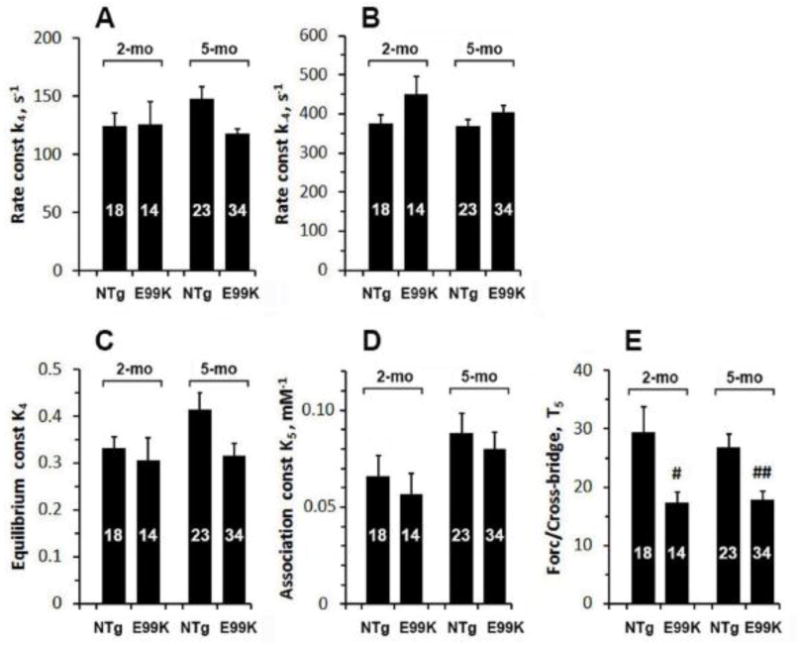
(A) Rate constant of the force generation step (k4), (B) rate constant of its reversal step (k−4), (C) equilibrium constant of the force generation step (K4), (D) Pi association constant (K5), and (E) force generated per cross-bridge (T5) are compared among 4 sample groups.
Ca2+-sensitivity
Because an increase in Ca2+-sensitivity is thought to be a hallmark of HCM, we studied the effects of [Ca2+] on the 4 sample groups in the presence of 5 mM MgATP and 8 mM Pi. Fig. 9A shows the results of pCa study; the data were fitted to Eq. 5. In Fig. 9A, continuous lines represent best fit curves to Eq. 5. Ca2+-sensitivity (pCa50) is plotted in Fig. 9B, and cooperativity (nH) in Fig. 9C. Fig. 9B demonstrates that pCa50 was higher in the contexts of both the E99K mutation and aging. However, these increases were small and amounted to 0.05-0.09 in pCa units (corresponding to a 12-23% increase). Fig. 9C demonstrates that a significant reduction in cooperativity occurred only in the 5-mo E99K sample groups.
Fig. 9.
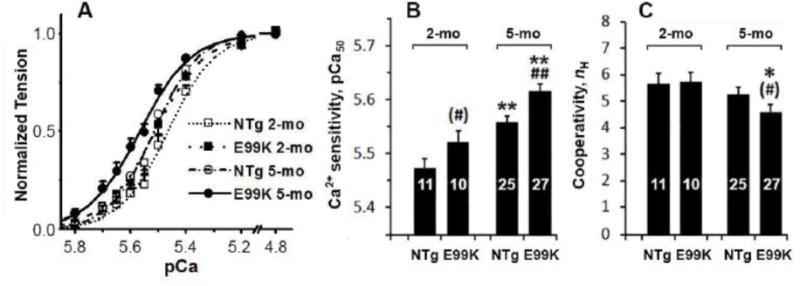
(A) pCa-tension plot. Averaged data for 7 experiments (NTg, 2-mo), 6 experiments (E99K, 2-mo), 10 experiments (NTg, 5-mo) and 12 experiments (E99K, 5-mo). Continuous lines represent best fit of the data to Eq. 5. (B) Ca2+-sensitivity (pCa50), and (C) cooperativity (nH) are compared among 4 sample groups.
Discussion
We studied the effect of aging on the development of AHCM in a mouse model with the E99K mutation and compared the results with its litter mate without mutation (NTg) at ages 2 month old (2-mo) and 5 month old (5-mo). The most important finding is that force/cross-bridge was 40% lower in the mutant at both ages (Fig. 8E), which parallels a 30% decrease in the active tension generated by cardiac muscle fibres (Fig. 1A). We also found that the mutation results in increases in the association of ATP with cross-bridges (Figs. 5A and 6C). This may be related to the fact that active tension was decreased, as we found earlier in rabbit psoas fibres that the ATP association increases when tension decreases (Zhao et al., 1996). Ca2+-sensitivity increased, but this change was small (Fig. 9B).
It would be desirable to compare our results with those when a mutant protein is fully expressed and before the onset of signaling cascades that cause pathogenic changes in the heart. Evidently, such tissue is not available with Tg animals, hence an alternative method must be sought. Previously, we have performed such experiments on thin-filament reconstituted bovine septomarginal trabecula muscle fibres (Bai et al., 2015). In that study, we selectively removed the thin filament by using gelsolin, and reconstituted it by using insect-cell generated ACTC α-actin mutant E99K. Active tension was 19% less when E99K actin was compared to wildtype (WT) control. This is comparable to the result in Fig. 1 in which a decline of active tension was shown: 30% less tension was observed at 2-mo and 32% at 5-mo. ΔpCa50=+0.12 (Bai et al., 2015) can be compared to +0.05 at 2-mo and +0.06 at 5-mo (Fig. 9). K1 increased by 1.1×, which correlates with 1.3× at 2-mo and 1.5× at 5-mo as shown in Fig. 5A. Other kinetic parameters of the mutant (K2, K4, K5, k2, k−2, k4, and k−4) were not significantly different from those of WT, or 2-mo and 5-mo mice compared to NTg control, demonstrating that the force/cross-bridge was reduced when E99K actin was introduced. There were 10-15× differences in the rate constants, because of the difference in the bovine and mouse hearts; specifically, the mouse heart beats 10-15× times faster than the bovine heart.
Possible ionic interaction sites of actin and myosin
It has been known for some time that the N-terminus of actin is negatively charged with 4 acidic residues D and E. In human cardiac actin it begins with DDEE and in rabbit skeletal actin with DEDE. In rabbit skeletal myosin, loop 2 (residues 625-645) is positively charged with 5 K residues (Geeves & Holmes, 1999), but in Dictyostelium myosin-IE myosin, loop 2 (547-561) has 2 R and 2 K residues (Durrwang et al., 2006). It is thought that the electrostatic interaction between the N-terminus of actin and loop 2 of myosin is essential for the initial actomyosin interaction. The significance of this interaction was first demonstrated in cross-linked actin and myosin (Sutoh, 1983), and later with a loop 2 mutant of myosin’s motor domain (Furch et al., 1998), both in solution systems. We have shown their importance in the skinned fibre system, in which the thin filament was extracted and reconstituted with yeast-generated mutant forms of actin whose N-terminal negative charges were of variable lengths (Lu et al., 2005). Skinned fibre studies are important because all the contractile proteins are present at high concentrations in the presence of steric constraints enabling cooperativity among contractile proteins, experiments can be performed under the physiological ionic conditions that exist in working cardiomyocytes, and active force can be measured. Because the electrostatic interaction works over a long distance (within ionic atmosphere of ~7 Å at 200 mM ionic strength (Wang et al., 2015)), this interaction is thought to position actin and myosin approximately in place, making a stronger, more stereospecific interaction possible.
A single ionic interaction is not sufficient to orient myosin with respect to actin in the thin filament in the 3D space; additional interaction site(s) are required. This can be achieved by an antiparallel dipole-to-dipole interaction. The associated aa residues must be situated on the surface of proteins. On the actin side, E99→R95 in subdomain 1 makes one dipole (depicted by an upward arrow in Fig. 10B) and the presence of actin E100 strengthens this dipole. On the myosin side, D500→K494 in loop 3 makes another dipole (downward arrow in Fig. 10B). Here, the actin residues are numbered based on chicken skeletal actin (Behrmann et al., 2012), and the myosin residues are numbered based on Dictyostelium myosin-IE (Durrwang et al., 2006). Similar to E99K, mutational studies have suggested that, like E99K, R95 may interact with myosin (Miller et al., 1996; Bookwalter & Trybus, 2006) and as modeled (Rayment et al., 1993). Fig. 10A depicts actin and myosin segments, with distances between α-carbons of associated residues indicated, after maximizing the dipole-dipole interaction. It is noteworthy that the charged group of D (Asp) is located at ~3 Å from α-carbon, E (Glu) at ~4 Å, K (Lys) at ~5 Å, and R (Arg) at ~6 Å from α-carbon. Consequently, side chains of actin R95 and myosin D500 actually touch each other, as do side chains of actin E99 and myosin K494. The distance between the actin N-terminus and myosin loop 2 is large (62 Å), because this distance is not minimized. It is measured between actin E4 and myosin K557 (same distance with K556). The estimated distance for D1-E4 is 9 Å (α-carbons), and the length of D and K side chains total 9 Å. These considerations reduce the distance to 44 Å, but there is still a problem with this interaction. Either the distance of 44 Å is too long or, if it is minimized then myosin has to rock on actin at R95 as a pivot, but then the distance between actin E99 and myosin K494 becomes too long. This paradox can be resolved if the actin N-terminus is flexible and it can be extended, which appears to be the case, because the N-terminal region is a loosely knit loop (Fig. 10A). On the myosin side, both loops 2 and 3 are flexible and can be pulled towards actin, which may induce a conformational change in myosin. It is well known that myosin ATPase activity is minimal in the absence of actin and that the ATPase increases significantly in the presence of actin (Bremel & Weber, 1972; Taylor, 1979), suggesting a conformational change in myosin upon interacting with actin. We propose that movements of loop 2 and/or loop 3 towards actin may initiate such conformational change.
Fig. 10.
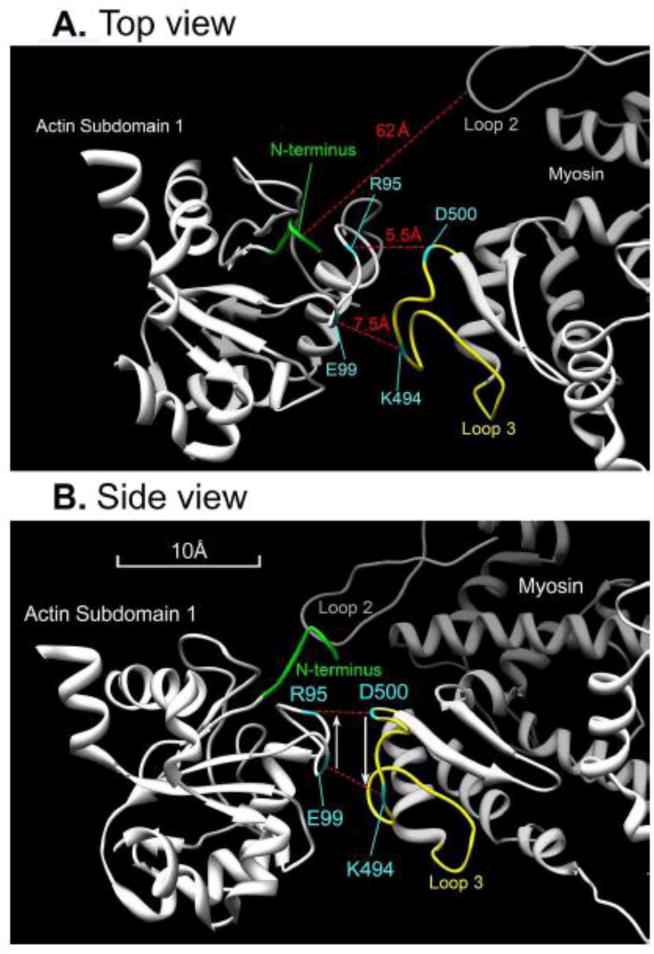
A model of the interaction between actin (left) and myosin (right) molecules (partial view of actin subdomain 1 and myosin lower 50 kD domain) in which a dipole interaction is maximized. (A) Top view. (B) Side view with 90° rotation. Broken red lines indicate ionic interactions. The distance indicated in (A) is based on α-carbon atoms of respective residues. The distance between N-terminus and loop 2 is based on actin E4 and myosin K557 (or K556). Actin D1 and E2 are not shown because their coordinates cannot be determined. The N-terminus has an irregular loop structure (shown in A), which may be extended as it interacts with loop 2. Actin residues are numbered based on rabbit skeletal actin (Behrmann et al., 2012), and myosin residues are numbered based on Dictyostelium myosin-IE, which is a fast molecular motor involved in phagocytosis (Durrwang et al., 2006). Protein Data Bank (PDB) accession code of the actin-Tpm-myosin complex is 4a7f.
Hydrophobic interaction
The ionic interaction works over a long distance (7 Å at 200 mM ionic strength (Wang et al., 2015)), but is not as strong as the hydrophobic interaction, which works only at a short distances (~1 Å). If more than two residues are involved, the interaction must be stereospecific because of this requirement of close proximity. The hydrophobic interaction is thought to be the basis of the strong interaction that leads into force generation. In fact, we have demonstrated that a large temperature effect of active tension originates from the hydrophobic interaction, which promotes the force generation step 4 (Zhao & Kawai, 1994; Murphy et al., 1996; Kawai, 2003). The temperature effect appears to have increased as vertebrates adapted to the terrestrial life (Rall & Woledge, 1990), suggesting that the hydrophobic interaction has gradually replaced the ionic interaction for the mechanisms of force generation. This implies that a stronger force can be generated by the hydrophobic interaction than by the ionic interaction. The fact that the ionic interaction also affects force generation was shown in our earlier studies on actin’s N-terminal mutants in skinned fibres (Lu et al., 2005). This suggests that the initial ionic interaction triggers the increased hydrophobic interaction presumably by pulling loops 2 and/or loop 3, as discussed above, so that more stereospecific interaction can be achieved (Lu et al., 2005). Possible hydrophobic interaction sites have been proposed (Rayment et al., 1993; Holmes et al., 2004; Lorenz & Holmes, 2010; Behrmann et al., 2012).
Mixture of cross-bridges between mutant and NTg
Because the E99K mouse model with ACTC (cardiac) α-actin mutation we used is heterozygous, the proportion of actin E99K in our samples is 50±5% when adulthood is reached such as by 5-mo (Song et al., 2011; Rowlands et al., 2017). That means that only half of the cross-bridges interact with actin mutant E99K. The 40% reduction in force/cross-bridge at 5-mo (Fig. 8E) is the average for all the cross-bridges. We therefore surmise that for the E99K cross-bridges alone the reduction would be closer to 80% assuming a linear dose-response relationship. The basis of such linear relationship is because the two kinds of crossbridges are arranged in parallel in half sarcomere, hence their force is additive. This means that the reduction in force caused by this single residue substitution would be, in fact, is very large, and that the role of this negatively charged residue (E99) in force generation is significant. The reason why the change of some kinetic parameters is less at 2-mo than at 5-mo (Figs. 3, 5A, 8A and 8C) may be due to the increased expression of ACTC actin with/without mutation at older age at the expense of ACTA1 (skeletal) actin (no mutation). During development ACTA1 actin is expressed in the heart, which is gradually replaced by ACTC actin by the adulthood (Vandekerckhove et al., 1986; Nowak et al., 2009).
Comparison with previous reports on ACTC E99K Tg mice
Although the tension results from the current investigation may appear to be different with those reported in (Song et al., 2013), this qualitatively is not the case and actually there are many similarities. The current results for 2-mo mice can be directly compared to their results for single myofibrils from 73-85 day old mice. In our study a decrease of isometric tension by 30% was observed in the mutant (Fig. 1A), whereas Song et al. observed a 10% decrease. The absolute values are different (15 kPa vs 70 kPa, respectively), because the presence of 8 mM Pi diminishes this value by 2× (compared to the absence of Pi), and because of a difference in the cross-sectional area occupied by contractile proteins between cardiac fibres and myofibrils. Whereas a large fraction of the cross-sectional area of a cardiac fibres is occupied by intracellular mitochondria and extracellular matrix that includes blood vessels, which account for another 2-4×; myofibril preparations do not have these components. Consequently, the total difference would be 2×3=6×, and 6×15 kPa=90 kPa, indicating that the active tension measured in our study would be actually larger than that of myofibrils. Song et al. observed a 2.35× increase in Ca2+-sensitivity (=0.80/0.34) (Song et al., 2013), which corresponds to ΔpCa50=+0.37 (=log102.35), although ΔpCa50 was reported as +0.12 when measured by the in vitro motility assay on isolated and reconstituted proteins (Song et al., 2011). The value we report is less (ΔpCa50=+0.05-0.09), because of the presence of 8 mM Pi which makes ΔpCa50 smaller (Wang et al., 2013). 8 mM Pi is close to the Pi concentration in working cardiomyocytes (Opie et al., 1971; Roth et al., 1989). It is likely that an increase in ΔpCa50 may have been caused by the absence of Pi, which does not accurately reflect the conditions under which cardiomyocytes function. The observations of (Song et al., 2013) that the kinetic constants kACT and kTR do not change with the mutation, may appear to be consistent with our observation that the rate constants of elementary steps of the cross-bridge cycle (k2, k−2, k4, and k−4) do not change significantly with the mutation (Figs. 5B, C and Fig. 8A, B), although it is likely that different properties of the contractile apparatus were measured by these different methods as we reported earlier (Wang & Kawai, 2013).
The paper by Rowlands et al. (Rowlands et al., 2017) used the same Tg mouse line ACTC E99K, but its scope and approach were completely different from the current investigation. This mouse model has a high rate of sudden cardiac death (SCD) at early ages (<45 days postnatal) (Song et al., 2011), and Rowlands et al. investigated its cause by studying Ca2+ transients released from the sarcoplasmic reticulum. Our current investigation is based on older ACTC E99K mice which did not experience SCD, and we investigated how the ability of force generation is impaired by harboring a mutant protein.
Limitations of sinusoidal analysis method
If the amplitude of length change (ΔL) in sinusoidal analysis method exceeds 0.4%, nonlinearity in force response increases, hence its interpretation becomes more complex. At sarcomere length 2.2 μm, 0.4% ΔL corresponds to 4.4 nm/half sarcomere, which corresponds to 2.2 nm/cross-bridge if 50% of series compliance is considered (Huxley et al., 1994; Wakabayashi et al., 1994; Kawai, 2003). If ΔL exceeds the step size of cross-bridges (5-10 nm), they have to cycle many times and are limited by the slowest step, which is step 6, hence this method (large ΔL) cannot detect faster elementary steps, such as steps 1-5 in Scheme 1. Because we limit the length change to ±0.125%, which corresponds to ±1.4 nm/half sarcomere and ±0.7 nm/cross-bridge, our method is capable of characterizing the fast elementary steps of the cross-bridge cycle. Our method does not have a problem of competitive inhibition, such as experienced with caged ATP (Thirlwell et al., 1994; Thirlwell et al., 1995), and it can investigate much larger concentration range of Pi (0-30 mM, Fig. 7) than that used for the caged Pi method, which releases a maximum of ~3 mM Pi by a photolysis of caged Pi (Dantzig et al., 1992). The interpretation of the results in terms of Scheme 1 is the straight forward and the simplest of all interpretations. It would be possible to construct more complex cross-bridge models with more states, but we believe that we do not gain much by trying such efforts.
Conclusion
We conclude that decreased force generated by cross-bridges is the primary consequence of the ACTC E99K mutation, causing decreased active force that eventually results in AHCM. This change is accompanied with abnormalities in cross-bridge functions including decreased medium rate constant 2πb, increased ATP and ADP association constants, increased fast rate constant 2πc and increased pCa50. We observed that these changes develop with age in Tg animals.
Acknowledgments
The authors would like to thank Professor Steven Marston (National Heart and Lung Institute, Imperial College London, London, UK) who developed the Tg mouse model ACTC E99K and made our collaboration possible. This work was supported by grants from the Natural Science Foundation of Jiangsu Province of China BK20150353 (LW), the National Institutes of Health HL070041 (MK), and The American Heart Association 13GRNT16810043 (MK). The content is solely the responsibility of the authors and does not necessarily reflect the official views of the funding organizations.
Abbreviations
- 2πb
Apparent rate constant of the delayed tension (exponential process B)
- 2πc
Apparent rate constant of fast tension recovery (exponential process C)
- ACTC
actin gene
- AHCM
apical HCM
- B
Magnitude of exponential process B
- C
Magnitude of exponential process C
- CK
creatine kinase
- D
MgADP or its concentration
- E99K
Glu-99-Lys
- f
Frequency of length oscillation
- HCM
hypertrophic cardiomyopathy
- K0
MgADP association constant
- K1
MgATP association constant
- k2
Rate constant of the cross-bridge detachment step 2
- k−2
Rate constant of the reversal of step 2
- K2
Equilibrium constant of step 2 (=k2/k−2)
- k4
Rate constant of force generation step 4 (isomerization of the AM.ADP.Pi state)
- k−4
Rate constant of the reversal of step 4
- K4
Equilibrium constant of step 4 (=k4/k−4)
- K5
Phosphate association constant
- kTR
the rate of tension redevelopment
- LV
left ventricle
- nH
Cooperativity
- NTg
non-transgenic
- P
Pi or its concentration
- PCr
phosphocreatine
- pCa50
Ca2+ sensitivity
- RV
right ventricle
- S
MgATP or its concentration
- SCD
sudden cardiac death
- T5
Tension per cross-bridge supported by the AM*ADP.Pi state
- Y(f)
Complex modulus
- ΔL
length change
Footnotes
Disclosures
No potential conflict of interest.
References
- AHA. Heart Disease and Stroke Statistics. American Heart Association; 2009. [Google Scholar]
- Bai F, Caster HM, Dawson JF, Kawai M. The immediate effect of HCM causing actin mutants E99K and A230V on actin-Tm-myosin interaction in thin-filament reconstituted myocardium. J Mol Cell Cardiol. 2015;79C:123–132. doi: 10.1016/j.yjmcc.2014.10.014. [DOI] [PubMed] [Google Scholar]
- Behrmann E, Muller M, Penczek PA, Mannherz HG, Manstein DJ, Raunser S. Structure of the rigor actin-tropomyosin-myosin complex. Cell. 2012;150:327–338. doi: 10.1016/j.cell.2012.05.037. [DOI] [PMC free article] [PubMed] [Google Scholar]
- Bookwalter CS, Trybus KM. Functional consequences of a mutation in an expressed human a-cardiac actin at a site implicated in familial hypertrophic cardiomyopathy. J Biol Chem. 2006;281:16777–16784. doi: 10.1074/jbc.M512935200. [DOI] [PubMed] [Google Scholar]
- Bremel RD, Weber A. Cooperation within actin filament in vertebrate skeletal muscle. Nat New Biol. 1972;238:97–101. doi: 10.1038/newbio238097a0. [DOI] [PubMed] [Google Scholar]
- D’Andrea A, Caso P, Bossone E, Scarafile R, Riegler L, Di Salvo G, Gravino R, Cocchia R, Castaldo F, Salerno G, Golia E, Limongelli G, De Corato G, Cuomo S, Pacileo G, Russo MG, Calabro R. Right ventricular myocardial involvement in either physiological or pathological left ventricular hypertrophy: an ultrasound speckle-tracking two-dimensional strain analysis. European journal of echocardiography : the journal of the Working Group on Echocardiography of the European Society of Cardiology. 2010;11:492–500. doi: 10.1093/ejechocard/jeq007. [DOI] [PubMed] [Google Scholar]
- Dahari M, Dawson JF. Do cardiac actin mutations lead to altered actomyosin interactions? Biochem Cell Biol. 2015;93:330–334. doi: 10.1139/bcb-2014-0156. [DOI] [PubMed] [Google Scholar]
- Dantzig J, Goldman Y, Millar NC, Lacktis J, Homsher E. Reversal of the cross-bridge force-generating transition by the photogeneration of phosphate in rabbit psoas muscle fibers. J Physiol. 1992;451:247–278. doi: 10.1113/jphysiol.1992.sp019163. [DOI] [PMC free article] [PubMed] [Google Scholar]
- Durrwang U, Fujita-Becker S, Erent M, Kull FJ, Tsiavaliaris G, Geeves MA, Manstein DJ. Dictyostelium myosin-IE is a fast molecular motor involved in phagocytosis. J CellSci. 2006;119:550–558. doi: 10.1242/jcs.02774. [DOI] [PubMed] [Google Scholar]
- Force T, Bonow RO, Houser SR, Solaro RJ, Hershberger RE, Adhikari B, Anderson ME, Boineau R, Byrne BJ, Cappola TP, Kalluri R, LeWinter MM, Maron MS, Molkentin JD, Ommen SR, Regnier M, Tang WH, Tian R, Konstam MA, Maron BJ, Seidman CE. Research priorities in hypertrophic cardiomyopathy: report of a Working Group of the National Heart, Lung, and Blood Institute. Circulation. 2010;122:1130–1133. doi: 10.1161/CIRCULATIONAHA.110.950089. [DOI] [PMC free article] [PubMed] [Google Scholar]
- Fortune NS, Geeves MA, Ranatunga KW. Tension responses to rapid pressure release in glycerinated rabbit muscle fibers. Proc Natl Acad Sci (USA) 1991;88:7323–7327. doi: 10.1073/pnas.88.16.7323. [DOI] [PMC free article] [PubMed] [Google Scholar]
- Furch M, Geeves MA, Manstein DJ. Modulation of actin affinity and actomyosin adenosine triphosphatase by charge changes in the myosin motor domain. Biochemistry. 1998;37:6317–6326. doi: 10.1021/bi972851y. [DOI] [PubMed] [Google Scholar]
- Geeves MA, Holmes KC. Structural mechanism of muscle contraction. Ann Rev Biochem. 1999;68:687–728. doi: 10.1146/annurev.biochem.68.1.687. [DOI] [PubMed] [Google Scholar]
- Holmes KC, Schroder RR, Sweeney HL, Houdusse A. The structure of the rigor complex and its implications for the power stroke. Philos Trans R Soc Lond B Biol Sci. 2004;359:1819–1828. doi: 10.1098/rstb.2004.1566. [DOI] [PMC free article] [PubMed] [Google Scholar]
- Huxley HE, Stewart A, Sosa H, Irving T. X-ray diffraction measurements of the extensibility of actin and myosin filaments in contracting muscle. Biophys J. 1994;67:2411–2421. doi: 10.1016/S0006-3495(94)80728-3. [DOI] [PMC free article] [PubMed] [Google Scholar]
- Kaski JP, Syrris P, Esteban MT, Jenkins S, Pantazis A, Deanfield JE, McKenna WJ, Elliott PM. Prevalence of sarcomere protein gene mutations in preadolescent children with hypertrophic cardiomyopathy. Circulation Cardiovascular genetics. 2009;2:436–441. doi: 10.1161/CIRCGENETICS.108.821314. [DOI] [PubMed] [Google Scholar]
- Kawai M. What do we learn by studying the temperature effect on isometric tension and tension transients in mammalian striated muscle fibres? J Muscle Res Cell Motil. 2003;24:127–138. doi: 10.1023/a:1026093212111. [DOI] [PubMed] [Google Scholar]
- Kawai M, Brandt PW. Sinusoidal analysis: a high resolution method for correlating biochemical reactions with physiological processes in activated skeletal muscles of rabbit, frog and crayfish. J Muscle Res Cell Mot. 1980;1:279–303. doi: 10.1007/BF00711932. [DOI] [PubMed] [Google Scholar]
- Kawai M, Halvorson H. Role of MgATP and MgADP in the crossbridge kinetics in chemically skinned rabbit psoas fibers. Study of a fast exponential process C. Biophys J. 1989;55:595–603. doi: 10.1016/S0006-3495(89)82857-7. [DOI] [PMC free article] [PubMed] [Google Scholar]
- Kawai M, Halvorson HR. Two step mechanism of phosphate release and the mechanism of force generation in chemically skinned fibers of rabbit psoas. Biophys J. 1991;59:329–342. doi: 10.1016/S0006-3495(91)82227-5. [DOI] [PMC free article] [PubMed] [Google Scholar]
- Kawai M, Saeki Y, Zhao Y. Cross-bridge scheme and the kinetic constants of elementary steps deduced from chemically skinned papillary and trabecular muscles of the ferret. Circ Res. 1993;73:35–50. doi: 10.1161/01.res.73.1.35. [DOI] [PubMed] [Google Scholar]
- Kawai M, Zhao Y. Cross-bridge scheme and force per cross-bridge state in skinned rabbit psoas muscle fibers. Biophys J. 1993;65:638–651. doi: 10.1016/S0006-3495(93)81109-3. [DOI] [PMC free article] [PubMed] [Google Scholar]
- Lorenz M, Holmes KC. The actin-myosin interface. Proc Natl Acad Sci U S A. 2010;107:12529–12534. doi: 10.1073/pnas.1003604107. [DOI] [PMC free article] [PubMed] [Google Scholar]
- Lu X, Bryant MK, Bryan KE, Rubenstein PA, Kawai M. Role of the N-terminal negative charges of actin in force generation and cross-bridge kinetics in reconstituted bovine cardiac muscle fibres. J Physiol. 2005;564:65–82. doi: 10.1113/jphysiol.2004.078055. [DOI] [PMC free article] [PubMed] [Google Scholar]
- Marston SB. How do mutations in contractile proteins cause the primary familial cardiomyopathies? J Cardiovasc Transl Res. 2011;4:245–255. doi: 10.1007/s12265-011-9266-2. [DOI] [PubMed] [Google Scholar]
- Miller CJ, Wong WW, Bobkova E, Rubenstein PA, Reisler E. Mutational analysis of the role of the N terminus of actin in actomyosin interactions. Comparison with other mutant actins and implications for the cross-bridge cycle. Biochemistry. 1996;35:16557–16565. doi: 10.1021/bi962388+. [DOI] [PubMed] [Google Scholar]
- Mogensen J, Klausen IC, Pedersen AK, Egeblad H, Bross P, Kruse TA, Gregersen N, Hansen PS, Baandrup U, Borglum AD. Alpha-cardiac actin is a novel disease gene in familial hypertrophic cardiomyopathy. J Clin Invest. 1999;103:R39–43. doi: 10.1172/JCI6460. [DOI] [PMC free article] [PubMed] [Google Scholar]
- Mogensen J, Perrot A, Andersen PS, Havndrup O, Klausen IC, Christiansen M, Bross P, Egeblad H, Bundgaard H, Osterziel KJ, Haltern G, Lapp H, Reinecke P, Gregersen N, Borglum AD. Clinical and genetic characteristics of alpha cardiac actin gene mutations in hypertrophic cardiomyopathy. J Med Genet. 2004;41:e10. doi: 10.1136/jmg.2003.010447. [DOI] [PMC free article] [PubMed] [Google Scholar]
- Mozaffarian D, Caldwell JH. Right ventricular involvement in hypertrophic cardiomyopathy: a case report and literature review. Clinical cardiology. 2001;24:2–8. doi: 10.1002/clc.4960240102. [DOI] [PMC free article] [PubMed] [Google Scholar]
- Mundia MM, Demers RW, Chow ML, Perieteanu AA, Dawson JF. Subdomain location of mutations in cardiac actin correlate with type of functional change. PLoS One. 2012;7:e36821. doi: 10.1371/journal.pone.0036821. [DOI] [PMC free article] [PubMed] [Google Scholar]
- Murphy KP, Zhao Y, Kawai M. Molecular forces involved in force generation during skeletal muscle contraction. J Exp Biol. 1996;199:2565–2571. doi: 10.1242/jeb.199.12.2565. [DOI] [PubMed] [Google Scholar]
- Nowak KJ, Ravenscroft G, Jackaman C, Filipovska A, Davies SM, Lim EM, Squire SE, Potter AC, Baker E, Clément S, Sewry CA, Fabian V, Crawford K, Lessard JL, Griffiths LM, Papadimitriou JM, Shen Y, Morahan G, Bakker AJ, Davies KE, Laing NG. Rescue of skeletal muscle α-actin–null mice by cardiac (fetal) α-actin. J Cell Biol. 2009;185:903–915. doi: 10.1083/jcb.200812132. [DOI] [PMC free article] [PubMed] [Google Scholar]
- Olson TM, Doan TP, Kishimoto NY, Whitby FG, Ackerman MJ, Fananapazir L. Inherited and de novo mutations in the cardiac actin gene cause familial hypertrophic cardiomyopathy. J Mol Cell Cardiol. 2000;32:1687–1694. doi: 10.1006/jmcc.2000.1204. [DOI] [PubMed] [Google Scholar]
- Olson TM, Michels VV, Thibodeau SN, Tai YS, Keating MT. Actin mutations in dilated cardiomyopathy, a heritable form of heart failure. Science. 1998;280:750–752. doi: 10.1126/science.280.5364.750. [DOI] [PubMed] [Google Scholar]
- Opie LH, Mansford KR, Owen P. Effects of increased heart work on glycolysis and adenine nucleotides in the perfused heart of normal and diabetic rats. Biochem J. 1971;124:475–490. doi: 10.1042/bj1240475. [DOI] [PMC free article] [PubMed] [Google Scholar]
- Perhonen MA, Franco F, Lane LD, Buckey JC, Blomqvist CG, Zerwekh JE, Peshock RM, Weatherall PT, Levine BD. Cardiac atrophy after bed rest and spaceflight. Journal of applied physiology. 2001;91:645–653. doi: 10.1152/jappl.2001.91.2.645. [DOI] [PubMed] [Google Scholar]
- Rall JA, Woledge RC. Influence of temperature on mechanics and energetics of muscle contraction. Am J Physiol. 1990;259:R197–203. doi: 10.1152/ajpregu.1990.259.2.R197. [DOI] [PubMed] [Google Scholar]
- Rayment I, Holden HM, Whittaker M, Yohn CB, Lorenz M, Holmes KC, Milligan RA. Structure of the actin-myosin complex and its implications for muscle contraction. Science. 1993;261:58–65. doi: 10.1126/science.8316858. [DOI] [PubMed] [Google Scholar]
- Roth K, Hubesch B, Meyerhoff DJ, Naruse S, Gober JR, Lawry TJ, Boska MD, Matson GB, Weiner MW. Noninvasive quantitation of phosphorus metabolites in human tissue by NMR spectroscopy. J of Magnetic Resonance. 1989;81:299–311. [Google Scholar]
- Rowlands CT, Owen T, Lawal S, Cao S, Pandey SP, Yang H-Y, Song W, Wilkinson R, Alvarez-Laviada A, Gehmlich K, Marston SB, MacLeod KT. Age- and strain-related aberrant Ca2+ release is associated with sudden cardiac death in the ACTC E99K mouse model of hypertrophic cardiomyopathy. Am J Physiol Heart Circ Physiol. 2017;313:H1213–H1226. doi: 10.1152/ajpheart.00244.2017. [DOI] [PMC free article] [PubMed] [Google Scholar]
- Schober KE, Savino SI, Yildiz V. Right ventricular involvement in feline hypertrophic cardiomyopathy. Journal of veterinary cardiology: the official journal of the European Society of Veterinary Cardiology. 2016;18:297–309. doi: 10.1016/j.jvc.2016.08.001. [DOI] [PubMed] [Google Scholar]
- Seidman CE, Seidman JG. Identifying sarcomere gene mutations in hypertrophic cardiomyopathy: a personal history. Circ Res. 2011;108:743–750. doi: 10.1161/CIRCRESAHA.110.223834. [DOI] [PMC free article] [PubMed] [Google Scholar]
- Semsarian C, Ingles J, Maron MS, Maron BJ. New perspectives on the prevalence of hypertrophic cardiomyopathy. J Am Coll Cardiol. 2015;65:1249–1254. doi: 10.1016/j.jacc.2015.01.019. [DOI] [PubMed] [Google Scholar]
- Song W, Dyer E, Stuckey DJ, Copeland O, Leung MC, Bayliss C, Messer A, Wilkinson R, Tremoleda JL, Schneider MD, Harding SE, Redwood CS, Clarke K, Nowak K, Monserrat L, Wells D, Marston SB. Molecular mechanism of the E99K mutation in cardiac actin (ACTC Gene) that causes apical hypertrophy in man and mouse. J Biol Chem. 2011;286:27582–27593. doi: 10.1074/jbc.M111.252320. [DOI] [PMC free article] [PubMed] [Google Scholar]
- Song W, Vikhorev PG, Kashyap MN, Rowlands C, Ferenczi MA, Woledge RC, MacLeod K, Marston S, Curtin NA. Mechanical and energetic properties of papillary muscle from ACTC E99K transgenic mouse models of hypertrophic cardiomyopathy. Am J Physiol Heart Circ Physiol. 2013;304:H1513–1524. doi: 10.1152/ajpheart.00951.2012. [DOI] [PMC free article] [PubMed] [Google Scholar]
- Sutoh K. Mapping of actin-binding sites on the heavy chain of myosin subfragment 1. Biochemistry. 1983;22:1579–1585. doi: 10.1021/bi00276a009. [DOI] [PubMed] [Google Scholar]
- Taylor EW. Mechanism of actomyosin ATPase and the problem of muscle contraction. CRC Crit Rev Biochem. 1979;6:103–164. doi: 10.3109/10409237909102562. [DOI] [PubMed] [Google Scholar]
- Thirlwell H, Corrie JE, Reid GP, Trentham DR, Ferenczi MA. Kinetics of relaxation from rigor of permeabilized fast-twitch skeletal fibers from the rabbit using a novel caged ATP and apyrase. Biophys J. 1994;67:2436–2447. doi: 10.1016/S0006-3495(94)80730-1. [DOI] [PMC free article] [PubMed] [Google Scholar]
- Thirlwell H, Sleep JA, Ferenczi MA. Inhibition of unloaded shortening velocity in permeabilized muscle fibres by caged ATP compounds. J Muscle Res Cell Motil. 1995;16:131–137. doi: 10.1007/BF00122531. [DOI] [PubMed] [Google Scholar]
- Van Driest SL, Ellsworth EG, Ommen SR, Tajik AJ, Gersh BJ, Ackerman MJ. Prevalence and spectrum of thin filament mutations in an outpatient referral population with hypertrophic cardiomyopathy. Circulation. 2003;108:445–451. doi: 10.1161/01.CIR.0000080896.52003.DF. [DOI] [PubMed] [Google Scholar]
- Vandekerckhove J, Bugaisky G, Buckingham M. Simultaneous expression of skeletal muscle and heart actin proteins in various striated muscle tissues and cells. A quantitative determination of the two actin isoforms. J Biol Chem. 1986;261:1838–1843. [PubMed] [Google Scholar]
- Wakabayashi K, Sugimoto Y, Tanaka H, Ueno Y, Takezawa Y, Amemiya Y. X-ray diffraction evidence for the extensibility of actin and myosin filaments during muscle contraction. Biophys J. 1994;67:2422–2435. doi: 10.1016/S0006-3495(94)80729-5. [DOI] [PMC free article] [PubMed] [Google Scholar]
- Wang G, Ding W, Kawai M. Does thin filament compliance diminish the cross-bridge kinetics? A study in rabbit psoas fibers. Biophys J. 1999;76:978–984. doi: 10.1016/S0006-3495(99)77261-9. [DOI] [PMC free article] [PubMed] [Google Scholar]
- Wang L, Bahadir A, Kawai M. High ionic strength depresses muscle contractility by decreasing both force per cross-bridge and the number of strongly attached cross-bridges. J Muscle Res Cell Motil. 2015;36:227–241. doi: 10.1007/s10974-015-9412-6. [DOI] [PMC free article] [PubMed] [Google Scholar]
- Wang L, Kawai M. A re-interpretation of the rate of tension redevelopment (kTR) in active muscle. J Muscle Res Cell Motil. 2013;34:407–415. doi: 10.1007/s10974-013-9366-5. [DOI] [PMC free article] [PubMed] [Google Scholar]
- Wang L, Muthu P, Szczesna-Cordary D, Kawai M. Diversity and Similarity of Motor Function and Cross-Bridge Kinetics in Papillary Muscles of Transgenic Mice Carrying Myosin Regulatory Light Chain Mutations D166Vand R58Q. J Mol Cell Cardiol. 2013;62:153–163. doi: 10.1016/j.yjmcc.2013.05.012. [DOI] [PMC free article] [PubMed] [Google Scholar]
- Wang L, Sadayappan S, Kawai M. Cardiac myosin binding protein C phosphorylation affects cross-bridge cycle’s elementary steps in a site-specific manner. Pros One. 2014;0113417:1–21. doi: 10.1371/journal.pone.0113417. [DOI] [PMC free article] [PubMed] [Google Scholar]
- Wannenburg T, Heijne GH, Geerdink JH, Van-Den-Dool HW, Janssen PM, DeTombe PP. Cross-bridge kinetics in rat myocardium: effect of sarcomere length and calcium activation. Am J Physiol. 2000;279:H779–H790. doi: 10.1152/ajpheart.2000.279.2.H779. [DOI] [PubMed] [Google Scholar]
- Zhao Y, Kawai M. Kinetic and Thermodynamic studies of the cross-bridge cycle in rabbit psoas muscle fibers. Biophys J. 1994;67:1655–1668. doi: 10.1016/S0006-3495(94)80638-1. [DOI] [PMC free article] [PubMed] [Google Scholar]
- Zhao Y, Swamy PMG, Humphries KA, Kawai M. The effect of partial extraction of troponin C on the elementary steps of the cross-bridge cycle in rabbit psoas fibers. Biophys J. 1996;71:2759–2773. doi: 10.1016/S0006-3495(96)79469-9. [DOI] [PMC free article] [PubMed] [Google Scholar]


