

Kim et al. define a crucial role of the transcription factor Maf in myelination and cholesterol biosynthesis and show that Maf acts downstream from Neuregulin1 in myelinating Schwann cells.
Keywords: Schwann cell, myelination, Maf, Neuregulin1, cholesterol
Abstract
Cholesterol is a major constituent of myelin membranes, which insulate axons and allow saltatory conduction. Therefore, Schwann cells, the myelinating glia of the peripheral nervous system, need to produce large amounts of cholesterol. Here, we define a crucial role of the transcription factor Maf in myelination and cholesterol biosynthesis and show that Maf acts downstream from Neuregulin1 (Nrg1). Maf expression is induced when Schwann cells begin myelination. Genetic ablation of Maf resulted in hypomyelination that resembled mice with defective Nrg1 signaling. Importantly, loss of Maf or Nrg1 signaling resulted in a down-regulation of the cholesterol synthesis program, and Maf directly binds to enhancers of cholesterol synthesis genes. Furthermore, we identified the molecular mechanisms by which Nrg1 signaling regulates Maf levels. Transcription of Maf depends on calmodulin-dependent kinases downstream from Nrg1, whereas Nrg1–MAPK signaling stabilizes Maf protein. Our results delineate a novel signaling cascade regulating cholesterol synthesis in myelinating Schwann cells.
Axons of neurons must be insulated for efficient transmission of electrical impulses. Fast saltatory conduction of electrical impulses relies on the presence of myelin, which is produced by Schwann cells and oligodendrocytes in the peripheral and central nervous system, respectively. Impaired myelination in humans can lead to devastating pathologies, underscoring the importance of myelin in nervous system function. Myelin membranes have a very high lipid content, among which the most abundant is cholesterol. Schwann cells rely heavily on de novo cholesterol synthesis rather than its uptake from the circulation (Jurevics and Morell 1994). Accordingly, mice with an impaired ability to produce cholesterol fail to myelinate or produce thin myelin sheaths; e.g., mice with ablation of SCAP or genes encoding cholesterol biosynthesis enzymes (Saher et al. 2005; Verheijen et al. 2009). Cholesterol synthesis is tightly regulated in most cell types, but how Schwann cells or oligodendrocytes meet the high demands for cholesterol synthesis required for myelination is an open question.
Schwann cells derive from migrating neural crest cells (Jessen and Mirsky 2005). Schwann cell precursors migrate along the axons of peripheral neurons and are demarcated by expression of the transcription factor Sox10 and the tyrosine kinase receptor ErbB3 (Meyer et al. 1997; Britsch et al. 2001). They become immature Schwann cells around embryonic days 15–16 (E15–E16) in mice, when they sort out axons based on their diameter to establish a 1:1 relationship with large-diameter axons. Myelination begins around birth and depends on the transcription factors Oct-6, Pou3f2 (Brn2), and Egr2 (Jessen and Mirsky 2005; Svaren and Meijer 2008; Stolt and Wegner 2016). Axonal signals provided by Neuregulin1 (Nrg1) as well as crucial cues from the extracellular matrix mediated by integrin and G-protein-coupled receptors control entry into the terminal Schwann cell differentiation program (Chernousov et al. 2008; Newbern and Birchmeier 2010; Herbert and Monk 2017).
Nrg1 signals govern many aspects of Schwann cell development (Newbern and Birchmeier 2010). During early stages, Nrg1 signals ensure Schwann cell proliferation and migration along the axonal tract (Meyer and Birchmeier 1995; Lyons et al. 2005). Subsequently, Nrg1 is essential for their entry into the myelination program (Taveggia et al. 2005; Kao et al. 2009) and, finally, is needed during myelination to ensure that the appropriate myelin thickness is achieved (Garratt et al. 2000; Michailov et al. 2004). A particular isoform, Nrg1 type III, drives Schwann cell development during these different stages (Meyer et al. 1997; Michailov et al. 2004). Nrg1 type III is neuronally produced and axonally presented and depends on Bace1-dependent cleavage for its full function (Leimeroth et al. 2002; Willem et al. 2006). Nrg1 signaling occurs via ErbB2 and ErbB3 receptor heterodimers present in Schwann cells. Upon Nrg1 binding, the tyrosine kinase of the ErbB2/3 heterodimer is activated and phosphorylates receptors and other downstream molecules. This creates docking sites for downstream signaling components, which activate signaling pathways such as MAPK, AKT, and JAK/STAT and participate in Ca2+-dependent signaling (Newbern and Birchmeier 2010).
It is poorly understood how the same signaling system can regulate the many different steps of Schwann cell development and result in stage-specific and biologically different outcomes. The key to understanding this would be to identify the downstream targets of the Nrg1–ErbB2/3 pathway that mediate each step of Schwann cell development. Nrg1-dependent activation of NFAT and YY1 induces Egr2 expression and has been implicated in the initiation of the myelination program and in differentiation of promyelinating cells (Kao et al. 2009; He et al. 2010). Once myelination begins, Nrg1 signaling activity determines myelin thickness in a dose-dependent manner (Michailov et al. 2004). For instance, when ErbB2 is ablated using an Egr2 promoter-driven Cre after myelination has begun, thin myelin is formed (Garratt et al. 2000). The MAPK pathway downstream from ErbB2 promotes the translation efficacy of myelin proteins and thereby supports myelination (Sheean et al. 2014). The AKT pathway and its downstream component, mTOR, also promote the production of myelin proteins and cholesterol (Sherman et al. 2012; Norrmen et al. 2014; Domenech-Estevez et al. 2016). However, how Nrg1 coordinates myelin protein production with cholesterol synthesis is ill defined.
Maf is a member of the MAF family of bZIP transcription factors, which either activate or repress target genes (Blank and Andrews 1997). Maf has been implicated in diverse developmental processes and controls differentiation of the lens, hematopoietic cells, and touch-sensitive sensory neurons (Ho et al. 1996; Kim et al. 1999; Wende et al. 2012). However, the role of Maf in Schwann cells has not been studied. While investigating the expression pattern of Maf in the developing peripheral nervous system, we noticed a robust induction of Maf in myelinating Schwann cells. Loss of Maf in myelinating Schwann cells through cell type-specific genetic ablation resulted in the formation of thin myelin. Transcriptome analysis showed that Maf is required for the maximal expression of cholesterol synthesis genes, a rate-limiting step in myelination. This overlaps with the changes in gene expression observed when ErbB2 is ablated in myelinating Schwann cells. Interestingly, we observed that Nrg1–ErbB signals positively regulate Maf through both transcriptional and post-transcriptional mechanisms.
Results
Maf is expressed in myelinating Schwann cells
We first investigated the expression pattern of Maf in developing peripheral nerves. Maf is absent in sciatic nerve tissue at E16 but is detectable at E18 and thereafter (Fig. 1A). Maf-positive cells were in close contact with axons marked by Nf-200, suggesting that Maf is expressed in Schwann cells. RT-qPCR analysis of sciatic nerve tissue from different developmental stages showed that Maf mRNA is robustly induced after E16 and reaches a plateau at postnatal day 10 (P10) (Fig. 1B). Thus, Maf expression mirrors that of myelin basic protein (MBP), a component of myelin. These findings suggest that Maf expression is initiated when Schwann cells begin to myelinate. Next, we performed coimmunostaining with Egr2, a transcription factor that is expressed in myelinating Schwann cells. In adult sciatic nerve tissue, Maf was detected in most Egr2-positive cells (94% ± 0.68% of all Egr2+ cells were Maf+) (Fig. 1C, arrows). Consistent with previous reports (Nakamura et al. 2009), Maf was also present in F4/80-positive macrophages present in the nerves (95% ± 0.76% of all F4/80+ cells were Maf+) (Fig. 1C, arrowheads). Conversely, <1% of all Maf+ cells did not express either Egr2 or F4/80. In teased adult fiber preparation from MafLacZ/+ mice (LacZ is driven by the Maf locus), we confirmed that β-galactosidase, the protein product of the LacZ gene, was not produced in L1-positive nonmyelinating Schwann cells (Fig. 1D). Whole-mount X-gal staining of spinal cords revealed that β-galactosidase-expressing cells do not accompany sensory projections once they enter the central nervous system, indicating that Maf is not present in oligodendrocytes (Supplemental Fig. S1). Taken together, we conclude that Maf expression is specifically initiated during myelination but is not present in nonmyelinating Schwann cells or oligodendrocytes. These results implicate Maf in Schwann cell myelination.
Figure 1.
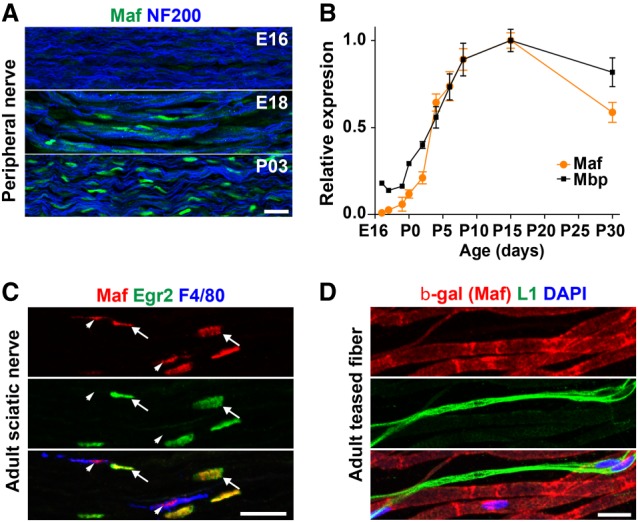
Maf is expressed in myelinating Schwann cells. (A) Immunohistological analysis of murine sciatic nerves of the indicated ages using anti-Maf and anti-Nf-200 antibodies. (B) Time course of Maf and Mbp mRNA expression during myelination. Levels of Maf and Mbp mRNAs were measured by RT-qPCR, and the levels at P15 were taken as 1. n = 3. Error bars indicate SEM. (C) Immunohistological analysis of the adult sciatic nerve demonstrates that Maf is expressed in Egr2+ myelinating Schwann cells (arrows) and F4/80 positive macrophages (arrowheads). (D) Teased nerve fibers of MafLacZ/+ mice show that β-galactosidase is absent in nonmyelinating L1+ Schwann cells. Bars, 20 µm.
Loss of Maf impairs myelin growth and reduces axon conduction velocity
To investigate the function of Maf in myelinating Schwann cells, we ablated Maf specifically using the Egr2-Cre allele (Mafflox/flox; Egr2-Cre; referred to here as ΔMaf). Egr2, Maf, and F4/80 coimmunostaining at P8 confirmed an efficient ablation of Maf in Schwann cells but not macrophages (Supplemental Fig. S2). When we examined the sciatic nerve at P8 by electron microscopy, myelin sheaths of control and ΔMaf mice appeared similar (Fig. 2A–C). However, while the thickness of the myelin sheaths grew robustly in control mice, those of ΔMaf mice grew poorly and were very thin at P30 (Fig. 2D–F). In addition, at P90, myelin was thin in the sciatic and femoralis nerves of ΔMaf mice (Fig. 2G–I; Supplemental Fig. S3A–C). Quantification showed that the myelin sheaths of small-diameter axons were less affected than those of large-diameter axons (Fig. 2F,I). When Dhh-Cre was used to recombine the Maf locus at the Schwann cell precursor stage, an identical phenotype was observed (Supplemental Fig. S3D–F). Therefore, Maf is dispensable for the early steps of Schwann cell development and the entry into myelination but is specifically required during myelin growth. Furthermore, internodal distances were reduced in ΔMaf mice (Fig. 2J). Nonmyelinated axons were unaffected, and the number per remark bundle was unchanged (Supplemental Fig. S3G). In addition, ΔMaf mice often displayed local areas of excessively thick myelin called tomaculae (Fig. 2K; Supplemental Fig. S3H). These abnormal myelin structures are often associated with myelin disorders in both mice and humans (Adlkofer et al. 1995; Sander et al. 2000). One mechanism known to induce tomaculae formation is aberrant AKT activation (Goebbels et al. 2012; Domenech-Estevez et al. 2016), but AKT activity was unchanged in the peripheral nerves of ΔMaf mutants (Supplemental Fig. S3I).
Figure 2.

Ablation of Maf in myelinating Schwann cells causes hypomyelination. (A–C) Electron microscopy analysis of sciatic nerves from wild-type or ΔMaf mice and quantification of myelin thickness at P8. n = 3. (D–F) Same as A–C at P30. n = 3. (G–I) Same as A–C at P90. n = 3. (J) Quantification of internodal distances at P90. n = 3. (K) Quantification of the frequency of tomaculae. n = 3. (L) ΔMaf mice have reduced axon conduction velocity. Conduction velocity was measured on the saphenous nerve of control and ΔMaf mice. n = 103 fibers from three control mice; n = 129 fibers from five ΔMaf mice. Bars, 1 µm. Error bars indicate SEM. For statistical analysis, unpaired two-tailed Student's t-test with 95% confidence interval was performed. (*) P < 0.05; (**) P < 0.01; (***) P < 0.001; (n.s.) nonsignificant.
Next, we performed single-fiber conduction velocity measurements on the saphenous nerve, a sensory branch of the sciatic nerve. Consistent with the hypomyelination phenotype, ΔMaf mice displayed more fibers with the slowest conduction velocities (0–5 m/sec) and fewer fibers with the fastest conduction velocities (15–20 m/sec) (Fig. 2L). Median conduction velocities were significantly different; i.e., 10.6 and 6.6 m/sec in control and ΔMaf mice, respectively (Mann-Whitney U-test P < 0.0002). We conclude that Maf is essential for normal myelination and optimal saltatory conduction of peripheral nerves.
Loss of Maf or Nrg1 signaling results in reduced cholesterol synthesis in Schwann cells
To understand the mechanisms underlying impaired myelin growth in ΔMaf mice, we assessed the transcriptome of Maf-deficient Schwann cells by microarray analysis. To exclude secondary effects, we used P8 nerves; i.e., a stage at which myelin grows but no histological change is yet apparent in ΔMaf mutants. Given that the loss of Nrg1 signaling in myelinating Schwann cells results in a similar phenotype (Garratt et al. 2000), we also obtained microarray data from conditional ErbB2 mutant mice at the same stage (ErbB2flox/flox; Egr2-Cre, referred to here as ΔErbB2). ErbB2 is an obligatory coreceptor for Nrg1 in Schwann cells and is therefore indispensable for Nrg1 signaling. Interestingly, many deregulated genes in ΔMaf mice were also deregulated in ΔErbB2, thus showing a tight positive correlation between ΔMaf and ΔErbB2 mice (Fig. 3A). Figure 3B shows a cluster analysis of differentially regulated genes that shows a large proportion of overlapping genes in the two mutants (clusters 1 and 4). In addition, genes in clusters 2 and 5 were also changed in both mutants but affected to very different extents. Importantly, many genes in cluster 1 (strongly down-regulated genes in both mutants) participate in cholesterol synthesis, including the rate-limiting enzymes Hmgcr and Fdft1 (Fig. 3C). Gene ontology (GO) analysis demonstrated a strong enrichment of cholesterol and lipid biosynthesis terms (Supplemental Fig. S4A). Deregulated expression of selected genes encoding cholesterol synthesis enzymes was verified by RT-qPCR and Western blotting at P8 (Fig. 3D,E). Unlike cholesterol synthesis genes, transcripts of key Schwann cell transcription factor genes such as Egr2 and Sox10 as well as genes encoding myelin proteins were unchanged (Supplemental Fig. S4B). The reduced expression of the majority of cholesterol biosynthesis genes persisted to P30, although Acss2 mRNA was no longer decreased at this late stage (Supplemental Fig. S4C).
Figure 3.
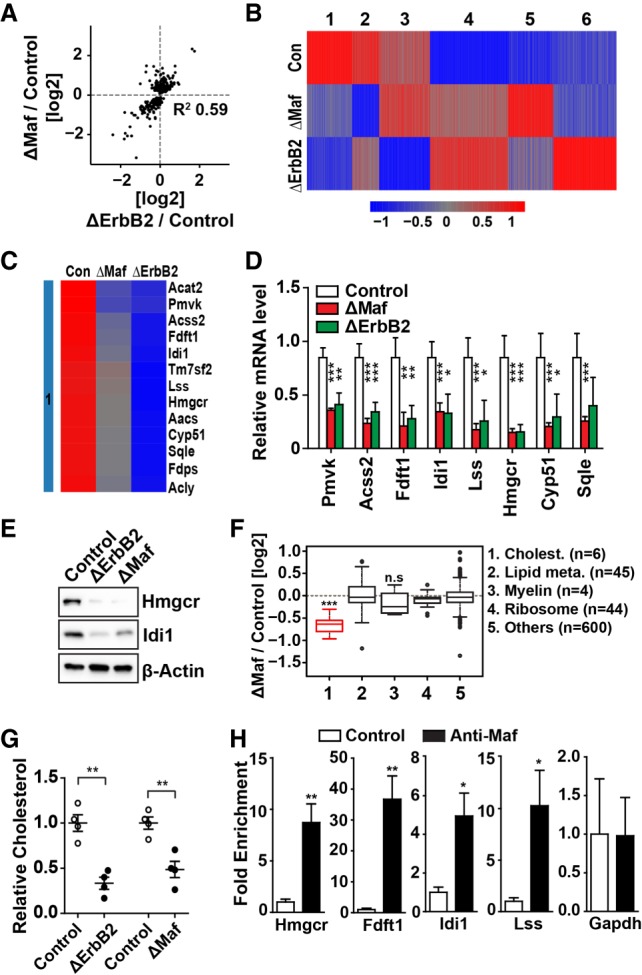
Loss of Maf or Nrg1 signaling impairs cholesterol synthesis in myelinating Schwann cells. (A) Correlation of transcript levels between ΔMaf and ΔErbB2 mutant mice. Only genes deregulated in ΔMaf mice were analyzed. (B) Cluster analysis of differentially regulated genes. (C) Heat map of cholesterol biosynthesis genes in cluster 1. (D) Validation of microarray results by RT-qPCR at P8. n > 6. (E) Validation of transcript analysis at the protein level at P8; the lysates analyzed are pools of nerves from three to four mice. (F) Box plot of the fold changes in new protein abundance in ΔMaf mutant mice as determined by in vivo pulse SILAC (stable isotope labeling by amino acids in cell culture) experiments. Identified proteins were classified into five categories: cholesterol biosynthesis proteins (Cholest.), lipid metabolism (Lipid Meta.), myelin, ribosomal proteins, and others. (n) The number of identified proteins in each group. Note that global protein production was unaffected, but cholesterol synthesis enzymes were produced at reduced levels in ΔMaf mutant mice. (***) P < 0.001 from a two-sided Wilcoxon rank-sum test (α = 0.05) (G) Cholesterol levels in ΔMaf or ΔErbB2 sciatic nerves at P15 were determined by gas chromatography-mass spectrometry (GC-MS). n = 4. (H) Maf binds to enhancers of genes encoding cholesterol biosynthesis enzymes. Macrophage-depleted P14 rat sciatic nerve tissues were analyzed by ChIP-qPCR (chromatin immunoprecipitation [ChIP] combined with quantitative PCR [qPCR]) using anti-Maf serum (n = 4); the promoter of Gapdh was used as negative control. All error bars indicate SEM. For all statistical analysis except in F, unpaired two-tailed Student's t-test with 95% confidence interval was performed. (*) P < 0.05; (**) P < 0.01; (***) P < 0.001; (n.s.) nonsignificant.
We reported previously that Nrg1 signaling in myelinating Schwann cells boosts global protein translation, thereby promoting the production of myelin proteins (Sheean et al. 2014). We compared global protein synthesis by in vivo pulse SILAC (stable isotope labeling by amino acids in cell culture) in the sciatic nerves of control and ΔMaf mice. This showed that global translation, including that of myelin proteins, was unaffected in ΔMaf mice (Fig. 3F). In contrast, production of all six proteins belonging to cholesterol biosynthesis pathway detected by mass spectrometry was markedly reduced in ΔMaf mice (Fig. 3F). New protein production correlated well with the change in mRNA levels, indicating that decreased mRNA levels caused the change in protein production (Supplemental Fig. S4D).
Next, we measured the amount of cholesterol in P15 sciatic nerve tissues by gas chromatography-mass spectrometry (GC-MS). Significantly reduced cholesterol levels were observed in the nerves of both ΔMaf and ΔErbB2 mice (Fig. 3G). Cholesterol is an essential and major constituent of the myelin sheath, suggesting that the down-regulation of cholesterol biosynthesis is an important aspect of the hypomyelination phenotype in ΔMaf and ΔErbB2 mice.
Maf binds to enhancer elements of cholesterol synthesis genes in vivo
We aimed to understand how Maf regulates the transcription of cholesterol synthesis genes. SREBP1/2 are the master regulators of genes involved in lipid and cholesterol biosynthesis (Brown and Goldstein 1997). However, our transcriptome data did not reveal any changes in SREBP1/2 mRNA levels, and sciatic nerve tissue from mutant mice had slightly higher amounts of the processed transcriptionally active SREBP1/2, which might be due to a compensatory mechanism (Supplemental Fig. S4E).
We then examined whether Maf directly binds to cis-regulatory elements of cholesterol synthesis genes. Previously published H3K27ac mapping data from rat sciatic nerve tissue were used to identify active enhancers that were used as candidates (Lopez-Anido et al. 2015). Since Maf is also expressed in macrophages, we depleted macrophages from digested sciatic nerve tissues using magnetic beads conjugated with an antibody against F4/80. RT-qPCR against F4/80 confirmed that >90% of macrophages were depleted by this procedure. We then performed chromatin immunoprecipitation (ChIP) using anti-Maf serum followed by qPCR. This showed an enrichment of Maf at a subset of enhancers, including enhancers associated with the genes encoding the rate-limiting enzymes Hmgcr and Fdft1 (Fig. 3H). In contrast, we did not observe enrichment of Maf at myelin genes (Supplemental Fig. S4F). These results suggest that Maf directly participates in the transcriptional regulation of cholesterol synthesis genes in Schwann cells.
Maf regulates expression of cholesterol biosynthesis genes in cultured Schwann cells
We wanted to directly test the role of Maf in inducing the expression of cholesterol biosynthesis genes in cultured Schwann cells. First, we overexpressed Maf in S16 cells, an immortalized rat Schwann cell line, by retroviral transduction. Cells were analyzed by RT-qPCR 3 d after infection. In addition, we also treated cells with methyl-β-cyclodextrin (MβCD), which depletes cellular cholesterol and thereby boosts de novo cholesterol synthesis, 24 h prior to harvest. We found that Maf overexpression alone in the absence of MβCD results in a weak but statistically significant up-regulation of cholesterol biosynthesis genes. When combined with MβCD, the effect of Maf overexpression was more pronounced (Fig. 4A). Therefore, Maf overexpression can enhance cholesterol biosynthesis, especially when cells are under high demand to synthesize large amounts of cholesterol.
Figure 4.

Maf regulates expression of cholesterol biosynthesis genes in cultured Schwann cells. (A) S16 cells were transduced with control or Maf-expressing retroviruses, selected with puromycin to eliminate uninfected cells, and exposed or not exposed to 5 mM MβCD. n = 4. mRNAs of the indicated cholesterol biosynthesis enzymes were analyzed by RT-qPCR. The numbers in parentheses refer to average fold changes. (B) Scheme of the analysis of differentiated/undifferentiated primary mouse Schwann cells. (C) Maf mRNA quantified by RT-qPCR (n = 4) in differentiated and undifferentiated Schwann cells in the presence or absence of Maf or control siRNAs. (D) mRNA levels of the indicated genes were analyzed by RT-qPCR. n = 4. Error bars indicate SEM. For statistical analysis, paired two-tailed Student's t-test with 95% confidence interval was performed. (*) P < 0.05; (**) P < 0.01; (***) P < 0.001; (n.s.) nonsignificant.
As a complimentary loss-of-function approach, we used primary mouse Schwann cells and induced their differentiation using cAMP and Nrg1 (Arthur-Farraj et al. 2011). We transfected primary mouse Schwann cells with control or two different Maf siRNAs and allowed them to differentiate in the presence of db-cAMP (cell-permeable analog of cAMP) and Nrg1 (Fig. 4B). Cells maintained in the absence of db-cAMP and Nrg1 were used as undifferentiated controls. Maf mRNA was robustly induced by db-cAMP and Nrg1, and the siRNAs down-regulated Maf transcripts by >90% (Fig. 4C). We then compared the mRNA levels of Mbp, Egr2, and genes encoding cholesterol biosynthesis enzymes. In accordance with the results from mutant mouse tissue, loss of Maf suppressed the induction of genes encoding cholesterol biosynthesis enzymes but did not affect Mbp or Egr2 expression (Fig. 4D).
Maf transcript and protein levels are decreased in ΔErbB2 mice
Next, we analyzed upstream events controlling Maf. Given the phenotypic and transcriptomic similarities between ΔMaf and ΔErbB2 nerves, we hypothesized that Maf is a downstream effector of Nrg1–ErbB2/3 signaling. Intriguingly, we noticed in our microarray data that Maf mRNA was significantly decreased in ΔErbB2 nerves. We validated this finding by RT-qPCR, which demonstrated a 50%–60% reduction of Maf mRNA in ΔErbB2 nerves compared with controls (Fig. 5A). However, at the protein level, Maf was more strongly reduced in ΔErbB2 nerves, and levels were almost comparable with those observed in the nerves of ΔMaf mutants (Fig. 5B,C). The residual Maf protein observed in ΔMaf nerves is likely produced by macrophages in the nerve that are not recombined by Egr2-Cre (Supplemental Fig. S2). In conclusion, our data indicate that Nrg1–ErbB2/3 signaling regulates Maf by two distinct mechanisms: a transcriptional one and a post-transcriptional one. It should be noted that heterozygote Maf mutant mice, which have a 50% reduction of Maf mRNA, showed a very mild change in myelination that did not reach statistical significance (Supplemental Fig. S5). Thus, the ErbB2-dependent transcriptional regulation combined with its post-transcriptional regulation of Maf is functionally critical.
Figure 5.
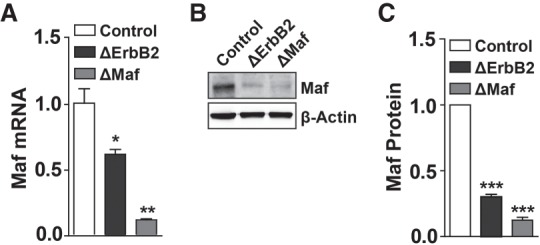
Maf transcript and protein levels are decreased in ΔErbB2 mutant mice. (A) Maf mRNA is decreased in ΔErbB2 mice. n = 4. (B,C) Maf protein is decreased in ΔErbB2 mice. (B) A representative Western blot image. (C) Quantification of Maf protein levels on Western blots. n = 10 for control; n = 10 for ΔErbB2; n = 8 for ΔMaf. Note that the extent of the reduction of the Maf protein is greater than that of its mRNA. Error bars indicate SEM. For statistical analysis, unpaired (A) and paired (C) two-tailed Student's t-tests with 95% confidence interval were performed. (*) P < 0.05; (**) P < 0.01; (***) P < 0.001.
Maf transcription is regulated by Nrg1/Ca2+/ calmodulin
We aimed to understand the transcriptional mechanism by which Nrg1 regulates Maf. We observed that stimulation of serum-starved S16 cells with recombinant Nrg1 induced Maf mRNA in a time-dependent manner (Fig. 6A). Although this does not reflect a differentiation context, we reasoned that it could serve as an experimental platform to investigate the molecular mechanism, which, once identified, can then be verified in vivo. We focused on pathways known to be activated downstream from Nrg1–ErbB2/3 signaling that were implicated in Schwann cell biology (MAPK, AKT, and the Ca2+ pathway) (Newbern and Birchmeier 2010) and tested inhibitors of these. We additionally tested the JAK/STAT pathway because it was also reported to be activated by Nrg1 (Liu and Kern 2002). As expected, a specific inhibitor of the ErbB2 kinase, TAK165, abolished the Nrg1-dependent induction of Maf mRNA. However, MAPK, AKT, and JAK inhibitors failed to block Nrg1-stimulated Maf transcription (Fig. 6B). In contrast, two different inhibitors of the Ca2+ signaling pathway—an inhibitor of PLCγ and an IP3 receptor (IP3R) antagonist—abrogated the Nrg1-dependent Maf transcription (Fig. 6B). Conversely, raising intracellular Ca2+ by using ionomycin induced Maf mRNA (Supplemental Fig. S6A).
Figure 6.

Nrg1-dependent calcium–calmodulin kinase and HDAC5 (histone deacetylase 5) regulate Maf transcription. (A) Nrg1 induces Maf mRNA in S16 cells. S16 cells were serum-starved and treated with Nrg1 for the indicated times, and mRNA was analyzed by RT-qPCR. n = 3. (B) RT-qPCR analysis of Maf mRNA in S16 cells stimulated by Nrg1 and treated with the indicated inhibitors. Note that inhibitors of ErbB2, the Ca2+ pathway, and CaM kinase abrogate Nrg1-dependent Maf transcription. n = 4. (C) Nuclear-localized HDAC5 represses Maf. S16 cells were transduced with HDAC4SA or HDAC5SA retroviruses and stimulated with Nrg1. n = 4. (D) Depletion of HDAC5 induces Maf. S16 cells were transfected with two independent siRNAs against HDAC4 or HDAC5. Maf mRNA levels were measured 3 d after transfection. n = 4. (E) HDAC5SA represses Maf induction in differentiated primary mouse Schwann cells. n = 3. (F) HDAC5 binds to the promoter region of Maf. S16 cells were transfected with control or siRNA against HDAC5. Cells were analyzed by ChIP-qPCR using an anti-HDAC5 antibody. n = 3. (G) HDAC5 is regulated by Nrg1. Serum-starved S16 cells were stimulated with Nrg1 for the indicated time points. Cells were fractionated into cytosol and nuclear lysates, and fractions were analyzed by Western blotting. (H) Histone acetylation is increased at the Maf promoter in HDAC5 silenced S16 cells. n = 3. (I) CamKVI and HDAC5 phosphorylation is reduced in sciatic nerve tissues of ΔErbB2 mice. n = 3. Shown is a representative Western blot among three pairs. (J) HDAC5 binding at the Maf promoter is increased in sciatic nerve tissues of ΔErbB2 mice. n = 3. Note that only about half of the nuclei in the nerve derive from myelinating Schwann cells. (K) Histone acetylation is reduced at the Maf promoter in sciatic nerve tissues of ΔErbB2 mice. n = 3. All error bars indicate SEM. For statistical analysis, paired two-tailed Student's t-tests with 95% confidence interval were performed except for in J, which is unpaired. (*) P < 0.05; (**) P < 0.01.
To test this mechanism in an independent cell line, RT4-D6P2T (referred to here as RT4) rat Schwannoma cells were used; these cells carry an activating mutation in the transmembrane domain of ErbB2 (V664E) (Bargmann et al. 1986). Overnight incubation with ErbB2 or Ca2+ pathway inhibitors decreased Maf mRNA, and ionomycin antagonized the effect of ErbB2 inhibition on Maf mRNA in RT4 cells (Supplemental Fig. S6B,C). Thus, Ca2+ signaling regulates the levels of Maf transcripts in two different cell lines.
Next, we tested inhibitors of major calcium effectors. Inhibitors of the PP2B–NFAT pathway or of PKC had no effect on Maf mRNA. However, an inhibitor of the calmodulin-dependent protein kinase CaM-KK completely blocked the Nrg1-dependent induction of Maf in S16 cells (Fig. 6B). We also confirmed in primary Schwann cells that inhibition of Ca2+ signaling and CaM-KK activity blocks the induction of Maf mRNA by recombinant Nrg1 (Supplemental Fig. S6D). Although CaM-KK inhibition did not affect Maf transcript levels in RT4 cells, inhibition of CaMKII, another calmodulin-dependent kinase that shares most of its targets with CaM-KK (Berridge et al. 2003), reduced Maf mRNA (Supplemental Fig. S6B). This difference might be due to cell line-specific expression levels or activities of the two proteins. Together, our results indicate that Ca2+-mediated activation of calmodulin-dependent protein kinase (CaM-KK or CaMKII) induces Maf transcription in Schwann cell lines.
CaM kinases exclude HDAC5 (histone deacetylase 5) from the nucleus to derepress Maf
CaM kinases can regulate gene expression by activating members of the CREB family of transcription factors (Berridge et al. 2003). However, overexpression of CREB or ATF-1, two CREB family members known to be expressed in Schwann cells (Arthur-Farraj et al. 2011), did not induce Maf mRNA in either S16 or RT4 cells (Supplemental Fig. S6E). Class II HDACs, which include HDAC4 and HDAC5, shuttle between the nucleus and cytoplasm. CaMKII, CaMKI, or CaMKIV (CaMKI and CaMKIV are activated by CaM-KK) phosphorylate HDAC4/5, leading to interaction with 14-3-3 proteins, cytoplasmic retention, and derepression of target genes (Yang and Gregoire 2005). We hypothesized that HDAC4/5 represses Maf and that CaM kinase antagonizes this repression. To test this, we expressed Flag-tagged HDAC4/5SA mutants in which all serine residues phosphorylated by CaM kinases were substituted with alanine. Interestingly, overexpression of HDAC5SA, but not HDAC4SA, down-regulated Maf mRNA in S16 cells and abrogated Nrg1-dependent stimulation of Maf transcription (Fig. 6C). Conversely, silencing of HDAC5 by siRNA increased the level of Maf mRNA (Fig. 6D).
We next tested HDAC5-mediated repression of Maf in differentiating mouse primary Schwann cells. HDAC5SA expression blocked the induction of Maf mRNA by db-cAMP and Nrg1 (Fig. 6E). HDAC5SA expression also impaired the induction of cholesterol biosynthesis genes but did not affect Mbp or Egr2 (Supplemental Fig. S6F). Next, we tested whether HDAC5 binds at the Maf promoter by performing ChIP-qPCR (ChIP combined with quantitative PCR [qPCR]) with an anti-HDAC5 antibody (Fig. 6F). HDAC5 was enriched at the Maf promoter, and silencing of HDAC5 abolished this enrichment, confirming the specificity of the ChIP-qPCR experiment. Furthermore, silencing of HDAC5 led to increased histone H3 acetylation, the substrate of HDAC5, at the Maf promoter (Fig. 6H). Finally, we tested whether Nrg1 signaling regulates HDAC5 phosphorylation. In serum-starved S16 cells, Nrg1 stimulation induced phosphorylation and nuclear exclusion of HDAC5 (Fig. 6G). These results indicate that CaM kinase downstream from Nrg1 phosphorylates HDAC5 and thus derepress Maf expression in Schwann cell lines.
To confirm these findings in vivo, we first analyzed sciatic nerve tissues of developing mice to assess CaM kinase activity. Antibodies that robustly recognize phosphorylated (activated) CaMKIV, the target of CaM-KK, in tissue samples are available and were used for this analysis. The total amount of CaMKIV protein decreased during development, while the level of phosphorylated CaMKIV gradually increased. Thus, the overall activity of CaMKIV (phosphorylated CaMKIV normalized by total CaMKIV) increased during development (Supplemental Fig. S6G). Analysis of sciatic nerve tissues of ΔErbB2 mice revealed decreased CaMKIV and HDAC5 phosphorylation (Fig. 6I). Thus, Nrg1/ErbB signaling phosphorylates CaMKIV and HDAC5 in Schwann cells during myelination. We next verified Nrg1/ErbB-dependent HDAC5 recruitment and histone H3 acetylation at the Maf promoter in sciatic nerve tissue. ChIP-qPCR demonstrated that HDAC5 binding was increased, whereas histone H3 acetylation was decreased in sciatic nerves of ΔErbB2 mice (Fig. 6J,K). Thus, the mechanism identified in Schwann cell lines is also important in vivo.
Maf stability is regulated by Nrg1/MAPK
We also investigated the second mechanism by which Nrg1 controls Maf; namely, Nrg1-dependent post-transcriptional regulation. In RT4 cells, inhibition of ErbB2 decreased the amount of transfected Flag-Maf protein but not Flag-tdTomato (Fig. 7A). Reduction of Maf protein levels was reversed by the proteasome inhibitor MG132 but not by a lysosomal protease inhibitor (Fig. 7B). In concordance with this, ubiquitination of Maf was increased by ErbB2 inhibition, indicating that ErbB2 regulates Maf stability through the ubiquitination–proteasome pathway (Fig. 7C).
Figure 7.

Maf stability is regulated by Nrg1/MAPK. (A) ErbB2 inhibition destabilizes Maf protein. RT4 cells transfected with expression constructs encoding Flag-Maf or Flag-tdTomato were incubated overnight with ErbB2 inhibitor. (B) Maf is degraded through a proteasome-dependent pathway upon ErbB2 inhibition. RT4 cells treated with ErbB2 inhibitor were incubated with MG132 (proteasome inhibitor) or chloroquine (lysosomal inhibitor) for 4 h. (C) ErbB2 inhibition induces Maf ubiquitination, as assessed by an ubiquitination assay using RT4 cells transfected with expression constructs encoding HA-tagged ubiquitin and Flag-tagged Maf, as indicated. (D) GSK3 target sites are required for Maf destabilization by ErbB2 inhibition. RT4 cells were transfected with Maf cDNA (wild type or 4SA mutant) and incubated with ErbB2 inhibitor. (E,F) ErbB2 inhibition destabilizes Maf in a GSK3-independent manner. RT4 cells transfected with Maf cDNA were incubated with ErbB2 inhibitor alone or together with the GSK3 inhibitor CHIR99021 (E) or SB-216763 (F). (G) MAPK pathway inhibition destabilizes Maf protein. RT4 cells transfected with Maf cDNA were incubated with the indicated inhibitors. (H) Acute inhibition of MAPK destabilizes Maf in vivo. P8 neonates were intraperitoneally injected with vehicle or trametinib. Sciatic nerve tissue was isolated 4 h after injection and analyzed by Western blotting. (I) Quantification of H. The error bar indicates SEM. Unpaired two-tailed Student's t-test with 95% confidence interval was performed. (***) P < 0.001. (S.E.) Short exposure; (L.E.) long exposure.
In myeloma cells, Maf stability is regulated by GSK3 phosphorylation, which triggers ubiquitination and degradation (Herath et al. 2014). Since AKT antagonizes GSK3 (Cross et al. 1995), we first tested whether the Nrg1–AKT–GSK3 axis stabilizes Maf. Constructs encoding Maf wild type and Maf4SA, a mutant in which all four Ser/Thr residues phosphorylated by GSK3 are substituted with alanine, were transfected into RT4 cells, and levels of Maf protein were assessed. We found that wild-type Maf, but not the Maf4SA mutant, was efficiently destabilized by ErbB2 inhibition (Fig. 7D). As anticipated, two independent GSK3 inhibitors (CHIR99021 and SB-2167639) markedly increased the basal level of transfected Maf protein, but, unexpectedly, Maf was still efficiently destabilized by ErbB2 inhibition (Fig. 7E,F). To analyze this further, we used additional inhibitors and observed that U0126, a MAPK inhibitor that does not inhibit AKT, destabilized Maf to a level comparable with the one observed after ErbB2 inhibition (Fig. 7G). Nrg1 treatment markedly stabilized transfected Flag-Maf protein in S16 and primary Schwann cells (Supplemental Fig. S7A), and the MAPK inhibitor abrogated the effect (Supplemental Fig. S7B).
Next, we acutely inhibited MAPK to verify the effect of the inhibition in vivo. For this purpose, we switched to trametinib, a newly developed potent inhibitor of the MAPK pathway. Four hours after intraperitoneal injection of trametinib into P8 neonates, ERK phosphorylation was abolished. Importantly, this short-term treatment lowered the levels of Maf protein (Fig. 7H,I). Notably, the phospho-Erk levels in individual vehicle-treated mice were somewhat variable, which largely correlated with Maf levels. Although Maf protein was considerably reduced, due to the short duration of the drug treatment, steady-state levels of cholesterol biosynthesis genes were unchanged (data not shown). Taken together, our results show that the MAPK pathway downstream from Nrg1 signaling stabilizes Maf in vitro and in vivo.
Discussion
Coordination of the myelination program by Nrg1 signaling
Schwann cells have a particularly high demand for cholesterol during myelination and have to coordinate myelin and cholesterol production. Here, we identify Maf as a new gene required for myelination. Maf is specifically induced in myelinating Schwann cells, and its loss results in hypomyelination. ΔMaf mice also display other features typical of myelination deficits, such as a decreased axon conduction velocity and the presence of tomaculae. ΔMaf nerves exhibit a major down-regulation of genes involved in cholesterol synthesis. Cholesterol biosynthesis is a rate-limiting step in myelination, and we propose that the reduction in cholesterol biosynthesis is an important consequence of Maf ablation in Schwann cells. SREBP1/2, the master transcriptional regulators of cholesterol synthesis enzymes, were unaffected. Instead, Maf bound to the enhancers of genes encoding cholesterol synthesis enzymes, suggesting that Maf directly participates in their regulation. Moreover, we found that Maf is a downstream target of the Nrg1/ErbB pathway. The CAMK and MAPK pathways are important for the Nrg1-dependent transcriptional and post-transcriptional control of Maf, respectively. Collectively, our results delineate a novel cascade regulating cholesterol synthesis in myelinating Schwann cells that spans from an extracellular signal to chromatin (summarized in Fig. 8).
Figure 8.
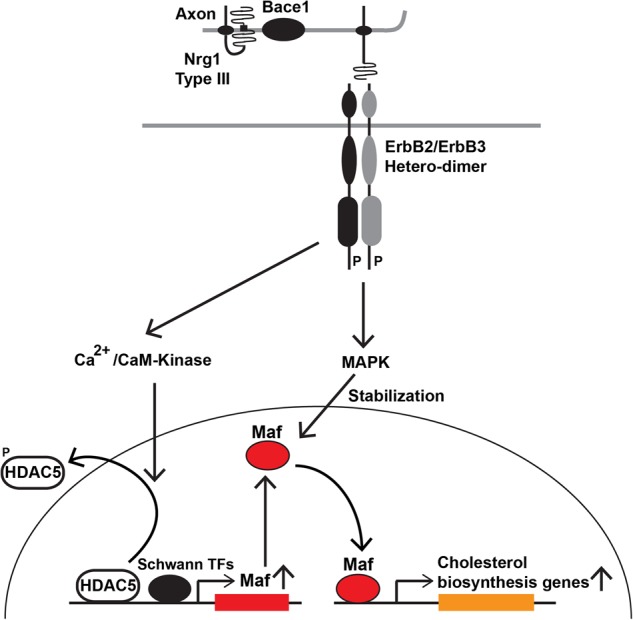
Orchestration of cholesterol biosynthesis by Nrg1/Maf. Nrg1 signaling increases cholesterol synthesis in myelinating Schwann cells through a Maf-mediated mechanism that depends on a combinatorial effect of the Ca2+ and MAPK pathways. See the Discussion for further details.
Maf regulates myelination by controlling transcription of cholesterol biosynthesis genes
We demonstrate here that Maf regulates Schwann cell development by regulating cholesterol biosynthesis. Maf ablation severely reduced the expression of genes encoding rate-limiting enzymes in cholesterol synthesis, such as Hmgcr and Fdft1. Down-regulation of the key enzymes and cholesterol was apparent during the early stages of myelination, indicating that this reflects a primary consequence of the Maf mutation. Many other aspects of the Schwann cell-specific differentiation program were unchanged by the mutation, such as expression of myelin genes or transcription factors controlling myelin genes, AKT or MAPK signaling, and overall protein synthesis. The phenotype of Maf mutant mice is milder than the one observed when the de novo cholesterol biosynthesis program is completely eliminated (e.g., SCAP mutants), reflecting differences in the severity of the transcriptional effects on cholesterol synthesis genes.
An important question for future investigation is whether and how Maf cooperates with other transcriptional regulators during myelination. For example, it is possible that Maf cooperates with SREBP1/2 at the chromatin, since the effect of Maf overexpression on cholesterol biosynthesis genes became more pronounced when cells were depleted of cholesterol, a condition that increases SREBP1/2 activity. Key Schwann cell transcription factors such as Egr2 can directly participate in the activation of cholesterol biosynthesis genes (Leblanc et al. 2005). We therefore compared Maf-binding sites and published ChIP-seq (ChIP combined with high-throughput sequencing) data for Sox10 and Egr2 in cholesterol synthesis genes of sciatic nerve tissues (Srinivasan et al. 2012; Lopez-Anido et al. 2015) and observed that the distinct genes were bound by various combinations of Maf, Sox10, and Egr2 (Supplemental Table S1). It is thus possible that Maf cooperates with Sox10, Egr2, and SREBP1/2 to regulate cholesterol biosynthesis.
Maf expression is modulated by Nrg1 in myelinating Schwann cells
We provide evidence that CaM kinase activity derepresses Maf and that this derepression occurs in a Nrg1/CaM kinase-dependent manner. Nrg1/CaM kinase antagonizes the action of HDAC5 by phosphorylation, which sequesters HDAC5 in the cytoplasm. Accordingly, acetylated H3 levels at the Maf promoter were reduced after HDAC5 was silenced in cultured cells, and this was also observed after ErbB2 ablation in nerve tissue. It should be noted that Maf is not expressed during early Schwann cell development but is robustly induced during myelination (Fig. 1B). By comparison, the effect of Nrg1–ErbB2/3 signaling on Maf mRNA is weaker (50%–60% both in vivo and in culture). Thus, an Nrg1/ErbB-independent transcriptional control of Maf is executed when myelination commences, possibly by well-characterized transcription factors that control entry into myelination, such as Egr2, Oct-6, or Brn2. Indeed, previous ChIP-seq results show that Sox10 and Egr2 bind to the Maf promoter (Supplemental Table S1). A similar mechanism—the combined action of lineage-specific transcription factors and derepression of chromatin through signaling molecules—is used during muscle differentiation (McKinsey et al. 2000) and thus might represent a common regulatory mechanism in development.
Control of Maf stability by the MAPK pathway
Our results suggest the existence of a novel MAPK-dependent pathway that stabilizes Maf. Even when Maf was stabilized through GSK3 inhibition, ErbB2 signals are needed to fully stabilize the Maf protein. We introduced reversion mutations into Maf4SA, which restore individual Ser/Thr residues targeted by GSK3. This showed that Maf4SA and all four reversion mutants were no longer destabilized by ErbB2 inhibition (Supplemental Fig. S7C). Thus, Nrg1–MAPK and GSK cooperate to fully stabilize Maf. Notably, we did not notice differences in the mobility of Maf protein in ΔErbB2 nerves or cells treated with MAPK/ErbB2 inhibitor, indicating that the Nrg1–MAPK pathway does not activate a Maf phosphatase. The stabilization of Maf protein by Nrg1–MAPK signaling is very acute, which excludes transcriptional mechanisms. Thus, a plausible mechanism is that MAPK activity acts downstream from Maf phosphorylation; for instance, by inhibiting an E3 ubiquitin ligase or activating a deubiquitinase. The MAPK pathway is known to stimulate myelination by affecting transcription and boosting protein synthesis (Grossmann et al. 2009; Newbern et al. 2011; Sheean et al. 2014). Here we show that MAPK activity also stabilizes Maf, adding a new route by which MAPK promotes myelin growth.
Materials and methods
Animals
All experiments were conducted according to regulations established by the Max Delbrück Centre for Molecular Medicine and the Landesamt für Gesundheit und Soziales. The Mafflox, MafLacZ, ErbB2flox, Egr2-Cre, and Dhh-Cre lines have been described previously (Garratt et al. 2000; Voiculescu et al. 2000; Jaegle et al. 2003; Wende et al. 2012). P14 Wistar rat neonates were used for the Maf ChIP experiments.
Cell lines, constructs, transfection, and retrovirus generation
S16 and RT4-D6P2T were purchased from American Type Culture Collection (ATCC) and were maintained according to the guidelines provided by ATCC. 293T cells were a kind gift from Dr. Claus Scheidereit (Max Delbrück Centre for Molecular Medicine, Germany) and were maintained in high-glucose DMEM (Gibco) containing 10% fetal bovine serum and penicillin/streptomycin. Methods for isolating and culturing primary Schwann cells have been described (Sheean et al. 2014). The list of chemicals used in this study is in the Supplemental Materials.
Mouse Maf cDNA was cloned into the pcDNA3.1 plasmid containing a Flag tag. Expression constructs encoding Myc-tagged Maf (wild type and 4SA mutants) were a kind gift from Dr. Celio Pouponnot and Dr. Laure Lecoin (both at Curie Institute, France). The plasmid encoding HA-Ub was a kind gift from Dr. Claus Scheidereit. Flag-tagged HDAC4SA and HDAC5SA expression constructs were purchased from Addgene.
Fugene HD (Promega, E2311) and Lipofectamine RNAiMAX (Thermo Fisher, 13778075) were used for DNA and siRNA transfections experiments, respectively, according to the manufacturer's guidelines. siRNAs were synthesized from Eurofins (Luxemburg) with a dTdT overhang at the 3′ ends. The targeting sequences of the siRNAs used in this study are listed in Supplemental Table S3.
For retrovirus generation, 293T cells were transfected with a 1:1 ratio of retrovirus construct and a helper virus vector (pCLEGO). The media were changed 1 d after transfection, and retroviruses were collected for 2 d. Supernatants were cleared by centrifuging at 3000 rpm for 20 min. Polybrene (Millipore, TR-1003-G) was added at 5 µg/mL concentration, and target cells were infected for 1 d. On the following day, cells were selected with 2–3 µg/µL puromycin (Sigma-Aldrich, P8833). For infecting primary Schwann cells, viruses were collected in Schwann cell culture medium, and the supernatants were further concentrated using Retro-X concentrator (Clontech, 631455).
Myelin thickness and intermodal distance measurements
Electron microscopy was performed as described (Topilko et al. 1994). The circumference of individual myelinated fibers and their axons was then measured from electron microscopy photographs. Internodal distance was determined using single teased fibers from osmicated sciatic nerves. Internodal distance and fiber diameter were measured from bright-field microscopy images. The average relationship between the axon diameter and the thickness of the fiber was determined for both control and ΔMaf mice from the myelin thickness measurements. This relationship between fiber diameter and axon diameter was then used to calculate the axon diameter of the teased fibers. The intermodal distance was then plotted against the axon diameter.
Immunohistochemistry
Sciatic nerves were freshly isolated and submerged in Zambonis fixative for 10 min at room temperature. Nerves were washed in PBS and then either directly teased on slides or incubated in 20% sucrose overnight. Cryoprotected sciatic nerves were then embedded in OCT and frozen on dry ice/ethanol. Twelve-micrometer frozen sections were prepared, dried, and stored at −80°C. Immunohistochemistry was then performed as described previously (Wende et al. 2012). The list of the primary antibodies used is in Supplemental Table S2. Secondary antibodies were obtained from Dianova. Fluorescence was visualized by laser-scanning microscopy (Carl-Zeiss, LSM 700) using Zen 2009 software.
Microarray hybridization and data analysis
Total RNA was isolated from P8 sciatic nerves using Trizol (Invitrogen) and RNeasy (Qiagen). Sciatic nerves of five mice of each genotype (ΔErbB2 and littermate controls and ΔMaf and littermate controls) were processed and hybridized to Affymetrix Mouse Genechip 1.0 ST arrays as specified by the manufacturer. Microarray data were analyzed using the Partek Genomics suite. The microarray data were normalized using RMA (robust multiarray average). Batch effects between ErbB2 and Maf samples were removed using the control samples of each genotype. Differential expression was analyzed using a parametric analysis of variance (ANOVA) with Benjamini Hochberg false discovery rate (FDR) (https://www.jstor.org/stable/2346101). Post-hoc comparisons were done using the LSD (least significant difference) test.
For clustering, differentially expressed genes with an FDR < 0.01 were considered (1092 genes). K-means clustering was then performed on normalized average expression values of each genotype (mean of 0 and standard deviation of 1). The data were grouped into six clusters based on Davies-Bouldin scores. The clusters were then hand-sorted. Heat maps were generated using R and the pheatmap package. GO analysis of the genes within the clusters was performed using DAVID (Huang da et al. 2009).
Electrophysiology
The conduction velocities of single nerve fibers within the saphenous nerve were measured using an ex vivo skin nerve preparation (Milenkovic et al. 2008). We made recordings from functionally isolated single units in teased fibers of the saphenous nerve that respond to mechanosensitive stimuli of the skin. For each single unit, a metal electrode was placed in the receptive field to electrically evoke spikes recorded in the teased filament between 20 and 40 mm distant from the stimulation site. The conduction velocity of individual fibers in meters per second was then calculated by dividing the conduction distance in millimeters by the electrical latency in milliseconds. In each ex vivo preparation, the conduction velocities of both fast- and slower-conducting axons were measured in a randomized fashion, blind to the animal's genotype.
GC-MS
Nerve material was homogenized in extraction buffer (50 mg of nerve material per 1 mL of extraction buffer [5:2:1 v:v:v]: LC-MS-grade methanol, chloroform ReagentPlus 99.8% [Sigma-Aldrich], LC-MS-grade water); 2 mg/mL cinnamic acid (Sigma-Aldrich) was added as an internal standard. For phase separation, an additional four parts of water was added and shaken at 750 rpm for 60 min at 4°C followed by centrifugation at 5000g for 10 min to separate the polar (top), lipid (bottom), and interface (tissue debris) layers. Lipid phases were dried under vacuum for 12 h and processed and analyzed using GC-MS. Metabolite analyses were performed by a Pegasus III mass spectrometer (LECO) equipped with an Agilent 6890N gas chromatograph and a VF-5ms column with 30-m length and 250-µm inner diameter (Agilent). Samples were prepared as described in Kempa et al. (2009), and 1 µL of sample was injected into a baffled liner (Gerstel) with a 1:5 split ratio under a helium flow of 1.2 mL/min. The oven was heated from 70°C to 350°C, with 5°C/min to 120°C and 7°C/min to 350°C, followed by a 2-min hold time. Scan rates of 20 Hz and mass ranges of 70–600 Da were used. The GC-MS chromatograms were initially processed with the ChromaTOF software (LECO). An in-house database was used to identify substances in chromatograms achieved from the lipid phase with respect to the spectrum similarity and retention index. Data matrices for relative quantification were extracted from the mass spectra using MetMax software (Kempa et al. 2009).
In vivo SILAC chase experiment for protein translation rate measurement
In vivo labeling and subsequent mass spectrometry analysis were performed as described previously (Sheean et al. 2014). For data analysis, nonnormalized SILAC ratios from proteins with two or more SILAC counts were used. Labeling efficacy was the same in both samples and therefore not corrected for. Differences in overall nerve protein content was accounted for by performing spike-in experiments. Additionally, we normalized the SILAC ratios to neuron-derived proteins (Nefl, Tubb3, Nefh, and Nefm). Finally, GO annotation was added to each protein, and contaminating blood-derived proteins were excluded. Proteins were subgrouped based on either GO terms or manual annotation.
Western blotting, ChIP, RT-qPCR, and ubiquitination assay
Western blotting, ChIP, RT-qPCR, and ubiquitination assay were performed following standard protocols. For further details, see the Supplemental Material.
Supplementary Material
Acknowledgments
We thank Claudia Päseler and Petra Stallerow for help with the animal husbandry caring of the animals, Bettina Brandt for technical support, Monique Bergemann and Michael Bader for providing rat pups, and Dr. Altuna Akalin for helping with analyzing Egr2/Sox10 ChIP-seq data (all at Max Delbrück Centre for Molecular Medicine). M.K. was supported by the Alexander Humboldt post-doctoral fellowship. This work was funded by the German Science Foundation (SFB 665 to C.B).
Author contributions: M.K. and H.W. performed the main experiments. C.C. helped with some of the experiments. J.W. and J.K. performed the axon conductance velocity measurement, supervised by G.R.L. S.K. performed GC-MS. E.M. performed the in vivo pulse SILAC experiment, supervised by M.S. C.B. supervised the project. M.K., C.B., and H.W. wrote the manuscript together. All authors read and commented on the manuscript.
Footnotes
Supplemental material is available for this article.
Article published online ahead of print. Article and publication date are online at http://www.genesdev.org/cgi/doi/10.1101/gad.310490.117.
Freely available online through the Genes & Development Open Access option.
References
- Adlkofer K, Martini R, Aguzzi A, Zielasek J, Toyka KV, Suter U. 1995. Hypermyelination and demyelinating peripheral neuropathy in Pmp22-deficient mice. Nat Genet 11: 274–280. [DOI] [PubMed] [Google Scholar]
- Arthur-Farraj P, Wanek K, Hantke J, Davis CM, Jayakar A, Parkinson DB, Mirsky R, Jessen KR. 2011. Mouse schwann cells need both NRG1 and cyclic AMP to myelinate. Glia 59: 720–733. [DOI] [PMC free article] [PubMed] [Google Scholar]
- Bargmann CI, Hung MC, Weinberg RA. 1986. Multiple independent activations of the neu oncogene by a point mutation altering the transmembrane domain of p185. Cell 45: 649–657. [DOI] [PubMed] [Google Scholar]
- Berridge MJ, Bootman MD, Roderick HL. 2003. Calcium signalling: dynamics, homeostasis and remodelling. Nat Rev Mol Cell Biol 4: 517–529. [DOI] [PubMed] [Google Scholar]
- Blank V, Andrews NC. 1997. The Maf transcription factors: regulators of differentiation. Trends Biochem Sci 22: 437–441. [DOI] [PubMed] [Google Scholar]
- Britsch S, Goerich DE, Riethmacher D, Peirano RI, Rossner M, Nave KA, Birchmeier C, Wegner M. 2001. The transcription factor Sox10 is a key regulator of peripheral glial development. Genes Dev 15: 66–78. [DOI] [PMC free article] [PubMed] [Google Scholar]
- Brown MS, Goldstein JL. 1997. The SREBP pathway: regulation of cholesterol metabolism by proteolysis of a membrane-bound transcription factor. Cell 89: 331–340. [DOI] [PubMed] [Google Scholar]
- Chernousov MA, Yu WM, Chen ZL, Carey DJ, Strickland S. 2008. Regulation of Schwann cell function by the extracellular matrix. Glia 56: 1498–1507. [DOI] [PubMed] [Google Scholar]
- Cross DA, Alessi DR, Cohen P, Andjelkovich M, Hemmings BA. 1995. Inhibition of glycogen synthase kinase-3 by insulin mediated by protein kinase B. Nature 378: 785–789. [DOI] [PubMed] [Google Scholar]
- Domenech-Estevez E, Baloui H, Meng X, Zhang Y, Deinhardt K, Dupree JL, Einheber S, Chrast R, Salzer JL. 2016. Akt regulates axon wrapping and myelin sheath thickness in the PNS. J Neurosci 36: 4506–4521. [DOI] [PMC free article] [PubMed] [Google Scholar]
- Garratt AN, Voiculescu O, Topilko P, Charnay P, Birchmeier C. 2000. A dual role of erbB2 in myelination and in expansion of the Schwann cell precursor pool. J Cell Biol 148: 1035–1046. [DOI] [PMC free article] [PubMed] [Google Scholar]
- Goebbels S, Oltrogge JH, Wolfer S, Wieser GL, Nientiedt T, Pieper A, Ruhwedel T, Groszer M, Sereda MW, Nave KA. 2012. Genetic disruption of Pten in a novel mouse model of tomaculous neuropathy. EMBO Mol Med 4: 486–499. [DOI] [PMC free article] [PubMed] [Google Scholar]
- Grossmann KS, Wende H, Paul FE, Cheret C, Garratt AN, Zurborg S, Feinberg K, Besser D, Schulz H, Peles E, et al. 2009. The tyrosine phosphatase Shp2 (PTPN11) directs Neuregulin-1/ErbB signaling throughout Schwann cell development. Proc Natl Acad Sci 106: 16704–16709. [DOI] [PMC free article] [PubMed] [Google Scholar]
- He Y, Kim JY, Dupree J, Tewari A, Melendez-Vasquez C, Svaren J, Casaccia P. 2010. Yy1 as a molecular link between neuregulin and transcriptional modulation of peripheral myelination. Nat Neurosci 13: 1472–1480. [DOI] [PMC free article] [PubMed] [Google Scholar]
- Herath NI, Rocques N, Garancher A, Eychene A, Pouponnot C. 2014. GSK3-mediated MAF phosphorylation in multiple myeloma as a potential therapeutic target. Blood Cancer J 4: e175. [DOI] [PMC free article] [PubMed] [Google Scholar]
- Herbert AL, Monk KR. 2017. Advances in myelinating glial cell development. Curr Opin Neurobiol 42: 53–60. [DOI] [PMC free article] [PubMed] [Google Scholar]
- Ho IC, Hodge MR, Rooney JW, Glimcher LH. 1996. The proto-oncogene c-maf is responsible for tissue-specific expression of interleukin-4. Cell 85: 973–983. [DOI] [PubMed] [Google Scholar]
- Huang da W, Sherman BT, Lempicki RA. 2009. Systematic and integrative analysis of large gene lists using DAVID bioinformatics resources. Nat Protoc 4: 44–57. [DOI] [PubMed] [Google Scholar]
- Jaegle M, Ghazvini M, Mandemakers W, Piirsoo M, Driegen S, Levavasseur F, Raghoenath S, Grosveld F, Meijer D. 2003. The POU proteins Brn-2 and Oct-6 share important functions in Schwann cell development. Genes Dev 17: 1380–1391. [DOI] [PMC free article] [PubMed] [Google Scholar]
- Jessen KR, Mirsky R. 2005. The origin and development of glial cells in peripheral nerves. Nat Rev Neurosci 6: 671–682. [DOI] [PubMed] [Google Scholar]
- Jurevics HA, Morell P. 1994. Sources of cholesterol for kidney and nerve during development. J Lipid Res 35: 112–120. [PubMed] [Google Scholar]
- Kao SC, Wu H, Xie J, Chang CP, Ranish JA, Graef IA, Crabtree GR. 2009. Calcineurin/NFAT signaling is required for neuregulin-regulated Schwann cell differentiation. Science 323: 651–654. [DOI] [PMC free article] [PubMed] [Google Scholar]
- Kempa S, Hummel J, Schwemmer T, Pietzke M, Strehmel N, Wienkoop S, Kopka J, Weckwerth W. 2009. An automated GCxGC-TOF-MS protocol for batch-wise extraction and alignment of mass isotopomer matrixes from differential 13C-labelling experiments: a case study for photoautotrophic-mixotrophic grown Chlamydomonas reinhardtii cells. J Basic Microbiol 49: 82–91. [DOI] [PubMed] [Google Scholar]
- Kim JI, Li T, Ho IC, Grusby MJ, Glimcher LH. 1999. Requirement for the c-Maf transcription factor in crystallin gene regulation and lens development. Proc Natl Acad Sci 96: 3781–3785. [DOI] [PMC free article] [PubMed] [Google Scholar]
- Leblanc SE, Srinivasan R, Ferri C, Mager GM, Gillian-Daniel AL, Wrabetz L, Svaren J. 2005. Regulation of cholesterol/lipid biosynthetic genes by Egr2/Krox20 during peripheral nerve myelination. J Neurochem 93: 737–748. [DOI] [PubMed] [Google Scholar]
- Leimeroth R, Lobsiger C, Lussi A, Taylor V, Suter U, Sommer L. 2002. Membrane-bound neuregulin1 type III actively promotes Schwann cell differentiation of multipotent Progenitor cells. Dev Biol 246: 245–258. [DOI] [PubMed] [Google Scholar]
- Liu J, Kern JA. 2002. Neuregulin-1 activates the JAK–STAT pathway and regulates lung epithelial cell proliferation. Am J Respir Cell Mol Biol 27: 306–313. [DOI] [PubMed] [Google Scholar]
- Lopez-Anido C, Sun G, Koenning M, Srinivasan R, Hung HA, Emery B, Keles S, Svaren J. 2015. Differential Sox10 genomic occupancy in myelinating glia. Glia 63: 1897–1914. [DOI] [PMC free article] [PubMed] [Google Scholar]
- Lyons DA, Pogoda HM, Voas MG, Woods IG, Diamond B, Nix R, Arana N, Jacobs J, Talbot WS. 2005. erbb3 and erbb2 are essential for Schwann cell migration and myelination in zebrafish. Curr Biol 15: 513–524. [DOI] [PubMed] [Google Scholar]
- McKinsey TA, Zhang CL, Lu J, Olson EN. 2000. Signal-dependent nuclear export of a histone deacetylase regulates muscle differentiation. Nature 408: 106–111. [DOI] [PMC free article] [PubMed] [Google Scholar]
- Meyer D, Birchmeier C. 1995. Multiple essential functions of neuregulin in development. Nature 378: 386–390. [DOI] [PubMed] [Google Scholar]
- Meyer D, Yamaai T, Garratt A, Riethmacher-Sonnenberg E, Kane D, Theill LE, Birchmeier C. 1997. Isoform-specific expression and function of neuregulin. Development 124: 3575–3586. [DOI] [PubMed] [Google Scholar]
- Michailov GV, Sereda MW, Brinkmann BG, Fischer TM, Haug B, Birchmeier C, Role L, Lai C, Schwab MH, Nave KA. 2004. Axonal neuregulin-1 regulates myelin sheath thickness. Science 304: 700–703. [DOI] [PubMed] [Google Scholar]
- Milenkovic N, Wetzel C, Moshourab R, Lewin GR. 2008. Speed and temperature dependences of mechanotransduction in afferent fibers recorded from the mouse saphenous nerve. J Neurophysiol 100: 2771–2783. [DOI] [PubMed] [Google Scholar]
- Nakamura M, Hamada M, Hasegawa K, Kusakabe M, Suzuki H, Greaves DR, Moriguchi T, Kudo T, Takahashi S. 2009. c-Maf is essential for the F4/80 expression in macrophages in vivo. Gene 445: 66–72. [DOI] [PubMed] [Google Scholar]
- Newbern J, Birchmeier C. 2010. Nrg1/ErbB signaling networks in Schwann cell development and myelination. Semin Cell Dev Biol 21: 922–928. [DOI] [PMC free article] [PubMed] [Google Scholar]
- Newbern JM, Li X, Shoemaker SE, Zhou J, Zhong J, Wu Y, Bonder D, Hollenback S, Coppola G, Geschwind DH, et al. 2011. Specific functions for ERK/MAPK signaling during PNS development. Neuron 69: 91–105. [DOI] [PMC free article] [PubMed] [Google Scholar]
- Norrmen C, Figlia G, Lebrun-Julien F, Pereira JA, Trotzmuller M, Kofeler HC, Rantanen V, Wessig C, van Deijk AL, Smit AB, et al. 2014. mTORC1 controls PNS myelination along the mTORC1–RXRγ–SREBP–lipid biosynthesis axis in Schwann cells. Cell Rep 9: 646–660. [DOI] [PubMed] [Google Scholar]
- Saher G, Brugger B, Lappe-Siefke C, Mobius W, Tozawa R, Wehr MC, Wieland F, Ishibashi S, Nave KA. 2005. High cholesterol level is essential for myelin membrane growth. Nat Neurosci 8: 468–475. [DOI] [PubMed] [Google Scholar]
- Sander S, Ouvrier RA, McLeod JG, Nicholson GA, Pollard JD. 2000. Clinical syndromes associated with tomacula or myelin swellings in sural nerve biopsies. J Neurol Neurosurg Psychiatry 68: 483–488. [DOI] [PMC free article] [PubMed] [Google Scholar]
- Sheean ME, McShane E, Cheret C, Walcher J, Muller T, Wulf-Goldenberg A, Hoelper S, Garratt AN, Kruger M, Rajewsky K, et al. 2014. Activation of MAPK overrides the termination of myelin growth and replaces Nrg1/ErbB3 signals during Schwann cell development and myelination. Genes Dev 28: 290–303. [DOI] [PMC free article] [PubMed] [Google Scholar]
- Sherman DL, Krols M, Wu LM, Grove M, Nave KA, Gangloff YG, Brophy PJ. 2012. Arrest of myelination and reduced axon growth when Schwann cells lack mTOR. J Neurosci 32: 1817–1825. [DOI] [PMC free article] [PubMed] [Google Scholar]
- Srinivasan R, Sun G, Keles S, Jones EA, Jang SW, Krueger C, Moran JJ, Svaren J. 2012. Genome-wide analysis of EGR2/SOX10 binding in myelinating peripheral nerve. Nucleic Acids Res 40: 6449–6460. [DOI] [PMC free article] [PubMed] [Google Scholar]
- Stolt CC, Wegner M. 2016. Schwann cells and their transcriptional network: evolution of key regulators of peripheral myelination. Brain Res 1641: 101–110. [DOI] [PubMed] [Google Scholar]
- Svaren J, Meijer D. 2008. The molecular machinery of myelin gene transcription in Schwann cells. Glia 56: 1541–1551. [DOI] [PMC free article] [PubMed] [Google Scholar]
- Taveggia C, Zanazzi G, Petrylak A, Yano H, Rosenbluth J, Einheber S, Xu X, Esper RM, Loeb JA, Shrager P, et al. 2005. Neuregulin-1 type III determines the ensheathment fate of axons. Neuron 47: 681–694. [DOI] [PMC free article] [PubMed] [Google Scholar]
- Topilko P, Schneider-Maunoury S, Levi G, Baron-Van Evercooren A, Chennoufi AB, Seitanidou T, Babinet C, Charnay P. 1994. Krox-20 controls myelination in the peripheral nervous system. Nature 371: 796–799. [DOI] [PubMed] [Google Scholar]
- Verheijen MH, Camargo N, Verdier V, Nadra K, de Preux Charles AS, Medard JJ, Luoma A, Crowther M, Inouye H, Shimano H, et al. 2009. SCAP is required for timely and proper myelin membrane synthesis. Proc Natl Acad Sci 106: 21383–21388. [DOI] [PMC free article] [PubMed] [Google Scholar]
- Voiculescu O, Charnay P, Schneider-Maunoury S. 2000. Expression pattern of a Krox-20/Cre knock-in allele in the developing hindbrain, bones, and peripheral nervous system. Genesis 26: 123–126. [DOI] [PubMed] [Google Scholar]
- Wende H, Lechner SG, Cheret C, Bourane S, Kolanczyk ME, Pattyn A, Reuter K, Munier FL, Carroll P, Lewin GR, et al. 2012. The transcription factor c-Maf controls touch receptor development and function. Science 335: 1373–1376. [DOI] [PubMed] [Google Scholar]
- Willem M, Garratt AN, Novak B, Citron M, Kaufmann S, Rittger A, DeStrooper B, Saftig P, Birchmeier C, Haass C. 2006. Control of peripheral nerve myelination by the β-secretase BACE1. Science 314: 664–666. [DOI] [PubMed] [Google Scholar]
- Yang XJ, Gregoire S. 2005. Class II histone deacetylases: from sequence to function, regulation, and clinical implication. Mol Cell Biol 25: 2873–2884. [DOI] [PMC free article] [PubMed] [Google Scholar]
Associated Data
This section collects any data citations, data availability statements, or supplementary materials included in this article.