Abstract
UV-POSIT (Ultraviolet Photodissociation Online Structure Interrogation Tools) is a suite of web-based tools designed to facilitate the rapid interpretation of data from native mass spectrometry experiments making use of 193 nm ultraviolet photodissociation (UVPD). The suite includes four separate utilities which assist in the calculation of fragment ion abundances as a function of backbone cleavage sites and sequence position; the localization of charge sites in intact proteins; the calculation of hydrogen elimination propensity for a-type fragment ions; and mass-offset searching of UVPD spectra to identify unknown modifications and assess false positive fragment identifications. UV-POSIT is implemented as a Python/Flask web application hosted at http://uv-posit.cm.utexas.edu. UV-POSIT is available under the MIT license, and the source code is available at https://github.com/jarosenb/UV_POSIT.
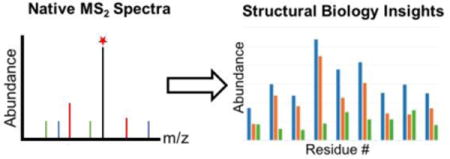
TOC image

Introduction
Native mass spectrometry has recently risen to prominence as a method for characterizing the three-dimensional structures of biomolecules. By using low voltages and non-denaturing buffers, electrospray ionization transfers proteins and protein complexes to the gas phase with structures that in many cases preserve features of their solution counterparts [1, 2]. These native-like species can be analyzed by mass spectrometry and MS/MS to obtain information on complex stoichiometry, charge state distribution, and structure [3].
Ultraviolet photodissociation (UVPD) exhibits distinct advantages for characterizing native proteins and complexes in the gas phase. Energy deposition upon absorption of 193 nm photons may activate ions into excited electronic states, resulting in production of a diverse array of fragment ions that reflect tertiary and quaternary structural features in addition to providing primary sequence information [4–13]. The abundance of fragment ions in native UVPD mass spectra align with the B-factors derived from crystallography, a measure of backbone flexibility. Regions of proteins which participate in fewer hydrophobic interactions or which do not engage in extensive non-covalent interactions exhibit higher UVPD efficiencies, allowing fragment ion abundances to be used as a probe of protein flexibility [5]. In complexes of proteins with small molecules, comparison of UVPD of the holo (ligand-containing) and apo (ligand-free) forms of proteins allow the characterization of structural changes at the residue level [4, 6, 9–11].
In addition to the information obtained from fragment ion abundances, the charge states of fragment ions can be used to probe gas-phase structure. The mechanism of formation of a-type and x-type fragment ions formed by UVPD does not involve extensive mobilization of protons across the protein backbone; therefore, the resulting fragment ions retain charges at the same residues where they were localized in the intact protein. Analysis of fragment ion charge states reveals the location of charges sites in the intact protein, giving deeper insight into the gas-phase structure [7]. As well as charge-site information, the a-type fragments give insight into the hydrogen-bonding structure of polypeptides [8, 13]. Residues in which the amide oxygen or amide nitrogen atoms participate in hydrogen-bonding interactions with adjacent residues exhibit minimal hydrogen loss and form a+1-type fragments; cleavage at residues which do not exhibit these interactions leads to more extensive hydrogen loss and the dominant formation of a-type fragment ions (1 Da lower in mass than the corresponding a+1 ions). Deconvolution of the a-ion isotope envelope can be applied to measure the extent of intramolecular hydrogen bonding for each residue.
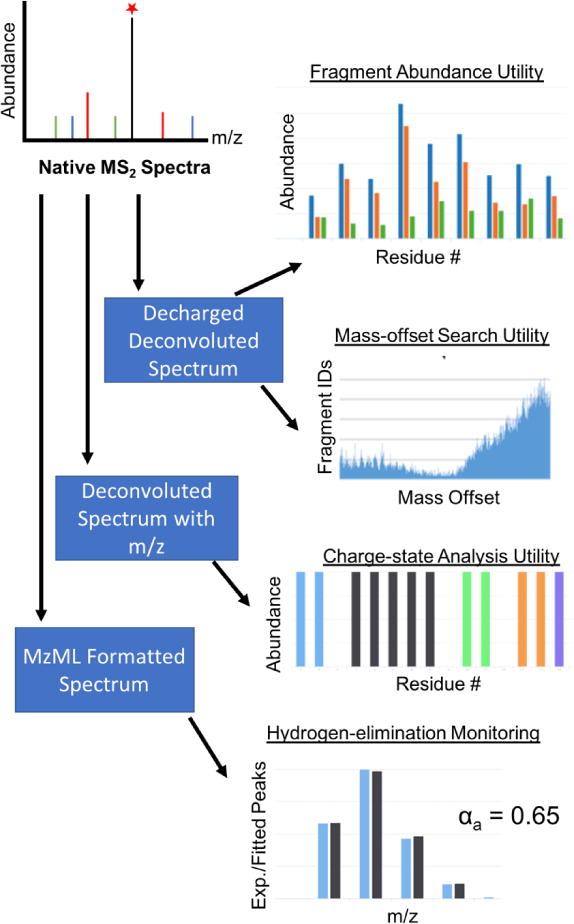
We present UV-POSIT, a set of web-based tools which facilitate the extraction of structural insights from UVPD mass spectra. The suite contains utilities for profiling the abundances and charge site distributions of fragment ions using mass and abundance lists from deconvoluted mass spectra as input, as well as a tool to perform the hydrogen-elimination monitoring (HEM, [8, 13]) analysis from a-type ions using a raw mzML-formatted mass spectrum (Figure 1).
Figure 1.

Overview of UV-POSIT software.
Implementation and Data Input
UV-POSIT has been implemented in Python using the Flask web framework and is hosted on the Heroku platform. The application utilizes the Python libraries NumPy and SciPy for searching, least-squares fitting, and array manipulation operations; the Pyteomics library for extracting peak data from mzML files; and the Celery library for processing iterative search jobs [14, 15]. The user interface is written in Javascript using the React.js library and bundled with Webpack.
The fragment abundance, charge state analysis, and mass-offset search utilities use two separate dialogs for input. The sequence dialog is used to upload an amino acid sequence, and the masses of static modifications can be added parenthetically after the modified residue. The data dialog is then used to input a set of tab-delimited mass and intensity data for each ion peak, as well as a set of options specific to the utility being used. Details of proper data formatting will be discussed in subsequent sections. Clicking the ‘Validate’ button in these dialogs triggers validation of the input; if validation fails, the user is alerted. In the fragment abundance and charge site tools, if both validations pass then the user interface seamlessly updates with the results of the analysis (Figure S1). Within the mass-offset search utility, successful validation enables the user to submit the search results to a Heroku Redis server for background processing, after which the user is prompted to download the search results as a .csv file. Data input in the HEM utility is similar but involves a single input dialog in which an mzML-formatted mass spectrum file is uploaded and an amino acid sequence is entered along with a set of configuration options.
Fragment Abundance Utility
The fragment abundance utility allows calculation and visualization of UVPD fragment ion abundances as a function of position along the peptide backbone. For an individual protein, this abundance information can be used as an indicator of backbone flexibility and conformational variations [5]. Practical applications have included the probing of conformational changes in dihydrofolate reductase upon NADPH binding [6, 12] and in K-RAS as a function of point mutations [9]. The utility supports normalization according to total ion chromatogram (TIC) intensity, so that spectra of the same protein under different conditions can be directly compared and sequence regions in which conformational changes occur can be easily identified.
To input spectral data, users paste tab-delimited list of monoisotopic masses and intensities generated from deconvolution of a high-resolution tandem mass spectrum (e.g. using THRASH or Thermo Xtract software). The program builds a library of potential fragment ions based on the input sequence containing R residues (where R is a whole number), then searches the uploaded mass list against this library with a user-specified mass or ppm error tolerance. For each amino acid position n in the sequence, the algorithm sums all an, bn, and cn ions originating from cleavage immediately C-terminal to the given residue along with all C-terminal xR-n+1, yR-n+1, and zR-n+1 ions originating from cleavage N-terminal to the residue. The summed fragment ion abundances for backbone cleavages adjacent to each residue are visualized as a bar plot which can be filtered to represent contributions from all fragment ion series or from N-terminal or C-terminal series alone (Figure S1B). The search results are also displayed in a spreadsheet view showing abundance information for each ion series at each residue position, which can be pasted into a spreadsheet analysis program for further data workup (Figure S1A). The abundances of apo and holo fragment ions can be displayed individually or their contributions can be summed to show backbone cleavage efficiency at each residue.
Charge State Analysis
The charge state analysis utility allows a user to map and visualize the charge sites in a peptide or protein based on the charge states of a and x fragment ions generated from UVPD. This method has application in the identification of charge site isomers in native mass spectrometry, which can be an indicator of conformational heterogeneity [7]. The utility takes as spectral input a list of tab-delimited values for each experimentally-observed fragment ion containing its monoisotopic mass, m/z value, and abundance in the UVPD spectrum (e.g. as output by the implementation of THRASH in ProsightPC 3.0). Using this information, the program assigns a charge to each fragment ion and constructs an array of masses corresponding to each possible charge state of that fragment. Each array is searched against a library of theoretical fragment ions generated from the input sequence. The result of the search is an array with the summed abundance of all experimentally-observed fragment ions for each combination of sequence position and charge state (Figure S2A).
When the search is completed, the display interface updates with a constant-height bar plot visualization of the charge states (Figure S2B). The charge-state contribution at each residue position is visualized as a set of stacked bars, with the height of the bars corresponding to the abundance of fragment ions found at each charge state.
Hydrogen Elimination Monitoring
Hydrogen loss from a-type fragment ions produced by UVPD is related to the hydrogen-bonding character of the amino acid directly N-terminal to the cleavage site that resulted in production of a-type ions from the selected peptide or protein precursor ion [8]. Quantitation of the extent of this hydrogen loss can therefore be used as a probe of hydrogen bonding interactions in gas-phase protein ions, giving insight into secondary and tertiary structure [9]. The hydrogen-elimination monitoring (HEM) utility searches for a-ion isotope envelopes in raw UVPD mass spectral data and determines the extent of hydrogen loss using a fitting routine. This program takes as input an amino acid sequence and a profile-mode mzML file corresponding to the UVPD mass spectrum of the peptide or protein of interest. The user specifies the charge of the precursor as well as a noise cutoff and minimum score for fitting. The Python library Pyteomics is used to read the mzML file into memory for processing [15].
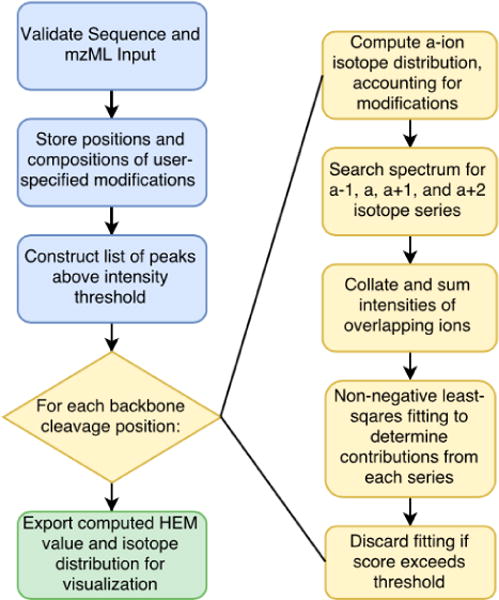
The algorithm used for detecting the isotope envelopes of a-type ions and fitting them is summarized in Figure 2. The profile mass spectrum is converted to an array of masses and abundances by including all relative abundance maxima above a user-specified noise cutoff. The masses and elemental compositions of all a-type ions are computed. For each fragment ion, theoretical isotope abundances are calculated using a fast Fourier transform method [16]. The abundances are filtered so that only isotopes with theoretical abundances above 10% of the base isotope peak are included in the search. A search space of expected isotopes is constructed for a-1, a, a+1, and a+2 ions and searched against the list of fragment ion masses. In the case of overlapping formula masses, unique values are summed at each position to generate an empirical isotope distribution. The SciPy implementation of non-negative least squares is used to fit the empirical isotope distribution to a linear combination of theoretical distributions for each possible mass-shifted a ion. Each fitting is assigned a score based on the peak-fit function [17]. The program output consists of an interactive spreadsheet view containing the charge, residue, HEM value, and score of each a-ion that exceeded the score threshold (Figure S3A). Each fit can be viewed as a clustered bar chart showing the empirical isotope distribution alongside the theoretical fitting generated by the least-squares algorithm (Figure S3B). Using this visualization, the user can manually inspect the quality of the fittings and discard any distributions for which a faulty fit was discovered. A warning is raised if the algorithm detects a relative minimum in the empirical isotope distribution, indicating the presence of an overlapping isotope distribution which may require manual processing.
Figure 2.

Flowchart representation of computations performed by the hydrogen elimination monitoring (HEM) utility.
Mass-Offset Search
The mass-offset searching utility is used to search a mass spectrum against a range of mass offset values in order to determine the masses of unidentified modifications (e.g., post-translational modifications, bound ligands, metal adducts) or to gauge the number of false positive fragment ion identifications generated by an absolute mass search under a certain set of tolerances [6,9,12]. The large number of fragment ion types generated by UVPD, as compared to ETD or CID, results in an immense search space of possible fragment ions and necessitates special care in choosing search parameters. This utility assists in parameter selection by generating a map of fragment identifications at a variety of offset masses (Figure S4A). The noise level in this map can be evaluated for different search conditions (e.g. PPM error tolerance) in order to gauge the trade-off between the number of fragment identifications and their confidence (Figure S4B).
To perform a mass offset search, the user inputs a sequence and deconvoluted peak list using the same formatting as in the abundance calculator. A search range is then defined by entering a first mass, last mass, and mass increment. When the input is validated, the search job is submitted to the back-end server. The algorithm begins by constructing a library of mass-shifted fragment ions by adding the first mass in the search range to each canonical fragment ion, then searching the library against the inputted spectral data. The fragment ion matches are counted in total and for each individual ion series and recorded. Each mass in the search space is then raised by the user-defined mass increment, and the process is repeated iteratively until the mass increment exceeds the final mass in the range. The result is a tabulation of the number of fragment identifications as a function of the mass shift value. This result can be downloaded by the user as a CSV-formatted text file. Maxima in the plot of fragment identifications vs. mass shift correlate to potential modifications which can be further scrutinized using a fragment-mapping tool such as Prosight Lite [18]. The noise between peaks corresponds to a baseline of false positive fragment matches arising from searching with mass shifts that do not correspond to real chemical modifications.
The suite of tools available in UV-POSIT is available to streamline data analysis for those utilizing ultraviolet photodissociation for native MS applications.
Supplementary Material
Acknowledgments
Funding from the NIH (R01GM121714 and 1K12GM102745 (fellowship to MBC)) and the Robert A. Welch Foundation (F-1155) is acknowledged.
References
- 1.Boeri Erba E, Petosa C. The emerging role of native mass spectrometry in characterizing the structure and dynamics of macromolecular complexes: The Emerging Role of Native Mass Spectrometry. Protein Sci. 2015;24:1176–1192. doi: 10.1002/pro.2661. [DOI] [PMC free article] [PubMed] [Google Scholar]
- 2.Lorenzen K, van Duijn E. Native Mass Spectrometry as a Tool in Structural Biology. In: Coligan JE, Dunn BM, Speicher DW, Wingfield PT, editors. Current Protocols in Protein Science. John Wiley & Sons, Inc; Hoboken, NJ, USA: 2010. [DOI] [PubMed] [Google Scholar]
- 3.Heck AJR, van den Heuvel RHH. Investigation of intact protein complexes by mass spectrometry. Mass Spectrom Rev. 2004;23:368–389. doi: 10.1002/mas.10081. [DOI] [PubMed] [Google Scholar]
- 4.O’Brien JP, Li W, Zhang Y, Brodbelt JS. Characterization of native protein complexes using ultraviolet photodissociation mass spectrometry. J Am Chem Soc. 2014;136:12920–12928. doi: 10.1021/ja505217w. [DOI] [PMC free article] [PubMed] [Google Scholar]
- 5.Cammarata MB, Brodbelt JS. Structural characterization of holo- and apo-myoglobin in the gas phase by ultraviolet photodissociation mass spectrometry. Chem Sci. 2015;6:1324–1333. doi: 10.1039/C4SC03200D. [DOI] [PMC free article] [PubMed] [Google Scholar]
- 6.Cammarata MB, Thyer R, Rosenberg J, Ellington A, Brodbelt JS. Structural Characterization of Dihydrofolate Reductase Complexes by Top-Down Ultraviolet Photodissociation Mass Spectrometry. J Am Chem Soc. 2015;137:9128–9135. doi: 10.1021/jacs.5b04628. [DOI] [PubMed] [Google Scholar]
- 7.Morrison LJ, Brodbelt JS. Charge site assignment in native proteins by ultraviolet photodissociation (UVPD) mass spectrometry. The Analyst. 2016;141:166–176. doi: 10.1039/C5AN01819F. [DOI] [PMC free article] [PubMed] [Google Scholar]
- 8.Morrison LJ, Rosenberg JA, Singleton JP, Brodbelt JS. Statistical Examination of the a and a + 1 Fragment Ions from 193 nm Ultraviolet Photodissociation Reveals Local Hydrogen Bonding Interactions. J Am Soc Mass Spectrom. 2016;27:1443–1453. doi: 10.1007/s13361-016-1418-9. [DOI] [PMC free article] [PubMed] [Google Scholar]
- 9.Cammarata MB, Schardon CL, Mehaffey MR, Rosenberg J, Singleton J, Fast W, Brodbelt JS. Impact of G12 Mutations on the Structure of K-Ras Probed by Ultraviolet Photodissociation Mass Spectrometry. J Am Chem Soc. 2016;138:13187–13196. doi: 10.1021/jacs.6b04474. [DOI] [PubMed] [Google Scholar]
- 10.Morrison LJ, Brodbelt JS. 193 nm Ultraviolet Photodissociation Mass Spectrometry of Tetrameric Protein Complexes Provides Insight into Quaternary and Secondary Protein Topology. J Am Chem Soc. 2016;138:10849–10859. doi: 10.1021/jacs.6b03905. [DOI] [PMC free article] [PubMed] [Google Scholar]
- 11.Tamara S, Dyachenko A, Fort KL, Makarov AA, Scheltema RA, Heck AJR. Symmetry of Charge Partitioning in Collisional and UV Photon-Induced Dissociation of Protein Assemblies. J Am Chem Soc. 2016;138:10860–10868. doi: 10.1021/jacs.6b05147. [DOI] [PMC free article] [PubMed] [Google Scholar]
- 12.Cammarata M, Thyer R, Lombardo M, Anderson A, Wright D, Ellington A, Brodbelt JS. Characterization of trimethoprim resistant E. coli dihydrofolate reductase mutants by mass spectrometry and inhibition by propargyl-linked antifolates. Chem Sci. 2017;8:4062–4072. doi: 10.1039/C6SC05235E. [DOI] [PMC free article] [PubMed] [Google Scholar]
- 13.Morrison LJ, Chai W, Rosenberg JA, Henkelman G, Brodbelt JS. Characterization of hydrogen bonding motifs in proteins: hydrogen elimination monitoring by ultraviolet photodissociation mass spectrometry. Phys Chem Chem Phys. 2017;19:20057–20074. doi: 10.1039/C7CP04073C. [DOI] [PMC free article] [PubMed] [Google Scholar]
- 14.Jones E, Oliphant T, Peterson P, et al. SciPy: Open source scientific tools for Python. 2001 [Google Scholar]
- 15.Goloborodko AA, Levitsky LI, Ivanov MV, Gorshkov MV. Pyteomics–a Python framework for exploratory data analysis and rapid software prototyping in proteomics. J Am Soc Mass Spectrom. 2013;24:301–304. doi: 10.1007/s13361-012-0516-6. [DOI] [PubMed] [Google Scholar]
- 16.Rockwood AL. Relationship of Fourier transforms to isotope distribution calculations. Rapid Commun Mass Spectrom. 1995;9:103–105. doi: 10.1002/rcm.1290090122. [DOI] [Google Scholar]
- 17.Jaitly N, Mayampurath A, Littlefield K, Adkins JN, Anderson GA, Smith RD. Decon2LS: An open-source software package for automated processing and visualization of high resolution mass spectrometry data. BMC Bioinformatics. 2009;10:87. doi: 10.1186/1471-2105-10-87. [DOI] [PMC free article] [PubMed] [Google Scholar]
- 18.Fellers RT, Greer JB, Early BP, Yu X, LeDuc RD, Kelleher NL, Thomas PM. ProSight Lite: Graphical software to analyze top-down mass spectrometry data. PROTEOMICS. 2015;15:1235–1238. doi: 10.1002/pmic.201400313. [DOI] [PMC free article] [PubMed] [Google Scholar]
Associated Data
This section collects any data citations, data availability statements, or supplementary materials included in this article.


