Alternative Complex III (ACIII) is a key component of the respiratory and/or photosynthetic electron transport chains of many bacteria1–3. Like Complex III (bc1 complex), ACIII catalyzes the oxidation of membrane-bound quinol and reduction of cytochrome c or an equivalent electron carrier. However, the two complexes have no structural similarity4–7. Although ACIII has eluded structural characterization, several of its subunits are homologous to members of the CISM (Complex Iron-Sulfur Molybdoenzyme) superfamily8, including the proton pump polysulfide reductase9,10. We isolated the ACIII from Flavobacterium johnsoniae with native lipids using styrene maleic acid (SMA) copolymer11–14, both as an independent enzyme and as a functional 1:1 supercomplex with an aa3-type cytochrome c oxidase (cyt aa3). We determined the structure of ACIII to 3.4 Å resolution by cryo-EM and constructed an atomic model for its six subunits. The structure, which contains a [3Fe-4S] cluster, a [4Fe-4S] cluster, and six hemes c, shows that ACIII employs known elements from other electron transport complexes arranged in a previously unknown manner. Modeling of the cyt aa3 component of the supercomplex revealed that it is structurally modified to facilitate association with ACIII, illustrating the importance of the supercomplex in this electron transport chain. The structure also resolves two of the subunits of ACIII that are anchored to the lipid bilayer with N-terminal triacylated cysteine residues, an important post-translational modification found in numerous prokaryotic membrane proteins that has not previously been observed structurally in a lipid bilayer.
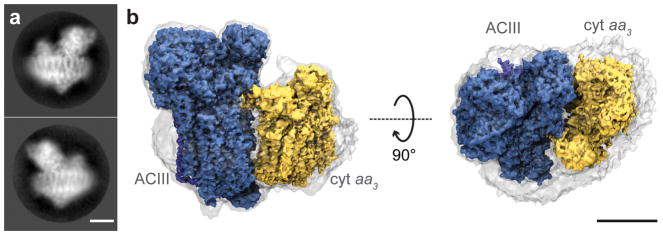
The ACIII-cyt aa3 supercomplex from F. johnsoniae membranes was solubilized, purified, and biochemically characterized using styrene maleic acid (SMA) copolymer nanodiscs without traditional detergents (Supplementary Discussion, Extended Data Fig. 1–3). The supercomplex catalyzes the two-electron oxidiation of menaquinol (or ubiquinol) and the four-electron reduction of O2 to water with a turnover number of ~21 electrons/sec without the addition of exogenous cyt c (Supplementary Information, Extended Data Fig. 3), indicating a functional electron transfer chain within the supercomplex. The addition of exogeneous cyt c did not increase the rate of electron transfer. The structure of the ACIII-cyt aa3 supercomplex in SMA nanodiscs was determined by cryo-EM (Fig. 1, Extended Data Fig. 4). The supercomplex has a mass of 464 kDa (Supplementary Discussion), a transmembrane cross-section of ~9 nm × 13 nm (Extended Data Fig. 5), and contains 48 transmembrane α-helices. To our knowledge, the ACIII-aa3 supercomplex is the largest protein complex reported to be contained within an SMA copolymer nanodisc. The SMA copolymer and lipids contribute only a thin layer of density around the supercomplex (Fig. 1a and 1b), which is not circular but follows the contours of the protein. Whether this is a general feature of SMA-solubilized proteins or is due to the large size of the ACIII-aa3 supercomplex is not known, and will be clarified when more structures are determined using this approach. The number of loosely bound, unresolved lipid molecules is not known, nor whether they are in sufficient number to form a true bilayer surrounding the protein. The SMA-supercomplex nanodiscs retain native lipids, are more stable, and have 30% higher specific activity than the supercomplex isolated with detergents (e.g., dodecylmaltoside) (Supplementary Discussion, Extended Data Fig. 3). Since traditional detergents are avoided in generating SMA nanodiscs, the preparative protocol is relatively rapid and simpler than making nanodiscs using the membrane scaffold protein (MSP).
Figure 1.
Cryo-EM of ACIII-cyt aa3 supercomplex in SMA nanodisc. a, Two representative 2-D class average images of the ACIII-cyt aa3 supercomplex in a nanodisc. Calculation of 2-D class averages was not repeated. b, Side and top views of the ACIII-cyt aa3 supercomplex cryo-EM map. The transparent surface indicates the boundary of the nanodisc. Scale bars, 50 Å.
While the properties of the SMA nanodiscs are less well characterized than nanodiscs made with membrane scaffolding protein13,15, our work demonstrates the utility of SMA nanodiscs for high-resolution structural studies of membrane proteins.
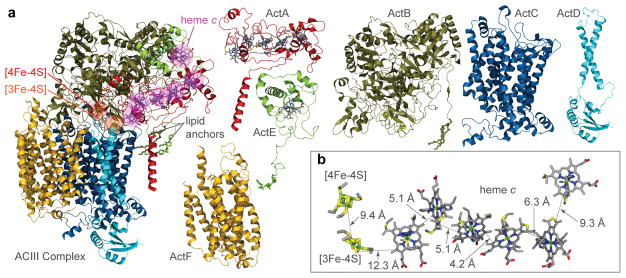
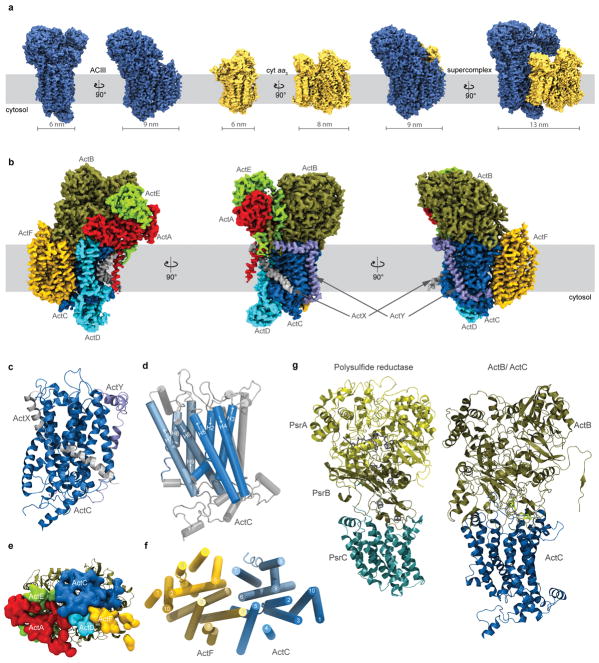
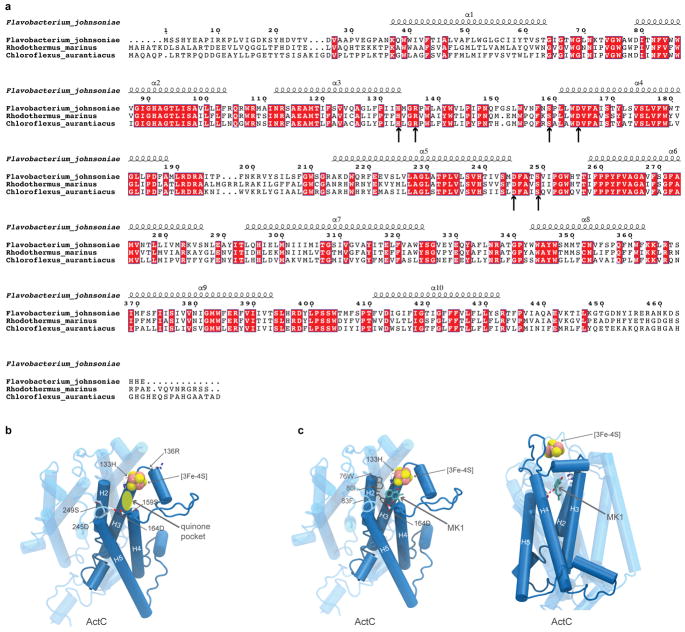
The resolution of the cryo-EM density map allowed construction of an atomic model for > 90% of the sequences predicted from the ACIII gene cluster (Supplementary Discussion), including subunits ActA, ActB, ActC, ActD, ActE, and ActF (Fig. 2 and Extended Data Fig. 5, Extended Data Table 1). Sequence analysis shows that ACIII contains a unique combination of known modules from other respiratory complexes3 (Supplementary Discussion). The ACIII structure confirms this prediction and shows the structure responsible catalyzing the quinol:cytochrome c oxidoreductase activity. The ACIII structure can be divided into three parts: (i) a core assembly of ActC and ActB that oxidizes quinol; (ii) A heme c assembly consisting of ActA and ActE that directs electron from ActB to the terminal electron acceptor; and (iii) Auxiliary transmembrane subunits ActD and ActF with unknown functions. With some key differences (Extended Data Fig. 5), the overall architecture of ActB and ActC resembles the PsrA/PsrB and PsrC subunits of polysulfide reductase from Thermus thermophilus (PsrABC)16, a member of the CISM superfamily (Supplementary Discussion). Like PsrC, ActC contains no cofactors but does contain the proposed site for menaquinol oxidation. Residues at the menaquinol binding site identified in PsrC16 are not conserved in ActC17. Although menaquinone is not observed in the cryo-EM map, we propose that His133C and Asp164C form the menaquinol binding site in ActC near the interface with ActB (Extended Data Fig. 6). These two residues are conserved in ActC sequences and there is a crevice between TM3 and TM4 of ActC that would provide access to the substrate in the membrane bilayer.
Figure 2.
Atomic model of ACIII. a, The overall structure is shown (Left) along with separate views of individual subunits. Covalently bonded cysteines are shown along with the core iron sulfur clusters (circled). Both covalently linked cysteines and axial coordinating residues are shown for hemes (circled). b, Edge-to-edge distances between cofactors.
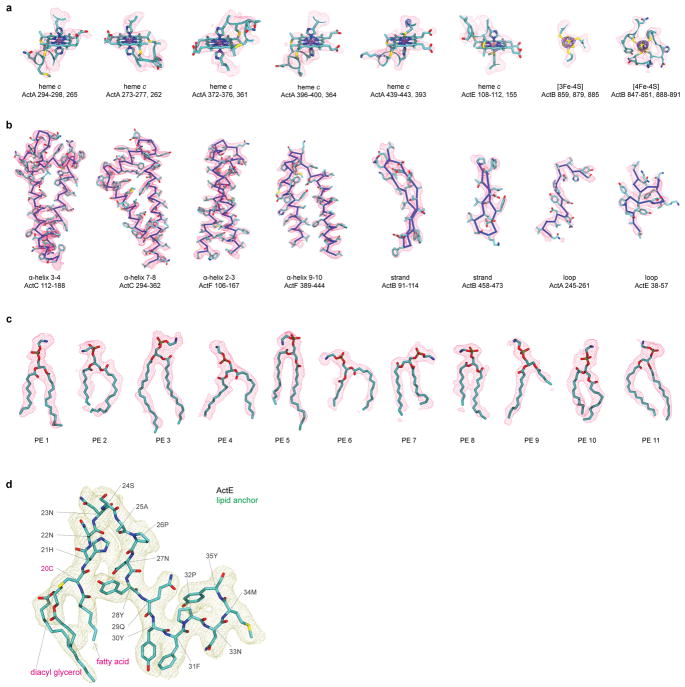
The N-terminal portion of ActB is homologous to the PsrA subunit of polysulfide reductase, which contains the molybdenum cofactor, but the molybdenum cofactor is absent in ActB4. The C-terminal domain of ActB is homologous to PsrB and both ActB and PsrB contain Fe-S clusters. Like PsrB, ActB from F. johnsoniae is expected to contain 4 [Fe-S] clusters, but only two are observed in the cryo-EM map (Extended Data Fig. 7). There is one [3Fe-4S] cluster near the interface with ActC, about 10 Å from the proposed site of menaquinol oxidation, and one [4Fe-4S] cluster about 9 Å further away. There are two additional cysteine clusters present in the structure of ActB, but the cryo-EM map does not show [Fe-S] clusters at these locations. Instead, we observe disulfide bonds (Cys965B/Cys938B and Cys971B/Cys769B) within these two cysteine clusters. Substitution of proposed [4Fe-4S] clusters by disulfide bonds may be a genuine aspect of the structure or may be due to oxidation that occurred during sample preparation. However, if these two “missing” [4Fe-4S] clusters were present, they would form a dead-end for electron transfer from the [3Fe-4S] cluster of ActB suggesting that their absence from the structure is not an artifact.
The [3Fe-4S] cluster in ActB is the most probable initial oxidant of menaquinol bound to ActC, and is 12.3 Å from the nearest heme c in ActA. The five hemes c in ActA plus the single heme c in ActE form a likely electron transfer wire from the [3Fe-4S] cluster in ActB, with the largest edge-to-edge distance of 9.2 Å between adjacent hemes (Fig. 2b). The [4Fe-4S] cluster in ActB appears to be off-pathway and its function remains to be determined.
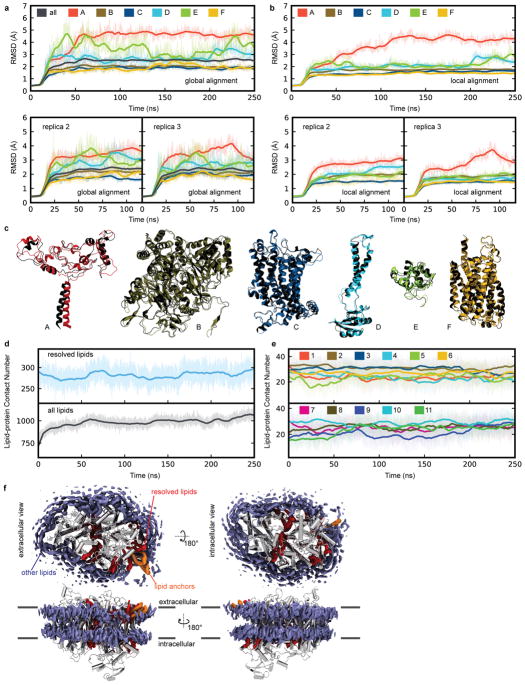
In all Flavobacteria, including F. johnsoniae, ActA is predicted to have a monoheme domain at the N terminus in addition to the pentaheme domain at the C terminus (Supplementary Discussion). Mass spectrometry analysis shows that the N-terminal monoheme domain is present in the preparation (Extended Data Fig. 1), but no density can be assigned to this entire domain. The inability to resolve the monoheme domain may result from flexibility of the domain. Full-atom molecular dynamics (MD) simulations were performed for the entire structure of ACIII embedded in a phospholipid bilayer to determine the stability and dynamics of the structure (Extended Data Fig. 8). Interestingly, the pentaheme domain of ActA had the largest root-mean-square deviation (RMSD), which is mainly from the transmembrane α-helix connected to the missing monoheme domain, consistent with the monoheme domain being unobservable due to a variable position in the complex. While ActE also had a significant RMSD, that did not appear to correlate with disorder in the cryo-EM map.
ActD and ActF are transmembrane subunits without bound cofactors, and both interact with ActC. It has not been established if ACIII generates a proton motive force coupled to electron transport18. The absence of redox centers in ActC, ActD and ActF suggests that if ACIII contributes to the transmembrane proton gradient, it does not use the bifurcation-type Q cycle mechanism of canonical Complex III19, but instead uses a true proton pump mechanism like Complex I20. ActD has two transmembrane α-helices that cross within the membrane and are adjacent to ActC. Both N- and C-termini are within the cytoplasm and combine to form a single globular domain that rests on the cytoplasmic surface of ActC. The ten transmembrane α-helices of ActF form a pseudo two-fold axis of symmetry with the ten transmembrane α-helices of ActC (Extended Data Fig. 5) despite the fact that ActF has less than 20% sequence identity with ActC. If ACIII is a proton pump, it is likely that conserved polar residues within the bilayer will play important roles.
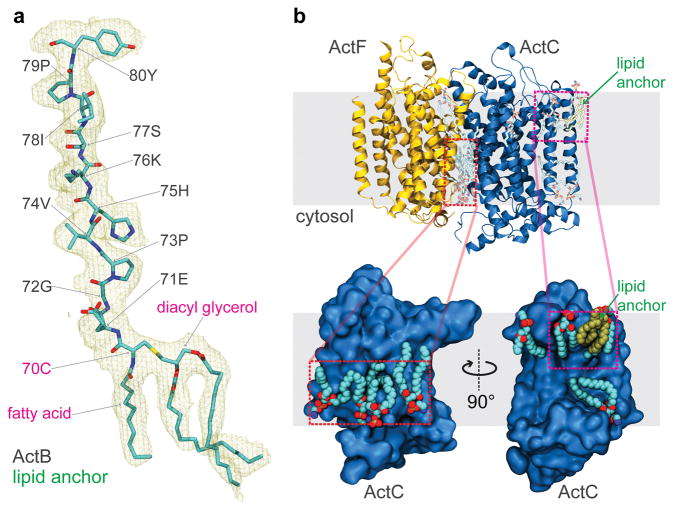
The structure of ACIII reveals eleven ordered phospholipid molecules as well as triacylated cysteine residues at the N termini of ActB (Fig. 3a) and ActE (Extended Data Fig. 7). Anchoring of bacterial membrane proteins by an N-terminal triacylated cysteine is a well characterized phenomenon21 but, to our knowledge, this is the first time the structure of a triacylated cysteine residue has been determined in the context of a membrane protein. Surprisingly, both lipid anchors are tilted with respect to the plane of the lipid bilayer (Fig. 2a), restricting the ability of other lipids to pack around them. This feature could alter the mechanical properties of the adjacent portion of the membrane bilayer and also guide conformational changes in the ACIII protein. Remarkably, the two N-terminal lipid anchors are adjacent to each other in the membrane. These lipid anchors likely help ACIII to assemble and keep the monoheme ActE bound to the complex. The eleven lipids that are resolved adjacent to the transmembrane α-helices accommodate the rugged protein surface of the complex (Fig. 3b and Extended Data Fig. 7). The headgroups of the lipids could not be identified and they were all modeled as phosphatidylethanolamine. There are two “hot spots” for resolved lipids: (i) The cytoplasmic interface between ActC and ActF; and (ii) The vicinity of the triacylated cysteine of ActB, which is near the proposed entry point for menaquinol into the complex. All eleven of the resolved lipids remained bound to the protein throughout 250 ns of MD simulation (Extended Data Fig. 8), supporting the ability of SMA-nanodiscs to preserve some native lipid-protein interactions and suggesting a functional role for the lipids. A large number of annular lipids, including those modelled in the structure, were observed to associate with the protein from the in silico bilayer.
Figure 3.
Lipids in the structure of ACIII. a, Triacylated cysteine at the N terminus of ActB. The triacylated cysteine and its downstream ten amino acid residues are shown in the context of the experimental density map. b, Other resolved lipids near the transmembrane α-helices. Four lipid molecules are resolved at the cytoplasmic interface between ActC and ActF. Besides, two lipid molecules clustered near the triacylated cysteine from ActB, right above the proposed quinone entry pathway.
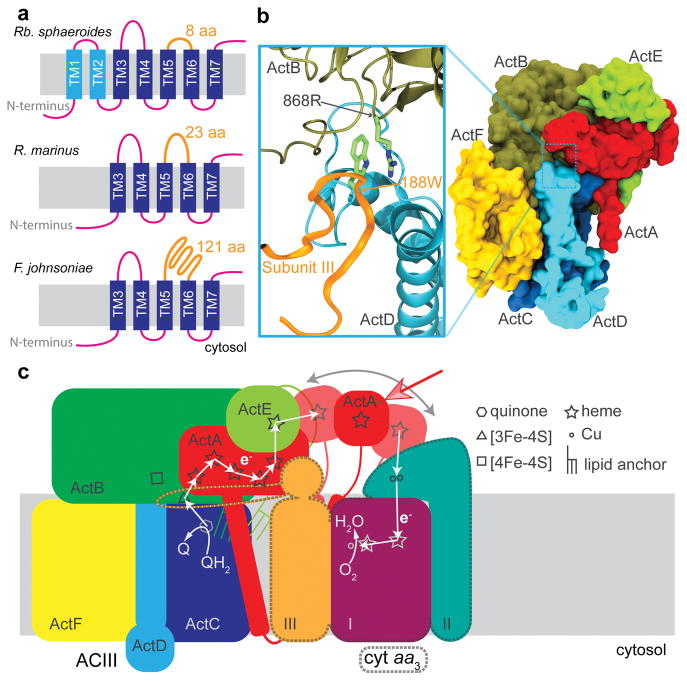
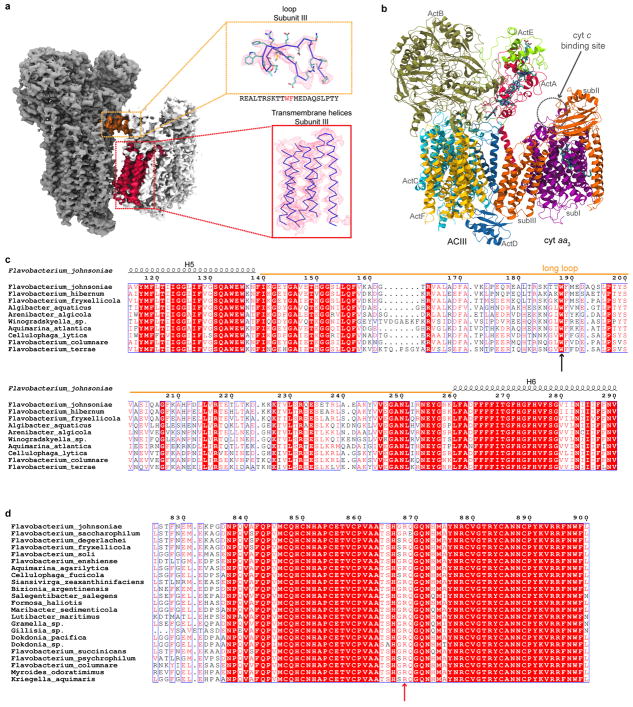
Frequently, the subunits encoding ACIII are within an operon that includes subunits of an associated Complex IV3 (cyt aa3 or cyt caa3). We find that the sequences of subunit III from Complex IVs that are associated with ACIII have unusual features that distinguish them from the canonical subunit III (Supplementary Discussion). Whereas subunit III of Complex IV generally contains seven transmembrane α-helices, those that are associated with ACIII lack TM1 and TM2 (Fig. 4a). While only parts of subunit III of cyt aa3 are resolved at better than 4 Å, the density for cyt aa3 has sufficient resolution to identify five α-helices from the structure. A homology model of subunit III from F. johnsoniae cyt aa3 was built based on the structure of TM3 to TM7 of subunit III from Rhodobacter sphaeroides cyt aa3 and fit into the ACIII-cyt aa3 supercomplex density map (Extended Data Fig. 9) with high fidelity. The deletion of the first two transmembrane α-helices in subunit III of cyt aa3 appears to be a necessary adaptation to allow formation of the supercomplex with ACIII. It is interesting that the same two helices in subunit III are also absent in the cyt aa3 obligatory bcc-cyt aa3 supercomplex found in Actinobacteria (e.g., Corynebacterium glutamicam and Mycobacterium tuberculosis) 22
Figure 4.
ACIII-cyt aa3 supercomplex in Flavobacterium johnsoniae. a, Topology comparison of subunit III of cyt aa3. b, Tryptophan 188 from the subunit III loop (orange) of cyt aa3 interacts with arginine 868 from the subunit B of ACIII. The surface presentation of ACIII on the right shows the binding pocket for the subunit III loop. c, Working model for electron transfer in the ACIII-cyt aa3 supercomplex.
The sequence analysis also reveals that the loop between TM5 and TM6 of subunit III in the cyt aa3 that is part of the supercomplex is much longer in F. johnsoniae (and all Flavobacteria) than in other organisms. Typically, this loop contains eight residues, but in F. johnsoniae, it contains 121 residues (Fig. 4a). Part of this long loop fits in a groove between ActB and ActD of ACIII on the periplasmic side of the membrane (Extended Data Fig. 9). The structural model reveals a π-cation interaction between Trp188 of subunit III and Arg868 of ActB (Fig. 4b), both of which are conserved among organisms containing subunit III with a long loop between TM5 and TM6 (Extended Data Fig. 9). This specific and strong interaction stabilizes the ACIII-cyt aa3 supercomplex and appears to be a second adaptation that enables supercomplex formation with ACIII. The contact between the periplasmic loop of subunit III of cyt aa3 and ACIII is the only observed direct contact between the two complexes. The five well-resolved transmembrane α-helices of subunit III of cyt aa3 are angled away from ACIII with only the tip of TM6 of subunit III touching ActF, forming a wedge-like space between the membrane domains of ACIII and cyt aa3. The fall-off of resolution in the portions of cyt aa3 that are distant from the interface with ACIII suggests that there may be multiple conformations of the supercomplex that are all tethered by the loop in cyt aa3. The loop could, therefore, serve as a hinge, allowing the membrane domains of ACIII and cyt aa3 to swing into contact transiently.
Using the location of TM3 to TM7 of subunit III within the supercomplex as a guide allows a model of the entire cyt aa3 to be placed within the density map for the supercomplex (Extended Data Fig. 9). In the resulting model, there is a considerable distance (56 Å) between the heme c in ActE and CuA within subunit II of cyt aa3. Electron transfer within the supercomplex does not require the addition of exogenous cyt c, which is also the case for the bcc-cyt aa3 supercomplex from Corynebacterium glutamicum23. It is possible, though it seems unlikely, that there is a subset of conformations in which ActE comes close enough to cyt aa3 for direct electron transfer. It is noteworthy that the monoheme domain of ActA has substantial sequence homology (~30% identity) with the heme c domain that is present at the C terminus of subunit II of cyt caa3 from Thermus thermophilus. This observation suggests that the ActA monoheme domain, which we postulate to be highly mobile in the structure (see above), may be able to interact with subunit II of cyt aa3 and shuttle electrons from the ActE monoheme domain to subunit II of cyt aa3. Hence, electron transfer within the supercomplex may require the monoheme domain of ACIII to swing back and forth between ACIII and cyt aa3 to shuttle electrons (Fig. 4c). Additional experimental work will be required to test this model and, indeed, to determine the physiological advantage of forming the supercomplex.
METHODS
Bacterial strain and growth conditions
Flavobacterium johnsoniae ATCC 17061™ strain UW101 was used in this study. The strain was a kind gift from Dr. Mark McBride at the University of Wisconsin, Milwaukee. The cells were grown in casitone-yeast extract (CYE) medium at 30 °C under high aerobic conditions (500 ml cultures in 2 L flasks) 24.
Membrane preparation and protein purification
Cells grown overnight were collected by centrifugation (14,000 × g for 10 min). The cell pellet from 12 L of culture (~2.5 g/L) was resuspended in ~200 ml of 20 mM Tris-HCl buffer, pH 8 (buffer A) with 5 mM MgSO4, DNAse I (Sigma) and a protease inhibitor cocktail (Sigma). This suspension was passed three times through a Microfluidizer at a pressure of 80,000 psi to disrupt the cells. The cell extract was centrifuged at 14,000 × g for 10 min to remove unbroken cells. Membranes were obtained after centrifugation at 185,500 × g for 4 h. Under the above growth conditions, the membranes contained ACIII, cyt aa3 and cyt bd. The membrane pellet was solubilized by using either a traditional detergent or the SMA copolymer.
Purification using Triton X-100 and DDM
The membrane pellet was resuspended in buffer A (~50 mg/ml) along with 300 mM NaCl, and solubilized by the addition of Triton X-100 (Fisher Scientific) to a final concentration of 4%. The solution was incubated at 4 °C for 2 h with mild agitation. The suspension was cleared by centrifugation at 185,500 × g for 1h, after which the detergent was diluted 4-fold by adding three volumes of buffer A to the supernatant. The diluted supernatant was then added to a chromatography column containing 10 ml of Ni-NTA resin (Qiagen) pre-equilibrated with 20 mM Tris-HCl pH 8 containing 0.05% Triton X-100 and 0.15 M NaCl (buffer B). The resin was washed with about 10 column volumes of buffer B to remove any unbound sample. Detergent exchange to DDM (Anatrace) was carried out by washing with buffer B containing 0.05% DDM instead of Triton X-100 (buffer C). The column was further washed with 5 column volumes of buffer C containing 10 mM imidazole to remove the loosely bound proteins from the resin. The proteins that were well bound to the resin were eluted using 100 mM imidazole in buffer C. The eluent was concentrated to ~3 ml using Amicon Ultra-15 filters (Millipore) with a 100 kDa cutoff. The excess imidazole was removed by dialysis against buffer C. The yield of protein obtained was about 0.3 mg/L of ACIII and 0.16 mg/L of cyt aa3 from 12 L of culture. When indicated, the proteins were further purified by gel filtration chromatography using Superdex 200 10/300 GL (GE Healthcare Life Sciences). The purified proteins were stored at −80 °C after adding glycerol to a final concentration of 10%.
Purification using SMA copolymer
The SMA copolymer SMA® 3000HNA (styrene maleic acid copolymer ca. 3:1 molar ratio of styrene:maleic acid) was kindly provided as a gift from Dr. Terry Bricker (Louisiana State University, Baton Rouge, LA) who used SMA copolymer made by Cray Valley USA LLC (now Total Petrochemicals & Refining USA Inc.) successfully for the studies of photosystem from spinach thylakoids25. Additional SMA® 3000HNA was kindly provided by Total Petrochemicals & Refining USA (Houston, TX) as an aqueous solution of 25.6% (w/v) SMA. We also used a similar product, Xiran SL25010 S25, kindly provided by Polyscope Polymers B. V., with similar results. These polymer preparations are provided as aqueous solutions of the sodium salt, and the polymer solutions were simply diluted to the final desired percentage to use directly for solubilization of membranes. The purification protocol with the SMA copolymer was similar to that described with detergents with the following differences. After the membrane pellet was resuspended, the SMA solution was added dropwise to a final concentration of 1% with continuous stirring. After incubation for 1 h at room temperature, the solution was centrifuged at 185,500 × g for 1 h to remove unsolubilized particles. The supernatant was loaded directly to the Ni-NTA column equilibrated with 20 mM Tris-HCl pH 8, 0.15 M NaCl. The remaining steps of the purification were as described above. Following solubilization of the membrane suspension with 1% SMA 3000HNA, no additional SMA or detergents were added and were not needed to maintain the solubilized proteins in solution. The yield of protein after the use of the SMA copolymer for solubilization was about 0.5 mg/L for ACIII and about 0.15 mg/L for cyt aa3 from 12 L of culture.
Analytical methods
The total protein concentration was determined using the BCA kit (Thermo Scientific, Pierce Protein Research Products). The UV–visible spectra of the oxidized and reduced proteins were recorded on an Agilent Technologies spectrophotometer (model 8453). The pyridine hemochrome assay26 was used to determine the concentration of hemes present in the protein samples. The total heme c concentration was divided by seven to calculate the ACIII concentration and the total heme a concentration was divided by two to calculate the cyt aa3 concentration. The purified protein was analyzed by SDS-PAGE using 4-20% precast gels (Nusep Tech). Heme staining was carried out using 3,3′,5,5′-tetramethyl benzidene (TMBZ) 27. The supercomplex was visualized by blue native PAGE (BN-PAGE) using a 4–16% gel (Novex, Life Technologies) with Bis-Tris buffer. The entire gel was stained with Coomassie blue, and then fixed with 30% methanol and 10% glacial acetic acid. The gel was destained with 8% glacial acetic acid to visualize the bands. Peptide mass spectrometry and analyses was carried out by Dr. Peter Yau at the Roy J. Carver Biotechnology Center (CBC) at the University of Illinois at Urbana-Champaign.
Oxygen consumption assay
Oxygen consumption was measured using a Clark electrode (Strathkelvin) in a 1 ml chamber at 25 °C as described in 28. The reaction mix consisted of 100 μM ubiquinone-1 (Q1) (Sigma-Aldrich) and 5 mM dithiothreitol (DTT) in air-saturated 0.1 M potassium phosphate buffer, pH 7.5 with 150 mM NaCl. The reaction was started by adding the purified protein into the chamber. The initial concentration of oxygen was calculated to be 237 μM.
Quinol:cytochrome c oxidoreductase activity
The quinol:cytochrome c oxidoreductase activity of the ACIII was measured spectrophotometrically as described in 29. The reaction was carried out in a 2 ml anaerobic cuvette, at 25 °C in 50 mM potassium phosphate buffer, pH 7.5 in the presence of 50 μM horse heart cytochrome c (Sigma-Aldrich) and 200 μM KCN. Ubiquinol-1 (Q1H2) or reduced vitamin K2 (Sigma-Aldrich) were used as quinol substrates and, in each case, the quinone was reduced using sodium borohydride according to the method by Ragan30. The reaction was started by the addition of 100 μM of reduced quinone.
EPR spectroscopy
The purified ACIII-cyt aa3 supercomplex was extensively dialyzed against 20 mM Tris-HCl buffer, pH 8, with 150 mM NaCl and 1 mM EDTA to eliminate adventitious transition metal ions. The sample was concentrated in an Amicon filter to 150 μl with a final ACIII concentration of ~60 μM. The air-oxidized sample was directly transferred to an X-band EPR tube and subsequently frozen in liquid nitrogen. The sample was oxidized completely by the addition of 2 mM potassium ferricyanide. Glycerol (5%) was present in all EPR samples. Continuous Wave (CW) EPR measurements were carried out on an X-band Varian EPR-E122 spectrometer at the Electron Paramagnetic Resonance facility at the University of Illinois at Urban-Champaign. Cryogenic conditions below 77 K were achieved with a Lakeshore 331 temperature controller using a regulated flow of helium gas.
Metal Analysis
Metal Analysis was carried out using inductively coupled plasma mass spectrometry (ICP-MS) as previously described31,32.
Optical Redox Titration
Full spectrum UV-visible redox titrations were performed to determine the midpoint potentials ( ) of the redox-active cytochromes in the DDM-solubilized ACIII-cyt aa3 supercomplex33,34. The purified supercomplex was suspended in 4 ml of 50 mM potassium phosphate buffer (pH 7.0) to a concentration of 3 μM with 25 μM each of following redox mediators; benzyl viologen (Em,7 = −350 mV), anthraquinone-2-sulfonate (Em,7 = −225 mV), 2-hydroxy-1,4-naphthoquinone (Em,7 = −220 mV), 9,10-anthroquinone-2,6-disulfonate (Em,7 = −185 mV), duroquinone (Em,7 = 5 mV), N-ethylphenazonium ethosulfate (Em,7 = 65 mV), N-methylphenazonium methosulfate (Em,7 = 85 mV), diaminodurene (Em,7 = 275 mV), 2,6-dimethyl benzoquinone (Em,7 = 180 mV), 1,2-napthoquinone (Em,7 =143 mV), 1,4-napthoquinone (Em,7 = 36 mV) and potassium ferricyanide (Em,7 = 435 mV) 35.Titrations were performed with an anaerobic stirred cuvette and the solution potential was adjusted by injecting aliquots of 10 mM sodium dithionite or potassium ferricyanide as reductant and oxidant, respectively. Spectra were taken at approximately 10–20 mV increments over the titration range indicated. Spectroscopic changes of the α-bands of the hemes upon reduction or oxidation were monitored at the peak maxima to determine the midpoint potentials of each class of heme center. The data sets were analyzed using Origin™ (Origin Lab Corporation) to determine spectral components and fit titration curves using the Nernst equation35.
EM sample preparation
Holey carbon film-coated EM grids were nanofabricated with regular arrays of 500 to 800 nm holes36 and coated with an additional layer of gold. Cryo-EM specimens were prepared with a FEI Vitrobot grid preparation robot at 4 °C and 100 % humidity by applying 3 μl of sample (3 mg/ml) to glow-discharged grids, allowing the grids to equilibrate for 1 s, and blotting for 12 s before freezing in a liquid ethane/propane mixture (1:1 v/v)37. Grids were subsequently stored in liquid nitrogen before shipping to the New York Structural Biology Center for imaging with a FEI Titan Krios electron microscope equipped with a Gatan K2 Summit camera and automated with Leginon38.
EM data acquisition
Movies were acquired in electron counting mode with a pixel size of 1.1 Å, an exposure rate of 7.4 electrons/pixel/s, and a total exposure time of 10 s divided in 40 frames (418 movies) or 50 frames (1599 movies). Frame alignment and exposure weighting were performed with Motioncor239. After screening averages from the aligned movies, 475 movies were discarded because of excessive movement, low defocus, high defocus, or over-focus. CTF parameters were estimated from the exposure-weighted averages of movie frames with CTFFIND440.
Image processing
3044 particle images were manually selected and subjected to 2D classification with Relion 1.441. The resulting 2D classes were used as templates for automatic selection of 899405 particle images42. The number of particle images was reduced to 693416 by further 2D classification. Subsequent image processing was carried out in cryoSPARC43. An initial map of ACIII-cyt aa3 was obtained by ab initio 3D classification, refined to 4.1 Å resolution, and used as a reference for the multi-refine procedure in cryoSPARC producing initial maps of the ACIII and ACIII-cyt aa3 structures. 164239 particle images were used to refine the ACIII-cyt aa3 map to 3.4 Å resolution, but this map showed the cyt aa3 portion of the complex with lower-density than the ACIII part. Maps with uniform density for ACIII-cyt aa3 and ACIII, both at 3.6 Å resolution, were calculated from 81530 and 51547 particle images, respectively.
Model building
The 3.4 Å resolution density map was used for the de novo model building of ACIII. The density map was first segmented with UCSF Chimera44 to facilitate the identification of subunits. The connectivity of each segmented map was further examined and the result was compared with topology predictions from topocons45 and secondary structure prediction from Jpred46 to validate the subunit assignment and identify the directionality of peptide chain. With this information, model building was carried out manually in Coot47. Individual chains were first traced in Cα baton mode. Readily interpretable features from the density map, including regions rich in bulky residues, triacylated cysteines, and axial ligands of heme c, were used to register the structure to the sequence. Stretches of ~20 amino acids were built progressively around these registration points and assembled as a single chain in Coot. All six subunits of ACIII were combined and refined with phenix.real_space_refine48. For cofactors, the starting models were taken from CCP4 ligand library directly. Cofactors were docked to the density map with Coot and merged with the apo protein structure. The complete structure was then refined with phenix.real_space_refine with geometric constraints for the protein-cofactor coordination. The final model was further examined in Coot to remove amino acid sidechains with ambiguous orientations and further validated with MolProbity49 and EMringer50. All identified lipids with two acyl tails were modeled as phosphatidylethanolamine (PE) with palmitoyl tail. The conformation of PE was refined with interactive Molecular Dynamics Flexible Fitting (iMDFF) in the presence of protein structure using VMD51. Lipid tails were then truncated according to the density map.
The 3.6 Å resolution ACIII-cyt aa3 density map was used for the model building of cyt aa3. Part of the subunit III loop region was manually built in Coot. Homology models for individual subunits were generated with the RaptorX server52 and docked into the density map with UCSF Chimera. The model for ACIII-cyt aa3 supercomplex was assembled by fitting the ACIII structure to the ACIII-cyt aa3 map and placing the cyt aa3 structure from Rb. sphaeroides (PDB 1M56) into the map based on the position of cyt aa3 subunit III.
Bioinformatic analysis
Homologous protein sequences were retrieved using the NCBI blastp server53. The blastp results were analyzed in with pandas and biopython modules. Sequence hits were filtered based on coverage and sequence identity. Representative sequences were selected based on sequence identity to maintain the variations in sequence and aligned using the Clustal omega server54. Figures for sequence alignment were prepared using the ESPript 3.0 server55.
Simulation system preparation
The initial ACIII structure for the MD simulation was obtained from the refined structure determined by cryo-EM. Eleven 1-palmitoyl-2-oleoyl-sn-glycero-3-phosphoethanolamine (POPE) lipids resolved by cryo-EM were added to the ACIII system, which was subsequently embedded in a POPE membrane bilayer, solvated with the TIP3P water model56, and ionized with 150 mM NaCl.
ReMDFF simulation
Resolution-exchange Molecular Dynamics Flexible Fitting (ReMDFF)57 was used for structure refinement, with the CHARMM 36m force field for proteins58 and CHARMM 36 force field for lipids59. Force field parameters for hemes and iron sulfur cluster came from previous studies60–63. The fitting was performed in vacuum in the presence of a grid potential derived from the experimental density map (coupling factor 0.3). Secondary structure restraints, cis-peptide bond restraints, and chirality restraints were applied to the protein. Hemes and iron-sulfur clusters were harmonically restrained (k = 50 kcal/mol/Å2). A Langevin thermostat64 was used for maintaining the average temperature at 80 K. The MD integration time step was 1 fs. A cutoff radius for nonbonded interactions was set to 10 Å with a switching function taking effect at 9 Å. A total of six replicas were used together with six grid potentials of decreasing resolutions. Each was first energy-minimized for 2000 steps and then equilibrated for 1 ps. Finally, 2000 replica exchanges were attempted with 1 ps between attempts.
MD simulation
The ACIII systems were simulated with NAMD 2.12 using the same force field parameters as in ReMDFF. The system was energy-minimized for 3000 steps using the conjugated gradient algorithm65 with linear searching66, and equilibrated for 0.5 ns to relax lipid tail group atoms while keeping the lipid phosphorus atoms and protein (including hemes and iron-sulfur clusters) heavy atoms harmonically restrained (k = 1 kcal/mol/Å2). This procedure was followed by a 10-ns simulation to allow lipids to relax around the proteins while keeping the protein backbone and heavy atoms from iron-sulfur clusters and hemes harmonically restrained (k =1 kcal/mol/Å2). Restraints were gradually released over the next 5 ns and the simulation continued without any biasing potential for a total of 250 ns. The angles in the iron-sulfur clusters were harmonically restrained to their initial values (k = 300 kcal/mol/deg) throughout the simulation.
Data availability
All relevant data are available from the corresponding authors upon reasonable request and/or included in the manuscript or Supplementary Information. Three cryo-EM maps mentioned in this work have been deposited in the Electron Microscopy Data Bank (EMDB) under accession codes EMD-7286 (Combined), EMD-7447 (ACIII-cyt aa3), EMD-7448 (ACIII). The coordinates of the atomic model of the Alternative Complex III built from EMD-7286 have been deposited in the Protein Data Bank (PDB) under accession code 6BTM.
Extended Data
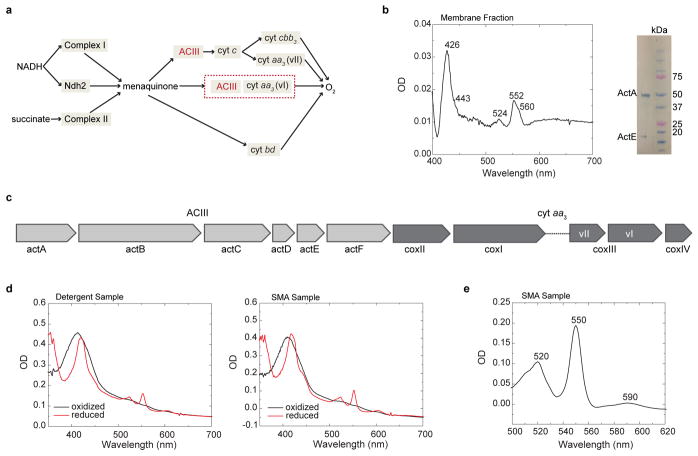
Extended Data Figure 1. Expression and spectroscopic characterization of the ACIII/cyt aa3 supercomplex.
a, A schematic representation of the respiratory chain of F. johnsoniae. b, UV/visible spectroscopy and SDS-PAGE with the membranes from F. johnsoniae. On the left is the difference spectrum of the membranes of F. johnsoniae was obtained from the spectrum of the air-oxidized membranes and the spectrum after reduction with dithionite. The wavelengths associated with the heme peaks are 605 nm, 560 nm, 552 nm and a broad peak at 630 nm for hemes a, b, c and d respectively. On the right is the SDS-PAGE with the membranes followed by staining the gel for hemes shows bands corresponding to the cytochrome subunits ActA (48kDa) and ActE (20kDa) of ACIII but nothing corresponding to the cytochrome subunit (~ 35kDa) from the cbb3 oxidase. c, The gene arrangement for the ACIII and the cytochrome oxidase aa3 genes in the F. johnsoniae genome. The genes for the subunits I and II from cyt aa3 oxidase are found immediately downstream of those for the act genes of the ACIII. Two different versions of subunit III are denoted as vI and vII. d, Reduced and oxidized UV/visible spectra of the supercomplex in detergent and SMA nanodiscs. The dithionite reduced form of the samples is represented in red and shows the peaks for heme c at 524 nm and 552 nm and those for heme a at 443 nm and 605 nm. e, Pyridine hemochrome assay of the ACIII:aa3 supercomplex in SMA nanodiscs. Plotted is the reduced-minus-oxidized difference spectrum of the pyridine hemochromes of the sample. Peaks at 520 nm and 550 nm are associated with heme c and peak at 590 nm is associated with heme a. Quantitation from the spectrum shows a ratio of 10.6:1 between heme c and heme a, which translates into a 3:2 ratio between ACIII and aa3 assuming 7 heme c per ACIII and 2 heme a per aa3. Data in b are representative of two independent experiments with similar results and data in d,e are representative of six independent experiments with similar results.
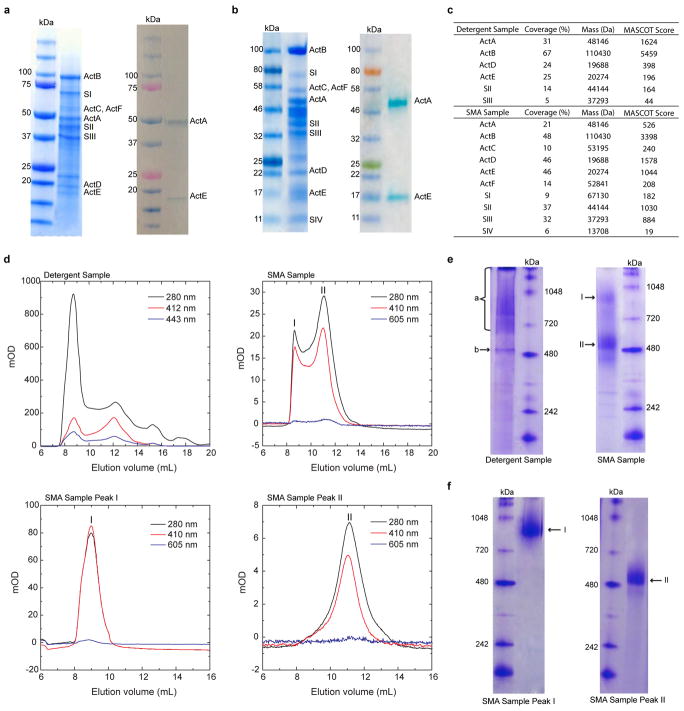
Extended Data Figure 2. Component and size analysis of the ACIII/cyt aa3 supercomplex.
a, SDS-PAGE of the detergent solubilized preparation followed by Coomassie staining (Left) and heme staining (Right). b, SDS-PAGE of the SMA nanodiscs preparation followed by Coomassie staining (Left) and heme staining (Right). c, Mass spectrometry results for the ACIII-aa3 supercomplex preparations. d, Size exclusion chromatography with the ACIII-aa3 supercomplex from F.johnsoniae. (Top left) The detergent-solubilized sample showing traces for protein at 280 nm, heme c at 412 nm and heme a at 443 nm respectively. (Top right) The sample isolated using the SMA copolymer showing traces for protein at 280 nm, heme c at 410 nm and heme a at 605 nm. I and II are the two peaks corresponding to two populations of the supercomplex. (Bottom left) The fraction containing peak I. (Bottom right) The fraction containing peak II. e, BN-PAGE with the ACIII:aa3 supercomplex. Detergent solubilized ACIII-aa3 supercomplex showing a band at around 500 kDa, a smear of possible aggregates and possibly ACIII by itself. The supercomplex in SMA nanodiscs shows two different populations. f, BN-PAGE with the two different populations of ACIII:aa3 supercomplex in SMA nanodiscs purified from the size exclusion chromatography. The two chromatography peaks correspond to the two bands observed in the BN-PAGE. Data in a,b are representative of six independent experiments and those in d,e,f are representative of three independent experiments with similar results.
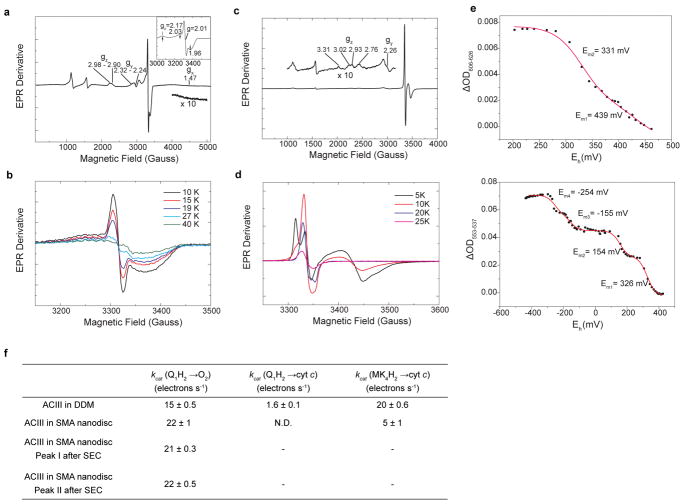
Extended Data Figure 3. Functional assays of the ACIII/cyt aa3 supercomplex.
a, The EPR spectrum of the air oxidized sample showing peaks of the [3Fe-4S]1+ cluster from ACIII, the CuA from the aa3 oxidase and low-spin hemes with overlapping g values. Insert is a zoomed view from 3000 G to 3500 G to better visualize the peaks from CuA (black arrows) and [3Fe-4S]1+ cluster. The region between 4000 G and 5000 G is magnified 10-times to show the broad gx trough of low-spin hemes. The measurement condition is 10 K, 9.267 GHz, 2 mW microwave power and 20 Gauss modulation. b, The EPR spectra of the ferricyanide oxidized sample at various temperatures. The measurement condition is 9.257 GHz, 2 mW microwave power and 5 Gauss modulation. c, The EPR spectrum of the air oxidized sample showing peaks of iron sulfur clusters from ACIII and low spin hemes. The measurement condition is 10 K, 9.427 GHz, 2 mW microwave power, 10 Gauss modulation. d, The EPR spectra of the air oxidized sample at various temperatures. The measurement condition is 9.427 GHz, 2 mW microwave power, 5 Gauss modulation. e, Redox titration of the hemes in the ACIII and the aa3 oxidase in supercomplex in DDM. The potentiometric titration of the c hemes (Top) from the ACIII and the a hemes (Bottom) from the aa3 oxidase. The Em values are indicated and the solid red line represents the Nernst fitting. f, Steady state activity of preparations of the ACIII/cyt aa3 preparations (The number of independent experiments, n = 6 for ACIII in DDM and SMA nanodiscs and n = 3 for Peak I and Peak II). Data are means ± standard deviation (S.D.). Data in a-e are representative of three independent experiments with similar results.
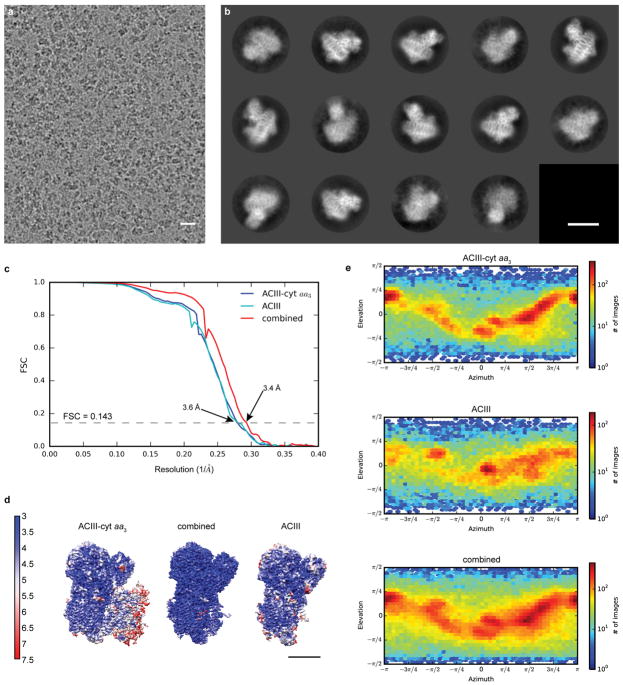
Extended Data Figure 4. single-particle cryo-EM of ACIII-cyt aa3 supercomplex in SMA nanodiscs.
a, Sum of an aligned movie of ACIII-cyt aa3 supercomplex in an SMA nanodisc. The scale bar is 20 nm. b, Two-dimensional class averages with the scale bar representing 10 nm. c, Fourier shell coefficient (FSC) curves between two independently refined half-maps for the ACIII-cyt aa3 map, ACIII map and combined map. d, Surface rendering maps colored according to local resolution, the scale bar is 5 nm. e, Euler angle distributions of particles included in the calculation of the three final maps. Data collection and structure calculation were not repeated.
Extended Data Figure 5. Features observed in the cryo-EM density and the de novo structure of ACIII.
a, Surface representations of ACIII, cyt aa3 and the ACIII-cyt aa3 supercomplex. The density threshold is the same for ACIII and cyt aa3. b, Different views of the ACIII density, colored by subunit. c, Two single-span transmembrane peptides of unknown origin and sequence, denoted ActX and ActY, are present in the structure in the vicinity of ActC. These have each been modeled as a polyalanine peptide. d, α-helices 2–10 of ActC form two four-helical up-and-down bundles, colored in two different blue colors. α-helices 1 and 10 are colored gray and unlabeled. e, ActB, shown in cartoon, has contact with ActA, ActC, ActD, ActE and ActF. Surfaces are drawn from residues that are within 4 Å of ActB and colored according to their chain. f, The transmembrane α-helices of ActC and ActF are arranged in a pseudo two-fold rotation symmetry. g, Side-by-side comparison of the polysulfide reductase (PDB 2VPZ) and the assembly of ActB and ActC. These two structures are aligned based on PsrB, the domain containing four Fe-S clusters.
Extended Data Figure 6. quinone pocket in ActC.
a, sequence alignment of the ActC from Flavobacterium johnsoniae, Rhodothermus marinus, and Chloroflexus aurantiacus. The transmembrane α-helices are labelled based on the structure of ACIII from Flavobacterium johnsoniae. The black arrows point to conserved polar residues that are within 15 Å of the [3Fe-4S] cluster in ActB. b, Proposed quinone pocket based on the arrangement of conserved polar residues. c, Different views of the proposed quinone pocket with a docked menaquinone-1 molecule. Hydrophobic residues near the menaquinone-1 (MK-1) head group are also shown. The crevice between α-helix 3 and α-helix 4 is a putative quinone entry pathway.
Extended Data Figure 7. Fitting of ACIII structure to cryo-EM density.
a, Fitting of cofactors into the cryo-EM density. The blue mesh is drawn with a higher density threshold to reveal metal centers. The numberings of nearby amino acid residues, which are shown along with these cofactors, are listed below each cofactor. b, fitting of different secondary structure elements to cryo-EM density. c, Eleven identified lipids are modelled as phosphatidylethanolamine molecules. d, The triacylated cysteine at the N terminus of ActE shown along with 15 downstream amino acids. Notably, residue Tyr28E is in contact with the covalent lipid of ActE. Attachment of ActE to the membrane may also be assisted by aromatic residues Tyr30E and Phe31E, which appear to be inserted into the lipid bilayer. Throughout the MD simulation trajectory, these residues remain buried in the lipid bilayer.
Extended Data Figure 8. Protein stability and lipid-protein interaction analysis based on molecular dynamics simulations.
a, Root-mean-square deviation (RMSD) of the protein backbone heavy atoms for the entire ACIII complex and each subunit, aligned based on ACIII backbone heavy atoms from three independent molecular dynamics simulations. b, Same as a, but aligned using the backbone heavy atoms of each subunits. c, Superposition of the initial (black) and final conformation (colored) of each subunit after 250 ns of simulation (aligned using backbone heavy atoms). d, The lipid-protein contact number defined by the number of lipid atoms within 4 Å of the protein atoms calculated over the time course of the simulation. This contact number is either calculated for the eleven lipids resolved by cryo-EM (top) or all membrane lipids (bottom). e, The lipid-protein contact number for each of the eleven cryo-EM resolved lipids. f, Isosurfaces (50%) of the atom occupancy map for the lipid anchors (orange), cryo-EM resolved lipids (red), and other membrane lipids (purple), calculated using the last 230 ns simulation trajectory. The stronger the lipid-protein interactions, the longer the local residence time, which leads to higher atom-occupancy values. ACIII subunits C, D, and F are shown in silver. For all plots, the raw data are shown as translucent thin lines and the block-averages are shown as dark lines.
Extended Data Figure 9. Structural basis for the supercomplex formation between the ACIII and the cyt aa3.
a, Two contact areas between the ACIII and the cyt aa3: the transmembrane portion of subunit III (red) and the loop from subunit III (orange). A homology model of subunit III fits the transmembrane density. The loop is modeled to the cryo-EM density. The sequence of the peptide is also shown. Tryptophan 188 and phenylalanine 189 are used to register the density to the sequence. b, Model of the ACIII-cyt aa3 supercomplex. The cyt aa3 structure from Rb. sphaeroides was positioned based on the transmembrane portion of subunit III. α-helices 1 and 2 of subunit III are missing in F. johnsoniae to avoid steric clashes with the ACIII structure. c, Sequence alignment of subunit III with a long loop (highlighted with the orange bar) between α-helix 5 and α-helix 6 (numbered according to subunit III from Rb. sphaeroides). Tryptophan 188 (black arrow) is conserved. d, Sequence alignment of ActB from organisms with a long loop in their subunit III of cyt aa3 oxidase. Arginine 868 (red arrow) is largely conserved with occasional substitution to lysine.
Extended Data Table 1.
Cryo-EM data collection, refinement and validation statistics
| Combined (EMDB-7286) (PDB 6BTM) | ACIII-cyt aa3 (EMDB-7447) | ACIII (EMDB-7448) | |
|---|---|---|---|
| Data collection and processing | |||
| Magnification | 75,000× | 75,000× | 75,000× |
| Voltage (kV) | 300 | 300 | 300 |
| Electron exposure (e−/Å2) | 61 | 61 | 61 |
| Defocus range (μm) | 0.8–5.0 | 0.8–5.0 | 0.8–5.0 |
| Pixel size (Å) | 1.1 | 1.1 | 1.1 |
| Symmetry imposed | C1 | C1 | C1 |
| Initial particle images (no.) | 899,405 | 899,405 | 899,405 |
| Final particle images (no.) | 164,239 | 81,530 | 51,547 |
| Map resolution (Å) | 3.4* | 3.6* | 3.6* |
| FSC threshold | 0.143 | 0.143 | 0.143 |
| Map resolution range (Å) | 3.0–4.5 | 3.0–6.0 | 3.0–5.0 |
| Refinement | |||
| Initial model used (PDB code) | N/A | N/A | N/A |
| Model resolution (Å) | 3.7† | N/A | N/A |
| FSC threshold | 0.5 | ||
| Model resolution range (Å) | 3.7 | N/A | N/A |
| Map sharpening B factor (Å2) | −150.1 | −132.4 | −129.1 |
| Model composition | |||
| Non-hydrogen atoms | 18,935 | ||
| Protein residues | 2,361 | ||
| Ligands | 10 | ||
| B factors (Å2) | |||
| Protein | 126.4‡ | ||
| Ligand | 119.7‡ | ||
| R.M.S. deviations | |||
| Bond lengths (Å) | 0.009 | ||
| Bond angles (°) | 1.26 | ||
| Validation | |||
| MolProbity score | 1.36 | ||
| Clashscore | 1.58 | ||
| Poor rotamers (%) | 0.15 | ||
| Ramachandran plot | |||
| Favored (%) | 92.7 | ||
| Allowed (%) | 7.3 | ||
| Disallowed (%) | 0.0 | ||
Determined with cryoSPARC
Determined with Phenix.mtriage
Mean value of the B factors determined with Phenix.real_space_refine
Supplementary Material
Acknowledgments
This work was supported by funds from the National Institutes of Health (R01-HL016101 to R.B.G., P41-GM104601, U54-GM087519, and R01-GM123455 to E.T.) and Canadian Institutes of Health Research (MOP-81294 to J.L.R.); J.L.R. was supported by the Canada Research Chairs program. Some of this work was performed at the Simons Electron Microscopy Center and National Resource for Automated Molecular Microscopy, supported by grants from the Simons Foundation (349247), and the National Institute of General Medical Sciences (P41-GM103310, S10-OD019994). Molecular dynamics simulations were performed at Blue Waters (ACI-1713784 to E.T.) and XSEDE (TG-MCA06N060 to E.T.). Blue Waters is supported by the National Science Foundation (OCI-0725070 and ACI-1238993) and the state of Illinois. XSEDE is supported by the National Science Foundation (ACI-1548562). We thank Mark Mcbride for kindly providing us with the Flavobacterium johnsoniae UW101 strain. We thank Bridget Carragher and Clint Potter for facilitating access to the Titan Krios and Zhening Zhang for collecting data. We also thank Mohammad Mazhab-Jafari for advice on building atomic models.
Footnotes
Author Contributions: P.V. expressed, purified and characterized the protein supercomplex, S.B. prepared cryo-EM specimens and calculated cryo-EM maps, C.S. built the de novo atomic structures, Y.W. conducted the molecular dynamics simulations, S.H. performed the electrochemical characterization, J.H. performed the metal analysis, E.T. supervised molecular dynamics simulations, J.L.R supervised the molecular structure determination, and R.B.G. conceived the project, supervised biochemical experiments, and coordinated the project. All authors participated in the manuscript preparation.
The cryo-EM density maps have been deposited in the Electron Microscopy Data Bank under accessions EMD-7286, EMD-7447, EMD-7448, the atomic coordinates for ACIII have been deposited in the Protein Data Bank under accession 6BTM.
The authors declare no competing financial interests.
Readers are welcome to comment on the online version of the paper.
References
- 1.Pereira MM, Carita JN, Teixeira M. Membrane-bound electron transfer chain of the thermohalophilic bacterium Rhodothermus marinus: a novel multihemic cytochrome bc, a new complex III. Biochemistry. 1999;38:1268–1275. doi: 10.1021/bi9818063. [DOI] [PubMed] [Google Scholar]
- 2.Yanyushin MF, del Rosario MC, Brune DC, Blankenship RE. New class of bacterial membrane oxidoreductases. Biochemistry. 2005;44:10037–10045. doi: 10.1021/bi047267l. [DOI] [PubMed] [Google Scholar]
- 3.Refojo PN, Sousa FL, Teixeira M, Pereira MM. The Alternative Complex III: a different architecture using known building modules. Biochim Biophys Acta. 2010;1797:1869–1876. doi: 10.1016/j.bbabio.2010.04.012. [DOI] [PubMed] [Google Scholar]
- 4.Pereira MM, Refojo PN, Hreggvidsson GO, Hjorleifsdottir S, Teixeira M. The Alternative Complex III from Rhodothermus marinus - a prototype of a new family of quinol:electron acceptor oxidoreductases. FEBS Lett. 2007;581:4831–4835. doi: 10.1016/j.febslet.2007.09.008. [DOI] [PubMed] [Google Scholar]
- 5.Gao X, Xin Y, Bell PD, Wen J, Blankenship RE. Structural analysis of Alternative Complex III in the photosynthetic electron transfer chain of Chloroflexus aurantiacus. Biochemistry. 2010;49:6670–6679. doi: 10.1021/bi100858k. [DOI] [PMC free article] [PubMed] [Google Scholar]
- 6.Refojo PN, Ribeiro MA, Calisto F, Teixeira M, Pereira MM. Structural composition of Alternative Complex III: variations on the same theme. Biochim Biophys Acta. 2013;1827:1378–1382. doi: 10.1016/j.bbabio.2013.01.001. [DOI] [PubMed] [Google Scholar]
- 7.Xia D, et al. Crystal structure of the cytochrome bc1 complex from bovine heart mitochondria. Science. 1997:277. doi: 10.1126/science.277.5322.60. [DOI] [PubMed] [Google Scholar]
- 8.Rothery RA, Workun GJ, Weiner JH. The prokaryotic complex iron-sulfur molybdoenzyme family. Biochim Biophys Acta. 2008;1778:1897–1929. doi: 10.1016/j.bbamem.2007.09.002. [DOI] [PubMed] [Google Scholar]
- 9.Dietrich W, Klimmek O. The function of methyl-menaquinone-6 and polysulfide reductase membrane anchor (PsrC) in polysulfide respiration of Wolinella succinogenes. Eur J Biochem. 2002;269:1086–1095. doi: 10.1046/j.0014-2956.2001.02662.x. [DOI] [PubMed] [Google Scholar]
- 10.Hedderich R, et al. Anaerobic respiration with elemental sulfur and with disulfides. FEMS Microbiol Rev. 1998;22:353–381. [Google Scholar]
- 11.Dorr JM, et al. Detergent-free isolation, characterization, and functional reconstitution of a tetrameric K+ channel: the power of native nanodiscs. Proc Natl Acad Sci USA. 2014;111:18607–18612. doi: 10.1073/pnas.1416205112. [DOI] [PMC free article] [PubMed] [Google Scholar]
- 12.Postis V, et al. The use of SMALPs as a novel membrane protein scaffold for structure study by negative stain electron microscopy. Biochim Biophys Acta. 2015;1848:496–501. doi: 10.1016/j.bbamem.2014.10.018. [DOI] [PMC free article] [PubMed] [Google Scholar]
- 13.Dorr JM, et al. The styrene-maleic acid copolymer: a versatile tool in membrane research. Eur Biophys J. 2016;45:3–21. doi: 10.1007/s00249-015-1093-y. [DOI] [PMC free article] [PubMed] [Google Scholar]
- 14.Parmar M, et al. Using a SMALP platform to determine a sub-nm single particle cryo-EM membrane protein structure. Biochim Biophys Acta. 2017;1860:378–383. doi: 10.1016/j.bbamem.2017.10.005. [DOI] [PMC free article] [PubMed] [Google Scholar]
- 15.Bayburt TH, Sligar SG. Membrane protein assembly into nanodiscs. FEBS Lett. 2010;584:1721–1727. doi: 10.1016/j.febslet.2009.10.024. [DOI] [PMC free article] [PubMed] [Google Scholar]
- 16.Jormakka M, et al. Molecular mechanism of energy conservation in polysulfide respiration. Nat Struct Mol Biol. 2008;15:730–737. doi: 10.1038/nsmb.1434. [DOI] [PMC free article] [PubMed] [Google Scholar]
- 17.Majumder EL, King JD, Blankenship RE. Alternative Complex III from phototrophic bacteria and its electron acceptor auracyanin. Biochim Biophys Acta. 2013;1827:1383–1391. doi: 10.1016/j.bbabio.2013.01.008. [DOI] [PubMed] [Google Scholar]
- 18.Refojo PN, Teixeira M, Pereira MM. The Alternative Complex III: properties and possible mechanisms for electron transfer and energy conservation. Biochim Biophys Acta. 2012;1817:1852–1859. doi: 10.1016/j.bbabio.2012.05.003. [DOI] [PubMed] [Google Scholar]
- 19.Crofts AR. The cytochrome bc1 complex: function in the context of structure. Annu Rev Physiol. 2004;66:689–733. doi: 10.1146/annurev.physiol.66.032102.150251. [DOI] [PubMed] [Google Scholar]
- 20.Sazanov LA. A giant molecular proton pump: structure and mechanism of respiratory Complex I. Nat Rev Mol Cell Biol. 2015;16:375–388. doi: 10.1038/nrm3997. [DOI] [PubMed] [Google Scholar]
- 21.Kovacs-Simon A, Titball RW, Michell SL. Lipoproteins of bacterial pathogens. Infect Immun. 2011;79:548–561. doi: 10.1128/IAI.00682-10. [DOI] [PMC free article] [PubMed] [Google Scholar]
- 22.Kao WC, et al. The obligate respiratory supercomplex from Actinobacteria. Biochim Biophys Acta. 2016;1857:1705–1714. doi: 10.1016/j.bbabio.2016.07.009. [DOI] [PubMed] [Google Scholar]
- 23.Graf S, et al. Rapid electron transfer within the III–IV Supercomplex in Corynebacterium glutamicum. Sci Rep. 2016;6:34098. doi: 10.1038/srep34098. [DOI] [PMC free article] [PubMed] [Google Scholar]
- 24.McBride MJ, Baker SA. Development of techniques to genetically manipulate members of the genera Cytophaga, Flavobacterium, Flexibacter, and Sporocytophaga. Appl Environ Microbiol. 1996;62:3017–3022. doi: 10.1128/aem.62.8.3017-3022.1996. [DOI] [PMC free article] [PubMed] [Google Scholar]
- 25.Bell AJ, Frankel LK, Bricker TM. High yield non-detergent Isolation of Photosystem I-light-harvesting chlorophyll II membranes from spinach thylakoids: implications for the organization of the PSI antennae in higher plants. J Biol Chem. 2015;290:18429–18437. doi: 10.1074/jbc.M115.663872. [DOI] [PMC free article] [PubMed] [Google Scholar]
- 26.Berry EA, Trumpower BL. Simultaneous determination of hemes a, b, and c from pyridine hemochrome spectra. Anal Biochem. 1987;161:1–15. doi: 10.1016/0003-2697(87)90643-9. [DOI] [PubMed] [Google Scholar]
- 27.Thomas PE, Ryan D, Levin W. An improved staining procedure for the detection of the peroxidase activity of cytochrome P-450 on sodium dodecyl sulfate polyacrylamide gels. Anal Biochem. 1976;75:168–176. doi: 10.1016/0003-2697(76)90067-1. [DOI] [PubMed] [Google Scholar]
- 28.Minghetti KC, et al. Modified, large-scale purification of the cytochrome o complex (bo-type oxidase) of Escherichia coli yields a two heme/one copper terminal oxidase with high specific activity. Biochemistry. 1992;31:6917–6924. doi: 10.1021/bi00145a008. [DOI] [PubMed] [Google Scholar]
- 29.Gao X, Xin Y, Blankenship RE. Enzymatic activity of the Alternative Complex III as a menaquinol:auracyanin oxidoreductase in the electron transfer chain of Chloroflexus aurantiacus. FEBS Lett. 2009;583:3275–3279. doi: 10.1016/j.febslet.2009.09.022. [DOI] [PubMed] [Google Scholar]
- 30.Ragan CI, Wilson MT, Darley-Usmar VM, Lowe PN. Mitochondria: A Practical Approach. IRL Press; 1987. [Google Scholar]
- 31.Carrell CJ, et al. Generation of novel copper sites by mutation of the axial ligand of amicyanin. Atomic resolution structures and spectroscopic properties. Biochemistry. 2007;46:1900–1912. doi: 10.1021/bi0619674. [DOI] [PubMed] [Google Scholar]
- 32.Ouyang H, et al. Functional importance of a pair of conserved glutamic acid residues and of Ca2+ binding in the cbb3-type oxygen reductases from Rhodobacter sphaeroides and Vibrio cholerae. Biochemistry. 2012;51:7290–7296. doi: 10.1021/bi3006847. [DOI] [PMC free article] [PubMed] [Google Scholar]
- 33.Bowyer JR, Tierney GV, Crofts AR. Cytochrome c2--reaction centre coupling in chromatophores of Rhodopseudomonas sphaeroides and Rhodopseudomonas capsulata. FEBS Lett. 1979;101:207–212. doi: 10.1016/0014-5793(79)81327-7. [DOI] [PubMed] [Google Scholar]
- 34.Dutton PL. Redox potentiometry: determination of midpoint potentials of oxidation-reduction components of biological electron-transfer systems. Methods Enzymol. 1978;54:411–435. doi: 10.1016/s0076-6879(78)54026-3. [DOI] [PubMed] [Google Scholar]
- 35.Fultz M, Durs R. Mediator compounds for the electrochemical study of biological redox systems: a compilation. Anal Chim Acta. 1982:140. [Google Scholar]
- 36.Marr CR, Benlekbir S, Rubinstein JL. Fabrication of carbon films with ~500nm holes for cryo-EM with a direct detector device. J Struct Biol. 2014;185:42–47. doi: 10.1016/j.jsb.2013.11.002. [DOI] [PubMed] [Google Scholar]
- 37.Tivol WF, Briegel A, Jensen GJ. An improved cryogen for plunge freezing. Microsc Microanal. 2008;14:375–379. doi: 10.1017/S1431927608080781. [DOI] [PMC free article] [PubMed] [Google Scholar]
- 38.Suloway C, et al. Automated molecular microscopy: The new Leginon system. J Struct Biol. 2005;151:41–60. doi: 10.1016/j.jsb.2005.03.010. [DOI] [PubMed] [Google Scholar]
- 39.Zheng SQ, et al. MotionCor2: anisotropic correction of beam-induced motion for improved cryo-electron microscopy. Nat Methods. 2017;14:331–332. doi: 10.1038/nmeth.4193. [DOI] [PMC free article] [PubMed] [Google Scholar]
- 40.Rohou A, Grigorieff N. CTFFIND4: Fast and accurate defocus estimation from electron micrographs. J Struct Biol. 2015;192:216–221. doi: 10.1016/j.jsb.2015.08.008. [DOI] [PMC free article] [PubMed] [Google Scholar]
- 41.Scheres SHW. A bayesian view on cryo-EM structure determination. J Mol Biol. 2012;415:406–418. doi: 10.1016/j.jmb.2011.11.010. [DOI] [PMC free article] [PubMed] [Google Scholar]
- 42.Scheres SHW. Semi-automated selection of cryo-EM particles in RELION-1.3. J Struct Biol. 2015;189:114–122. doi: 10.1016/j.jsb.2014.11.010. [DOI] [PMC free article] [PubMed] [Google Scholar]
- 43.Punjani A, Rubinstein JL, Fleet DJ, Brubaker M. A cryoSPARC: algorithms for rapid unsupervised cryo-EM structure determination. Nat Methods. 2017;14:290–296. doi: 10.1038/nmeth.4169. [DOI] [PubMed] [Google Scholar]
- 44.Pettersen EF, et al. UCSF Chimera--A visualization system for exploratory research and analysis. J Comput Chem. 2004;25:1605–1612. doi: 10.1002/jcc.20084. [DOI] [PubMed] [Google Scholar]
- 45.Tsirigos KD, Peters C, Shu N, Käll L, Elofsson A. The TOPCONS web server for consensus prediction of membrane protein topology and signal peptides. Nucleic Acids Res. 2015;43:W401–W407. doi: 10.1093/nar/gkv485. [DOI] [PMC free article] [PubMed] [Google Scholar]
- 46.Drozdetskiy A, Cole C, Procter J, Barton GJ. JPred4: a protein secondary structure prediction server. Nucleic Acids Res. 2015;43:W389–W394. doi: 10.1093/nar/gkv332. [DOI] [PMC free article] [PubMed] [Google Scholar]
- 47.Emsley P, Lohkamp B, Scott WG, Cowtan K. Features and development of Coot. Acta Cryst D. 2010;66:486–501. doi: 10.1107/S0907444910007493. [DOI] [PMC free article] [PubMed] [Google Scholar]
- 48.Adams PD, et al. PHENIX : a comprehensive Python-based system for macromolecular structure solution. Acta Cryst D. 2010;66:213–221. doi: 10.1107/S0907444909052925. [DOI] [PMC free article] [PubMed] [Google Scholar]
- 49.Chen VB, et al. MolProbity: all-atom structure validation for macromolecular crystallography. Acta Cryst D. 2010;66:12–21. doi: 10.1107/S0907444909042073. [DOI] [PMC free article] [PubMed] [Google Scholar]
- 50.Barad BA, et al. EMRinger: side chain–directed model and map validation for 3D cryo-electron microscopy. Nat Methods. 2015;12:943. doi: 10.1038/nmeth.3541. [DOI] [PMC free article] [PubMed] [Google Scholar]
- 51.Humphrey W, Dalke A, Schulten K. VMD: Visual molecular dynamics. J Mol Graphics. 1996;14:33–38. doi: 10.1016/0263-7855(96)00018-5. [DOI] [PubMed] [Google Scholar]
- 52.Källberg M, et al. Template-based protein structure modeling using the RaptorX web server. Nat Protoc. 2012;7:1511–1522. doi: 10.1038/nprot.2012.085. [DOI] [PMC free article] [PubMed] [Google Scholar]
- 53.Madden TL, Tatusov RL, Zhang J. Applications of network BLAST server. Methods Enzymol. 1996;266:131–141. doi: 10.1016/s0076-6879(96)66011-x. [DOI] [PubMed] [Google Scholar]
- 54.Sievers F, et al. Fast, scalable generation of high-quality protein multiple sequence alignments using Clustal Omega. Mol Syst Biol. 2011:7. doi: 10.1038/msb.2011.75. [DOI] [PMC free article] [PubMed] [Google Scholar]
- 55.Robert X, Gouet P. Deciphering key features in protein structures with the new ENDscript server. Nucleic Acids Res. 2014;42:W320–W324. doi: 10.1093/nar/gku316. [DOI] [PMC free article] [PubMed] [Google Scholar]
- 56.Jorgensen WL, Chandrasekhar J, Madura JD, Impey RW, Klein ML. Comparison of simple potential functions for simulating liquid water. J Chem Phys. 1983;79:926–935. [Google Scholar]
- 57.Singharoy A, et al. Molecular dynamics-based refinement and validation for sub-5 Å cryo-electron microscopy maps. eLife. 2016;5:61–67. doi: 10.7554/eLife.16105. [DOI] [PMC free article] [PubMed] [Google Scholar]
- 58.Huang J, et al. CHARMM36m: an improved force field for folded and intrinsically disordered proteins. Nat Methods. 2016;14:71–73. doi: 10.1038/nmeth.4067. [DOI] [PMC free article] [PubMed] [Google Scholar]
- 59.Best RB, et al. Optimization of the additive CHARMM all-atom protein force field targeting improved sampling of the backbone phi, psi and side-chain chi1 and chi2 dihedral angles. J Chem Theory Comput. 2012;8:3257–3273. doi: 10.1021/ct300400x. [DOI] [PMC free article] [PubMed] [Google Scholar]
- 60.Autenrieth F, Tajkhorshid E, Baudry J, Luthey-Schulten Z. Classical force field parameters for the heme prosthetic group of cytochrome c. J Comput Chem. 2004;25:1613–1622. doi: 10.1002/jcc.20079. [DOI] [PubMed] [Google Scholar]
- 61.Autenrieth F, Tajkhorshid E, Klaus Schulten A, Luthey-Schulten Z. Role of Water in Transient Cytochrome c2 Docking. J Phys Chem B. 2004;108:20376–20387. [Google Scholar]
- 62.Carvalho ATP, Swart M. Correction for electronic structure investigation and parametrization of biologically relevant iron–sulfur clusters. J Chem Inf Model. 2015;55:1508–1508. doi: 10.1021/acs.jcim.5b00390. [DOI] [PubMed] [Google Scholar]
- 63.Carvalho ATP, Swart M. Electronic Structure Investigation and Parametrization of Biologically Relevant Iron–Sulfur Clusters. J Chem Inf Model. 2014;54:613–620. doi: 10.1021/ci400718m. [DOI] [PubMed] [Google Scholar]
- 64.Allen MP, Tildesley DJ. Computer Simulation of Liquids. Oxford University Press; 1987. [Google Scholar]
- 65.Fletcher R, Reeves CM. Function minimization by conjugate gradients. Comput J. 1964;7:149–154. [Google Scholar]
- 66.Sun W, Yuan Y-X. Optimization theory and methods: nonlinear programming. Springer; 2006. [Google Scholar]
Associated Data
This section collects any data citations, data availability statements, or supplementary materials included in this article.
Supplementary Materials
Data Availability Statement
All relevant data are available from the corresponding authors upon reasonable request and/or included in the manuscript or Supplementary Information. Three cryo-EM maps mentioned in this work have been deposited in the Electron Microscopy Data Bank (EMDB) under accession codes EMD-7286 (Combined), EMD-7447 (ACIII-cyt aa3), EMD-7448 (ACIII). The coordinates of the atomic model of the Alternative Complex III built from EMD-7286 have been deposited in the Protein Data Bank (PDB) under accession code 6BTM.


