

Abstract
Haemosporida is a diverse group of vector-borne parasitic protozoa, ubiquitous in terrestrial vertebrates worldwide. The renewed interest in their diversity has been driven by the extensive use of molecular methods targeting mitochondrial genes. Unfortunately, most studies target a 478 bp fragment of the cytochrome b (cytb) gene, which often cannot be used to separate lineages from different genera found in mixed infections that are common in wildlife. In this investigation, an alignment constructed with 114 mitochondrial genome sequences belonging to four genera (Leucocytozoon, Haemoproteus, Plasmodium and Hepatocystis) was used to design two different sets of primers targeting the cytb gene as well as the other two mitochondrial DNA genes: cytochrome c oxidase subunit 1 and cytochrome c oxidase subunit 3. The design of each pair of primers required consideration of different criteria, including a set for detection and another for differential amplification of DNA from parasites belonging to different avian haemosporidians. All pairs of primers were tested in three laboratories to assess their sensitivity and specificity under diverse practices and across isolates from different genera including single and natural mixed infections as well as experimental mixed infections. Overall, these primers exhibited high sensitivity regardless of the differences in laboratory practices, parasite species, and parasitemias. Furthermore, those primers designed to separate parasite genera showed high specificity, as confirmed by sequencing. In the case of cytb, a nested multiplex (single tube PCR) test was designed and successfully tested to differentially detect lineages of Plasmodium and Haemoproteus parasites by yielding amplicons with different sizes detectable in a standard agarose gel. To our knowledge, the designed assay is the first test for detection and differentiation of species belonging to these two genera in a single PCR. The experiments across laboratories provided recommendations that can be of use to those researchers seeking to standardize these or other primers to the specific needs of their field investigations.
Keywords: Avian malaria, Cytochrome b, Haemoproteus, Mitochondrial genome, Nested-multiplex PCR, Plasmodium, Primers
Graphical abstract

1. Introduction
Haemosporidians (Phylum Apicomplexa, Order Haemosporida) are a diverse group of unicellular blood parasites that infect a variety of vertebrate hosts including amphibians, reptiles, birds and mammals (Garnham, 1966; Valkiūnas, 2005; Telford, 2009). These vector-borne parasitic protozoa are classified into four families, the Plasmodiidae, Garniidae, Haemoproteidae and Leucocytozoidae, with most of the known species belonging to three genera, Plasmodium, Haemoproteus and Leucocytozoon (Valkiūnas, 2005; Telford, 2009). In the case of avian haemosporidians, these cosmopolitan parasites are found in birds belonging to different families with remarkably complex patterns in terms of host-parasite speciation and evolution (Ricklefs and Fallon, 2002; Bensch et al., 2004; Ricklefs et al., 2004; Valkiūnas, 2005; Nilsson et al., 2016; Pacheco et al., 2018). Many infections appear to be subpatent and submicroscopic, making it difficult to ascertain the prevalence of these parasites in specific host populations. Furthermore, those parasite species linked to severe avian diseases are often particularly difficult to diagnose using microscopy during the exo-erythrocytic stage of development (Valkiūnas and Iezhova, 2017). This calls for improvement of molecular tools for detection of haemosporidian infections.
Investigations into the diversity of these parasites have been possible due to the extensive use of mitochondrial genes, particularly cytochrome b (cytb), in ecological and evolutionary studies (Escalante et al., 1998; Perkins and Schall, 2002; Ricklefs and Fallon, 2002; Bensch et al., 2004; Hellgren et al., 2004). The use of this locus is facilitated by its relative conservation across species and its high copy number which together allow its amplification by PCR from a broad range of host species. Indeed, cytb has become a de facto DNA barcoding gene for avian malaria (Bensch et al., 2009; Outlaw and Ricklefs, 2014; Valkiūnas et al., 2017) even though it has not been properly standardized (Bergsten et al., 2012; Pacheco et al., 2018). Despite the higher sensitivity of molecular methods to detect parasites than that of microscopy (e.g., Cheng et al., 2015), a limitation on the use of molecular approaches in studying avian parasites is how to link sequences/molecular markers to species when our understanding of their taxonomy and biodiversity remains limited. The situation is further complicated by the fact that haemosporidians, similar to other parasitic organisms (Poulin, 2007), are usually part of multiple species infections. In fact, there is a high prevalence of haemosporidian infections of different genetic lineages and/or species belonging to the same and different genera in wild birds (Valkiūnas et al., 2003, 2006; Beadell et al., 2004; Pérez –Tris and Bensch, 2005; Loiseau et al., 2010; Silva-Iturriza et al., 2012; Dimitrov et al., 2014; Clark et al., 2016), reptiles (Falk et al., 2009; Telford, 2009), and primates (Pacheco et al., 2012, 2013; Muehlenbein et al., 2015). These mixed infections often predominate in some bird populations and are a challenge to researchers attempting to identify avian parasites because most described species remain poorly characterized in terms of molecular markers; the situation worsens in the case of potential new species.
Current PCR methods target conserved regions of the cytb gene across haemosporidian species of different genera, so those often overlook mixed infections simply because the same or similar amplicon sizes are expected (Pérez-Tris and Bensch, 2005; Valkiūnas et al., 2006; Martínez et al., 2009; Zehtindjiev et al., 2012). Furthermore, direct sequencing of PCR products may create chimeras or “consensus” sequences that are impossible to assign to species. Although the combination of PCR and microscopy can mitigate the problem of detecting mixed infections, parasite species identification in multiple infections using PCR assays remains a problem (Pérez-Tris and Bensch, 2005; Ishtiaq et al., 2017). To illustrate the situation, a recent study on avian haemosporidians using experimental mixed infections from different genera showed that a single PCR assay markedly underestimated the number of species and/or lineages found in mixed infections. Furthermore, most of the lineages presented in a mixed infection were detected only when at least three PCR assays were done in parallel (Bernotienė et al., 2016).
In this investigation, taking advantage of an alignment constructed with a total of 114 mitochondrial (mt)DNA genome sequences (Pacheco et al., 2018) belonging to four genera (Leucocytozoon, Haemoproteus, Plasmodium and Hepatocystis), different sets of primers targeting mtDNA genes (specifically cytb) were designed for both PCR detection and differential DNA amplification of parasites belonging to different genera of avian haemosporidians. To evaluate the sensitivity and specificity of these sets of primers, we compare the results from three laboratories that used different practices and reagents to test them. These different settings allowed testing of the primers on different laboratory strains, natural single infections, and natural and experimental mixed infections.
2. Materials and methods
2.1. Primer design
Two groups of primers are reported in this study: (i) four pairs for PCR detection of parasites or group 1 and (ii) five for differential DNA amplification of parasite DNA belonging to different genera of avian haemosporidians or group 2 (Fig. 1). As for other primers currently available, the primers of group 1 (PCR detection) can be used for lineage identification and direct sequencing of PCR amplicons for phylogenetic purposes if the samples are single infections. The advantage of the primers included in group 1 over others (currently used) is that amplicons are larger than 900 bp, providing more informative sites for phylogenetic analyses, and those overlap with the cytb fragment commonly used in parasitological and ecological investigations. Thus, group 1 primers can support more demanding phylogenetic inferences while allow comparison of the sampled lineages with those previously reported. For differential DNA amplification of avian haemosporidians belonging to different genera (group 2), genus-specific primers for Plasmodium or Haemoproteus (Parahaemoproteus) spp. were tested.
Fig. 1.
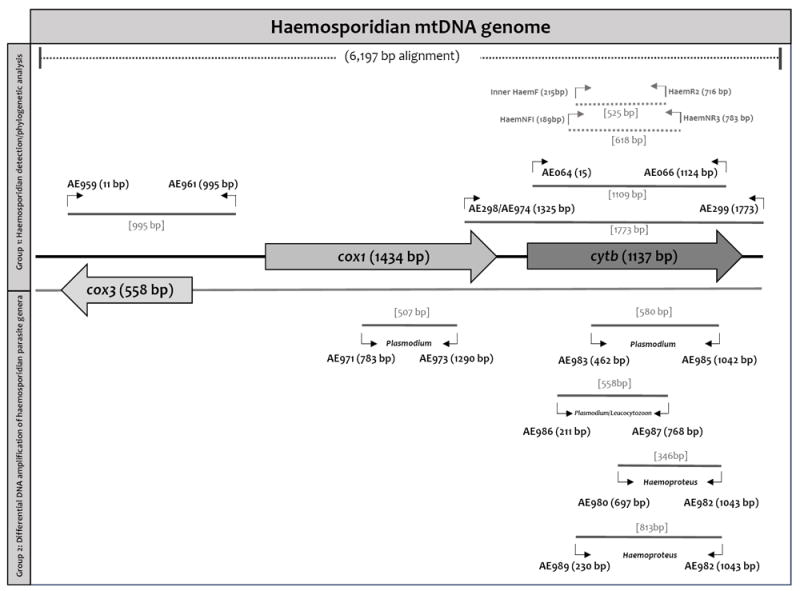
Diagram of mitochondrial genes (mtDNA) with primer locations for PCR detection (longer fragments, >995 bp) and differential DNA amplification of haemosporidian parasite genera. Primer specificity for differential DNA amplification of haemosporidian parasite genera is shown. Primer locations are indicated by parentheses and are relative to the genes in the alignment, and the amplicon size for each set of primers are in square brackets. The regions that could be amplified using previous published primers are shown for comparation (primers HaemF/HaemR2 and HaemNF1/HaemNR3, Bensch et al. 2000; Hellgren et al. 2004). Cox1, cytochrome c oxidase subunit 1; cox3, cytochrome c oxidase subunit 3; cytb: cytochrome b.
All primers were designed using conserved gene regions of cytochrome c oxidase subunit 1 (cox1), cytochrome c oxidase subunit 3 (cox3), and cytb in an alignment of 114 mtDNA genome sequences (5,125 kbp excluding gaps, DOI: http://dx.doi.org/10.17632/jtz23sgttf.1), that include all the sequences available at GenBank to date from Leucocytozoon (n=13), Haemoproteus (n=27), Plasmodium (n=71 including bird, reptile and human parasites), and Hepatocystis (n=3) spp. In addition, different lineages for some parasite species, which were identified using morphological characters (e.g., Plasmodium lutzi, Haemoproteus columbae, etc.), were included in the alignment (see Supplementary table S1 for sample codes in Pacheco et al. (2018)). In order to achieve specific PCR amplification with high yields, standard primer design considerations were followed (Jennings, 2017), in particular: (i) optimal length varies between 18 and 30 bp; this length allows for adequate specificity and remains short enough for primers to bind easily to the template at the annealing temperature; (ii) optimal melting temperatures are in the range of 52-58 °C that generally produces the best results; (iii) optimal GC content (the number of Gs and Cs in the primer as a percentage of the total bases) of the primer is between 30 to 60%; (iv) due to the stronger bonding of G and C bases, primers have one or two G and/or C bases within the last five bases from the 3′ end of primers (GC clamp) to promote specific binding at the 3′ end; (v) primer secondary structures such as hairpins, self-and cross-dimer were avoided (this is necessary because secondary structures produced by intermolecular or intramolecular interactions can affect primer-template annealing, generating poor or no yield of PCR product); (vi) repeats with a di-nucleotide occurring many times consecutively were avoided because those can misprime; (vii) primers with long runs of a single base were avoided as they can misprime so runs of a maximum of 4 bp were accepted; (viii) to improve specificity of the primers, template secondary structure and cross homology were also avoided (designed primers do not amplify other genes in the mixture); and (ix) in the case of degenerate primers, only a maximum of four positions in the oligonucleotide containing a mixture of base pairs was allowed. All these requirements were checked using the online tool Oligo Calc: Oligonucleotide Properties Calculator (http://biotools.nubic.northwestern.edu/OligoCalc.html).
In order to test the reproducibility of the amplification yield with these primers across different laboratory practices, experiments were performed in three laboratories using diverse types of samples, PCR conditions and equipment (Fig. 2); laboratory A, Evolutionary Dynamics of Infectious Diseases Laboratory at the Institute for Genomics and Evolutionary Medicine (iGEM), Temple University, USA; laboratory B, P. B. ivickis Laboratory of Parasitology, Institute of Ecology, Nature Research Centre, Lithuania; and laboratory C, Host-Parasite Relationship Laboratory at Universidad Nacional de Colombia, Colombia. First, the primers were tested and a general PCR protocol was optimized by laboratory A, and then the other two laboratories adapted the protocol to test the primers on their samples. Given that each laboratory has its own practices and reagents, some conditions were differed between them. Nevertheless, we tested how robust the amplifications were when these primers were used for a diverse set of samples. Primer sequences, properties of each primer (including the targeted genera) and the PCR conditions used in each laboratory are shown in Table 1.
Fig. 2.
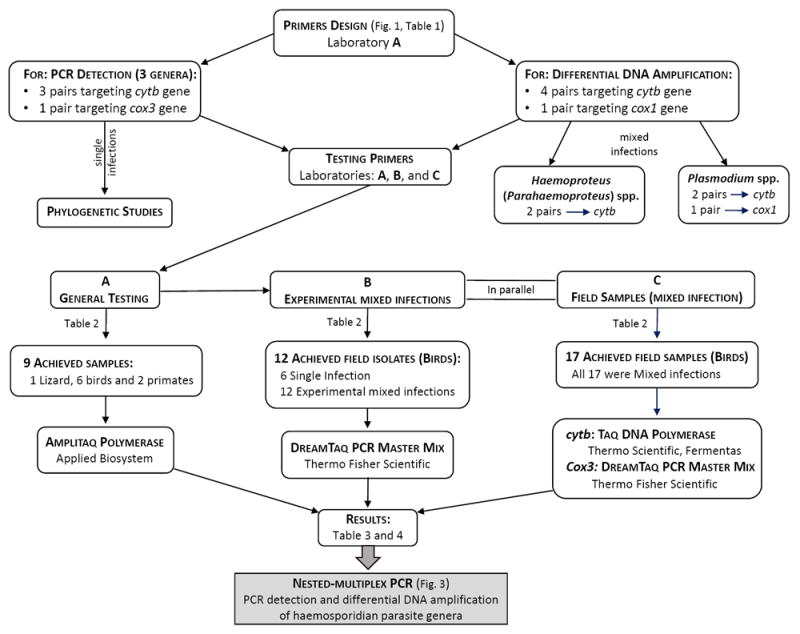
Diagram of the experimental design of the current study. Laboratories (Labs): A, Evolutionary Dynamics of Infectious Diseases Laboratory at the Institute for Genomics and Evolutionary Medicine (iGEM), Temple University, USA; B, P. B. Šivickis Laboratory of Parasitology, Institute of Ecology, Nature Research Centre, Lithuania; and C, Host-Parasite Relationship Laboratory at Universidad Nacional de Colombia, Colombia. Cox1, cytochrome c oxidase subunit 1; cox3, cytochrome c oxidase subunit 3; and cytb, cytochrome b.
Table 1.
Primers, their properties, and summary of PCR conditions tested by the three laboratories (A-C).
| PCR protocols
|
|||||||||||||||
|---|---|---|---|---|---|---|---|---|---|---|---|---|---|---|---|
| A | B | C | Genus Target | ||||||||||||
|
|
|
|
|||||||||||||
| Code (pairs) | Primers sequences (5’-3’) | Size (bp) | GC (%) | FSa (bp) | Ta (°C) | MgCl2 (μM) | Ta (°C) | MgCl2 (μM) | Ta (°C) | MgCl2 (μM) | L | H | P | ||
|
|
|
|
|||||||||||||
| Group 1: Haemosporidian detection/phylogenetic analysis | cytb | AE298-EF | TGTAATGCCTAGACGTATTCC | 21 | 43 | 1773-1741 | 53 | 2.5 | 53 | 4 | 53 | 2.5 | X | X | X |
| AE299-ER | GTCAAWCAAACATGAATATAGAC | 23 | 30 | ||||||||||||
| AE064-IFb | TCTATTAATTTAGYWAAAGCAC | 22 | 41 | 1109 | 56 | 2.5 | 56 | 4 | 56 | 2.5 | X | X | X | ||
| AE066-IRb | GCTTGGGAGCTGTAATCATAAT | 22 | 41 | ||||||||||||
| AE974-EF | TGTAATGCCTAGAMGWATWCC | 21 | 38-43 | 1741 | 56 | 2.5 | 56 | 4 | 56 | 2.5 | X | X | X | ||
| AE299-ER | GTCAAWCAAACATGAATATAGAC | 23 | 30 | ||||||||||||
|
|
|
|
|||||||||||||
| cox3 | AE959-F | CCATACAATYTCNACRAAATGCC | 23 | 35-48 | 995 | 55 | 2.5 | 55 | 4 | 55 | 2.5 | X | X | X | |
| AE961-R | CTGTTATCCCCGGCGAACC | 19 | 63 | ||||||||||||
|
|
|
|
|||||||||||||
| Group 2: Differential DNA amplification of haemosporidian parasite genera | cytb | AE980-F | AAAGTTTATTTGGWATWYTRCCWTTAG | 27 | 22-30 | 346 | 57 | 2.5 | 57 | 4 | 54.3 | 2.5 | X | ||
| AE982-R | AAACGACCATATAAAATRWARATAG | 25 | 20-28 | ||||||||||||
| AE989-F | TATGCAYGCTACHGGWGCTAC | 21 | 48-57 | 813 | 57 | 2.5 | 57 | 4 | 54.3 | 2.5 | X | ||||
| AE982-R | AAACGACCATATAAAATRWARATAG | 25 | 20-28 | ||||||||||||
| HaemF-EFb,c | ATGGTGCTTTCGATATATGCATG | 23 | 39 | 828 | 56 | 2.5 | 50 | 4 | 53.5 | 2.5 | X | ||||
| AE982-ERb | AAACGACCATATAAAATRWARATAG | 25 | 20-28 | ||||||||||||
| AE983-F | TGGATHTGTGGWGGATATYTWG | 22 | 36-45 | 580 | 57 | 2.5 | 57 | 4 | 56 | 2.5 | X | ||||
| AE985-R | AACGACCATATAWAATGWADATATC | 25 | 24-28 | ||||||||||||
| AE986-F | AGTGGATGGTGYTTYAGATAYTTAC | 25 | 32-44 | 558 | 57 | 2.5 | 57 | 4 | 58.4 | 2.5 | X | X | |||
| AE987-R | AGGTGTTGCATATNTATYWACTGG | 24 | 33-42 | ||||||||||||
|
|
|
|
|||||||||||||
| cox1 | AE971-F | AGTCATGTAATMTCWACTAAYTAYTC | 26 | 23-35 | 507 | 56 | 2.5 | 56 | 4 | X | |||||
| AE973-R | AACTACTCCTAYRAARAATAACATTG | 26 | 23-35 | ||||||||||||
FS is the amplicon fragment size including primer region, and Ta is the annealing temperature.
These primers can be used for a nested PCR.
Primer published by Bensch et al. 2000. (A) Evolutionary dynamics of infectious diseases Laboratory at the Institute for Genomics and Evolutionary Medicine (iGEM), Temple University-USA, (B) P. B. Šivickis Laboratory of Parasitology, Institute of Ecology, Nature Research Centre, Lithuania, and (C) Host-Parasite Relationship Laboratory at Universidad Nacional de Colombia, Colombia. (L) Leucocytozoon spp., (H) Haemoproteus (Parahaemoproteus) spp., and (P) Plasmodium spp. X corresponds to positive amplifications. Cox1, cytochrome c oxidase subunit 1; cox3, cytochrome c oxidase subunit 3; and cytb, cytochrome b.
2.2.Samples and PCR protocols
Supplementary Table S1 describes the parasite species (cytb lineage code/sample ID), host and intensity of parasitemia (%) of the samples used in each laboratory. The intensity of parasitemia was estimated by each laboratory as a percentage by actual counting of the number of parasites per 10,000 erythrocytes.
2.2.1. Evolutionary Dynamics of Infectious Diseases Laboratory, USA (laboratory A)
Archived field samples and laboratory strains of haemosporidian parasites were used to test all the primers described in Table 1 (Supplementary Table S1). Genomic DNA was extracted from whole blood or tissues (liver) using a DNeasy® Blood & Tissue Kit (Qiagen, GmbH, Hilden, Germany). DNA from parasite lineages which have been previously published, from lizards and birds as well as well-known human parasites, were amplified as follows: PCRs were carried out in 50 μl with 2 μl of total genomic DNA, 2.5 mM MgCl2, 1X PCR buffer, 0.2 mM of each deoxynucleoside triphosphate, 0.4 mM of each primer, and 0.03 U/μl of AmpliTaq polymerase (Applied Biosystems, Roche, USA). Amplification conditions for all PCRs were: a partial denaturation at 94 °C for 4 min, 36 cycles of 1 min at 94 °C, 1 min at primer melting temperature (°C, Table 1) and 2 min extension at 72 °C, with a final extension of 10 min added to the last cycle. A negative control (dH2O), and positive control (Plasmodium vivax) were included. All amplifications were evaluated by running the total PCR products (50 μl) on a 1% agarose gel. Bands with the expected molecular size were excised from the gel (the size depended of the pair of primer, Table 1), purified using an QIAquick® Gel extraction kit (Qiagen, GmbH, Hilden, Germany), and both strands for each PCR product were sequenced with the corresponding pairs of primers using an Applied Biosystems 3730 capillary sequencer. The obtained sequences were confirmed using Basic Local Alignment Search Tool (BLAST, at the National Center for Biotechnology Information: https://blast.ncbi.nlm.nih.gov/Blast.cgi) and those were aligned by using ClustalX v2.0.12 and Muscle as implemented in SeaView v4.3.5 (Gouy et al., 2010). The primers designed and tested in laboratory A were validated at the P. B. Šivickis Laboratory of Parasitology, Lithuania (laboratory B) and Host-Parasite Relationship Laboratory, Colombia (laboratory C), each using their own samples. Primer annealing temperature (°C) and MgCl2 concentration for each pair of primers used by each laboratory are also shown in Table 1 for comparison.
2.2.2. P. B. Šivickis Laboratory of Parasitology, Lithuania (laboratory B)
Archived Haemoproteus, Leucocytozoon and Plasmodium parasite samples were obtained from naturally infected birds captured at the Biological Station of the Zoological Institute of the Russian Academy of Sciences on the Curonian Spit in the Baltic Sea, following the current laws of Lithuania and Russia (Supplementary Table S1). Whole blood samples were stored in SET buffer (0.05 M Tris, 0.15 M NaCl, 0.5 M EDTA, pH 8.0). Parasite species and their lineages were identified by microscopic examination of blood films and PCR targeting the cytb gene, respectively. Samples with single infections, as determined both by microscopic examination and PCR-based testing, were used in this study (Supplementary Table S1). Total DNA was extracted from samples using an ammonium acetate extraction method (Richardson et al., 2001). Quantification of DNA was performed by using a Nanodrop spectrophotometer (IMPLEN Nanophotometer P330). The samples, in which the total DNA concentration exceeded 100 ng/μl, were resolved with TE buffer (10 mM Tris, 1 mM EDTA) to a final DNA concentration of 41 ± 5.3 ng/μl.
Using the genomic DNA from single infections, 12 experimental mixes of different haemosporidian combinations were prepared for primer testing (Supplementary Table S1). Such mixed infections often occur naturally in wildlife in Europe (Valkiūnas et al., 2006; Dimitrov et al., 2014, 2015). In all cases, 15 μl of total DNA of a similar concentration of each parasite lineage was used for the preparation of mixes. Bernotienė et al. (2016) provided a detailed description of preparation of the experimental parasite mixes.
All PCRs were performed in 25 μl reactions with 2 μl of total genomic DNA, 0.2 mM of each deoxynucleoside triphosphate, 0.4 mM of each primer, and 12.5 μL of DreamTag Master Mix (it includes DreamTaq DNA Polymerase, 2X DreamTaq buffer, 0.4 mM each dNTP, and 4 mM MgCl2; Thermo Fisher Scientific, Lithuania). One negative control (nuclease-free dH2O) and one positive control (an infected sample, which was positive by microscopic examination of blood films) were used. Amplification conditions for all PCRs were the same as used by laboratory A. All amplifications were evaluated by running 3 μl of the final PCR products on 2% agarose gels. PCR products from all positive amplifications were precipitated with ammonium acetate and 95% ethanol, and were sequenced with corresponding primers twice for both strands. We used dye terminator cycle sequencing (Big Dye) and loaded samples onto an ABI 201 PRISM TM 3100 capillary sequencing robot (Applied Biosystems, USA). The obtained sequences were aligned and analyzed using the Bioedit program (Hall, 1999). Mixed infections were determined by visualizing double-base calling in sequence electropherograms, and sequences obtained from experimental mixes were compared with corresponding sequences from initial single parasite infections.
2.2.3. Host-Parasite Relationship Laboratory, Colombia (laboratory C)
Archived samples with naturally mixed infections were used to test only primer sensitivity (Supplementary Table S1). Parasites species and their lineages were previously identified by examination of blood films using microscopy, PCR targeting the cytb gene, and sequencing. Total DNA was extracted from whole blood samples preserved in SET buffer or EDTA using a phenol-chloroform method (Sambrook et al., 1989), Zymo DNA Purification kit (Zymo Research Inc., Orange, USA) or DNeasy Blood & Tissue kit (Qiagen, GmbH, Hilden, Germany). Quantification of the total DNA was performed by using a Nanodrop spectrophotometer (Thermo Fisher Scientific, California, USA). Quality of the extracted DNA was verified by PCR with primers targeting the host cytbgene (Sawabe et al., 2010).
All PCRs targeting the cytb gene were carried out in 50 μl reactions with 2 μl of total genomic DNA, 2.5 mM MgCl2, 1X PCR buffer, 0.2 mM of each deoxynucleoside triphosphate (Promega, Madison, Wisconsin), 0.4 mM of each primer, and 0.03 U/μl of Taq DNA polymerase (Fermentas, Thermo Fisher Scientific, USA). Amplification conditions for all PCRs were the same as used by laboratory A. However, PCRs for cox3 were also carried out in 50 μl following the cytb protocol used by Bernotienė et al. (2016). In the case of cox1, different PCR protocols, which have been used for cytb and cox1, were also tested (Bensch et al., 2000; Hellgren et al., 2004; Beadell et al., 2004; Martinsen et al., 2008; Pacheco et al., 2011; Bernotienė et al., 2016). In all cases, a negative control (dH2O), and a positive control (infected bird sample) were included. Amplifications were visualized by running 3 μl of PCR products on a 1.5% agarose gel stained with SYBR™ Safe DNA Gel Stain (ThermoFisher Scientific, California, USA). Total PCR products were precipitated with ammonium acetate and 95% ethanol (Bensch et al., 2000), and bi-directional sequencing of amplification products was conducted using a 3730xl DNA Analyzer (Applied Biosystems, Foster City, USA). Then all sequences were aligned using MEGA v7.0 (Kumar et al., 2016) and the lineages were confirmed using BLAST.
2.3. Primer sensitivity and specificity
The primers are compared in terms of their sensitivity (or probability of detecting the parasite DNA if the host is infected) and specificity (true negative rate) as those were independently estimated for the results from each laboratory.
Sensitivity was calculated as = , and specificity as = .
2.4. Nested multiplex PCR for differential DNA amplification of Haemoproteus and Plasmodium spp. from field isolates
Using the genomic DNA from single infections of four bird parasite lineages that were previously characterized by laboratory B, four experimental mixes from a combination of 10 μl of total DNA from each species were prepared (see Fig. 3 for lineage combinations and initial parasitemias). The mixed DNAs were amplified by a nested multiplex PCR as follows: first, a primary amplification was performed using primers AE298/AE299, and the reaction was carried out in 50 μl with 4 μl of total mixed genomic DNA, 2.5 mM MgCl2, 1X PCR buffer, 1.25 mM of each deoxynucleoside triphosphate, 0.4 mM of each primer, and 0.03 U/μl of AmpliTaq polymerase (Applied Biosystems, Roche-USA). Amplification conditions for the PCR were: a partial denaturation at 94 °C for 4 min, 25 cycles with 1 min at 94 °C, 1 min at 55°C and 2 min extension at 72 °C, with a final extension of 10 min added to the last cycle. Second, a nested-multiplex PCR was done using both pairs of primers, AE980/982 and AE983/985. PCRs were also carried out in 50 μl with 1 μl of the primary PCR, 2.5 mM MgCl2, 1X PCR buffer, 1.25 mM of each deoxynucleoside triphosphate, 0.4 mM of each primer, and 0.03 U/μl of AmpliTaq polymerase (Applied Biosystems, Roche-USA). Amplification conditions for the PCR were: a partial denaturation at 94 °C for 4 min, 30 cycles with 1 min at 94 °C, 1 min at 59°C and 2 min extension at 72 °C, with a final extension of 10 min added to the last cycle. A negative control (dH2O) was included in both PCRs. Then, all amplifications were evaluated by running the total PCR products (50 μl) on a 1.5% agarose gel. Other primer combinations were tested as part of the nested multiplex PCR protocols, but those showed low specificity (e.g., AE989/982 and AE983/985 or AE989/982 and AE986/987) so only the combination of the pair of primers that gave positive amplification are reported.
Fig. 3.

Experimental design and results of a nested multiplex PCR for PCR detection and differential DNA amplification of haemosporidian parasite genera of parasites belonging to Plasmodium (P.) and Haemoproteus (H.) genera. Parasites, linages and parasitemias are shown. The numbers correspond to the parasite species and the combination of experimental mixed infection used to test this protocol. (A) Evolutionary dynamics of infectious diseases Laboratory. at the Institute for Genomics and Evolutionary Medicine (iGEM), Temple University-USA, (B) P. B. Šivickis Laboratory of Parasitology, Institute of Ecology, Nature Research Centre, Lithuania, and (C) Host-Parasite Relationship Laboratory at Universidad Nacional de Colombia, Colombia (see Fig. 2). *Correspond to the Haemoproteus lineage and # no lineage has been identified for Leucocytozoon danilewskyi. Plasm., Plasmodium.
Furthermore, this nested multiplex protocol was tested at the laboratories B and C. Although the same conditions for the PCR were used, laboratories B and C used different Taq DNA polymerases (DreamTaq Master Mix, Thermo Fisher Scientific-Lithuania, and Taq DNA polymerase, Thermo Scientific, Fermentas, USA, respectively) and samples with experimental (laboratory B) or naturally mixed infections (laboratory C) (see Fig. 3 for lineage combinations and initial parasitemias). In addition to primers AE298/AE299 for the primary PCR, the combination of primers AE974/299 was also tested.
2.5. Phylogenetic signal of cytb and cox3 fragments
To show the differences in phylogenetic signal (whether there are informative sites to solve phylogenetic relationships between a given set of taxa) of the cytb (479 bp from the commonly used primers or 1065 bp from the primers reported here) and cox3 (761 bp from the primers reported here) fragments, three alignments were constructed using 70 mtDNA genome sequences available for Leucocytozoon, Haemoproteus and Plasmodium spp. (Pacheco et al., 2018); two alignments for cytb fragments (479 bp and 1065 bp), and one using concatenated cytb + cox3 fragments (1065 bp + 761 bp= 1826 bp) (DOI: http://dx.doi.org/10.17632/jtz23sgttf.1). In all cases, the primer regions were not included in these alignments. Then, phylogenetic relationships were estimated by Bayesian methods implemented in MrBayes v3.2.6 with the default priors (Ronquist and Huelsenbeck, 2003). A general time reversible model with gamma-distributed substitution rates and a proportion of invariant sites (GTR+ Γ +I) was used for each alignment; it was the model with the lowest Bayesian Information Criterion (BIC) scores as estimated by MEGA v7.0.14 (Kumar et al., 2016). Bayesian support for the nodes was inferred in MrBayes by sampling every 500 generations from two independent chains lasting 2 ×10⁶ Markov Chain Monte Carlo (MCMC) steps. The chains were assumed to have converged once the average standard deviation of the posterior probability was below 0.01 and the value of the potential scale reduction factor (PSRF) was between 1.00 and 1.02 (Ronquist and Huelsenbeck, 2003). As a “burn-in,” 50% of the sample was then discarded once convergence was reached.
3. Results
New sets of primers for detection/phylogenetic analysis and differential DNA amplification of avian haemosporidian mitochondrion genes were successfully tested at three laboratories (Table 2) following their own practices and protocols (Table 1). Sensitivity and specificity results are shown as a proportion (instead of %) due to the differences in the numbers of well-characterized samples that each laboratory was able to use. However, no major inconsistencies in the results were found between laboratories, so an overall percentage was estimated, combining all the results for each pair of primers (Table 3).
Table 2.
Results for PCR assays using the new sets of primers for detection/phylogenetic analysis and differential DNA amplification of parasites belonging to three avian haemosporidian genera.
| Lab. | Detection/phylogenetic analysis
|
Differential DNA amplification
|
||||||||||
|---|---|---|---|---|---|---|---|---|---|---|---|---|
| Gene | cytb | cox3 | cytb (for H. spp.) | cytb (for P. spp.) | cox1 (for P. spp.) | |||||||
|
|
|
|
||||||||||
| Primer codes (pairs)/parasites species | 298/299 | 064/066 | 974/299 | 959/961 | 980/982 | 989/982 | HaemF/982 | 983/985 | 986/987 | 971/973 | ||
|
|
|
|
||||||||||
| A | Field and strain isolates | Leucocytozoon danilewskyi + Haemoproteus noctuae (hCIRCUM01) | H. (+) | H. (+) | H. (+) | H. (+) | H. (+) | H. (+) | H. (+) | (-) | L. (+) | (-) |
| Leucocytozoon sp. (PA262) | L. (+) | L. (+) | L. (+) | L. (+) | (-) | (-) | (-) | (-) | L. (+) | (-) | ||
| Haemoproteus macrovacuolatus (CA1017) | H. (+) | H. (+) | H. (+) | H. (+) | H. (+) | H. (+) | H. (+) | (-) | (-) | (-) | ||
| Haemoproteus lanii (hRB1) | H. (+) | H. (+) | H. (+) | H. (+) | H. (+) | H. (+) | H. (+) | (-) | (-) | (-) | ||
| Plasmodium kentropyxi (Cngra_01) | P. (+) | P. (+) | P. (+) | P. (+) | (-) | (-) | (-) | P. (+) | P. (+) | P. (+) | ||
| Plasmodium ashfordi (GRW02) | P. (+) | P. (+) | P. (+) | P. (+) | (-) | (-) | (-) | P. (+) | (-) | P. (+) | ||
| Plasmodium unalis (TFUS06) | P. (+) | P. (+) | P. (+) | P. (+) | (-) | (-) | (-) | P. (+) | P. (+) | P. (+) | ||
| Plasmodum vivax (Salvador I) | P. (+) | P. (+) | P. (+) | P. (+) | (-) | (-) | (-) | P. (+) | (-) | P. (+) | ||
| Plasmodium falciparum (3D7) | P. (+) | P. (+) | P. (+) | P. (+) | (-) | (-) | (-) | P. (+) | (-) | P. (+) | ||
|
|
|
|
||||||||||
| B | Single infections | Leucocytozoon sp. (ITUMER01) | * | * | L. (+) | L. (+) | (-) | * | * | (-) | L. (+) | (-) |
| Haemoproteus tartakovskyi (hSISKIN1) | * | H. (+) | H. (+) | H. (+) | H. (+) | H. (+) | H. (+) | (-) | (-) | (-) | ||
| H. lanii (hRB1) | * | H. (+) | * | (-) | H. (+) | H. (+) | H. (+) | (-) | (-) | (-) | ||
| Plasmodium relictum (pSGS1) | * | P. (+) | * | P. (+) | (-) | (-) | (-) | P. (+) | P. (+) | P. (+) | ||
| P. relictum (pGRW4) | * | P. (+) | * | (-) | (-) | (-) | (-) | P. (+) | (-) | P. (+) | ||
| Plasmodium circumflexum (pTURDUS1) | * | P. (+) | P. (+) | P. (+) | (-) | (-) | (-) | P. (+) | P. (+) | P. (+) | ||
|
|
|
|
||||||||||
| Experimentally mixed infections | P. relictum (pSGS1 (1)) + P. relictum (pGRW4) | * | 1 (+) | (-) | 1 (+) | (-) | (-) | (-) | (-) | 1 (+) | 1 (+) | |
| P. circumflextum (pTURDUS1 (2)) + P. relictum (pSGS1) | * | 2 (+) | (-) | 2 (+) | (-) | (-) | (-) | 2 (+) | 2 (+) | * | ||
| Plasmodium elongatum (pERIRUB1 (3)) + P. relictum (pSGS1) | * | 1 (+) | * | 1 (+) | (-) | (-) | (-) | 3 (+) | 3 (+) | 3 (+) | ||
| Leucocytozoon sp. (ITUMER01) + P. relictum (pSGS1) | * | * | * | L. (+) | (-) | * | * | (-) | L. (+) | * | ||
| Leucocytozoon sp. (ITUMER01) + P. relictum (pGRW4) | * | * | * | L. (+) | (-) | * | * | (-) | L. (+) | * | ||
| Haemoproteus. parabelopolskyi (hSYBOR1) + Haemoproteus belopolskyi (hHIICT1) | * | * | * | * | * | * | * | (-) | * | (-) | ||
| H. tartakovskyi (hHAWF1) + P. relictum (pSGS1) | * | H. (+) | (-) | P. (+) | H. (+) | H. (+) | H. (+) | (-) | P. (+) | P. (+) | ||
| H. lanii (hRB1) + P. relictum (pSGS1) | * | P. (+) | (-) | P. (+) | H. (+) | H. (+) | H. (+) | (-) | P. (+) | P. (+) | ||
| Haemoproteus tartakovskyi (hSISKIN1) + P. relictum (pSGS1) | * | P. (+) | * | H. (+) | H. (+) | H. (+) | H. (+) | (-) | (-) | P. (+) | ||
| Haemoproteus minutus (hTURDUS2) + P. relictum (pSGS1) | * | H. (+) | * | H. (+) | H. (+) | (-) | H. (+) | (-) | (-) | P. (+) | ||
| Haemoproteus. motacillae (hYWT1) + P. relictum (pSGS1) | * | P. (+) | * | (-) | H. (+) | H. (+) | H. (+) | (-) | (-) | (-) | ||
| H. parabeloposkyi (hSYBOR1) + P. relictum (pSGS1) | * | P. (+) | * | P. (+) | H. (+) | H. (+) | H. (+) | (-) | (-) | P. (+) | ||
|
|
|
|
||||||||||
| C | Field samples (mixed infections) | Leucocytozoon sp. + Haemoproteus sp. (OT412) | * | * | (-) | (-) | (-) | (-) | (-) | * | (-) | * |
| Leucocytozoon sp. + Haemoproteus sp. (PA215) | * | * | (+) | (-) | (+) | H. (+) | * | * | L. (+) | (-) | ||
| Leucocytozoon sp. + Haemoproteus sp. (OT611) | * | * | (+) | (+) | (+) | H. (+) | H. (+) | * | (-) | * | ||
| Leucocytozoon sp. + Haemoproteus sp. (PA220) | * | * | (+) | H. (+) | (+) | H. (+) | H. (+) | * | L. (+) | (-) | ||
| Leucocytozoon sp. + Haemoproteus sp. (PA287) | * | * | (+) | (-) | (+) | (-) | (-) | * | (-) | * | ||
| Leucocytozoon sp. + Haemoproteus sp. (PA046) | * | * | (+) | H. (+) | H. (+) | (-) | * | * | L. (+) | (-) | ||
| Leucocytozoon sp. + Haemoproteus coatneyi (OT 490) | * | * | (-) | (-) | (-) | (-) | (-) | * | (-) | * | ||
| Leucocytozoon sp. + H. coatneyi (OT632) | L. (+) | L. (+) | (+) | L. (+) | H. (+) | * | * | * | L. (+) | * | ||
| Leucocytozoon sp. + H. coatneyi (PA005) | * | * | (+) | L. (+) | (+) | H. (+) | * | * | L. (+) | (-) | ||
| Leucocytozoon majoris + H. coatneyi (PA022) | * | * | (+) | H. (+) | (+) | H. (+) | H. (+) | * | (-) | * | ||
| Leucocytozoon sp. + Plasmodium homopolare (OT597) | * | * | (+) | (+) | * | * | * | P. (+) | L. (+) | (-) | ||
| Leucocytozoon sp. + P. homopolare (OT601) | * | * | (+) | (+) | * | * | * | P. (+) | L. (+) | * | ||
| Leucocytozoon fringillinarum + Plasmodium sp. (OT615) | * | * | (+) | L. (+) | * | * | * | P. (+) | L. (+) | (-) | ||
| Leucocytozoon sp. + Plasmodium unalis (OT761) | * | * | (+) | (-) | * | * | * | P. (+) | (-) | (-) | ||
| L. majoris + Plasmodium lutzi (PA047) | * | * | (+) | H. (+) | * | * | * | P. (+) | L. (+) | (-) | ||
| Leucocytozoon sp. + Haemoproteus sp. + Plasmodium sp. (PA300) | * | * | (+) | H. (+) | H. (+) | * | * | P. (+) | L. (+) | * | ||
| Haemoproteus sp. + Plasmodium sp. (PA206) | H.+P. (+) | H.+P. (+) | (+) | H. (+) | H. (+) | (-) | H. (+) | P. (+) | (-) | (-) | ||
Sample not tested.
(A) Evolutionary dynamics of infectious diseases Laboratory at the Institute for Genomics and Evolutionary Medicine (iGEM), Temple University-USA, (B) P. B. Šivickis Laboratory of Parasitology, Institute of Ecology, Nature Research Centre, Lithuania (mixes were produced by mixing extracted DNA, see the Methods), and (C) Host-Parasite Relationship Laboratory at Universidad Nacional de Colombia, Colombia. (L) Leucocytozoon spp., (H) Haemoproteus (Parahaemoproteus) spp., and (P) Plasmodium spp. (+) PCR with positive and (-) negatives amplifications. Cox1, cytochrome c oxidase subunit 1; cox3, cytochrome c oxidase subunit 3; and cytb, cytochrome b.
Table 3.
Sensitivity and specificity of the different sets of primers targeting mtDNA genes designed for both PCR detection and differential DNA amplification of parasites belonging to three genera of avian haemosporidian parasites.
| Lab. | Measure | Haemosporidian detection/phylogenetic analysis
|
Differential DNA amplification of mixed infection with Plasmodium and Haemoproteus spp.
|
||||||||
|---|---|---|---|---|---|---|---|---|---|---|---|
| cytb | cox3 | cytb (H.) | cytb (P.) | cytb (P.+L.) | cox1 (P.) | ||||||
|
|
|
||||||||||
| 298/299 | 064/066 | 974/299 | 959/961 | 980/982 | 989/982 | HaemF/982 | 983/985 | 986/987 | 971/973 | ||
|
|
|
||||||||||
| A | Sensitivity | 9/9 | 9/9 | 9/9 | 9/9 | 3/3 | 3/3 | 5/5 | 5/5 | 2P./5, 2L./2 | 5/5 |
| Specificity | NA | NA | NA | NA | 6/6 | 6/6 | 4/4 | 4/4 | 3H./3 | 4/4 | |
| B (SI) | Sensitivity | * | 5/5 | 3/3 | 4/6 | 2/2 | 2/2 | 3/3 | 3/3 | 2P./3, 1L./1 | 3/3 |
| Specificity | NA | NA | NA | NA | 4/4 | 3/3 | 3/3 | 3/3 | 2H./2 | 3/3 | |
| B (EMI) | Sensitivity | * | 9/9 | 0/4 | 10/11 | 6/6 | 5/6 | 2/3 | 2/3 | 5P./11, 2L./2 | 7/8 |
| Specificity | NA | NA | NA | NA | 5/5 | 3/3 | 9/9 | 9/9 | 7H./7 | 1/1 | |
| C | Sensitivity | 23/32 | 23/32 | 15/17 | 12/17 | 10/12 | 5/10 | 7/7 | 7/7 | 0P./7, 10L./16 | 0/5 |
|
|
|
||||||||||
| Overall | Specificity % | 32/41=78 | 46/55=83.6 | 27/33=81.8 | 35/43=81.4 | 21/23=91.3 | 15/21=71.4 | 17/18=94.4 | 17/18=94.4 | 21P./26=80.8, 15L./21=100 | 15/21=71 |
| Sensitivity % | NA | NA | NA | NA | 15/15=100 | 12/12=100 | 16/16=100 | 16/16=100 | 23/23=100 | 8/8=100 | |
(A) Evolutionary dynamics of infectious diseases Laboratory at the Institute for Genomics and Evolutionary Medicine (iGEM), Temple University-USA, (B) P. B. Šivickis Laboratory of Parasitology, Institute of Ecology, Nature Research Centre, Lithuania (mixes were produced by mixing extracted DNA, see the Methods), and (C) Host-Parasite Relationship Laboratory at Universidad Nacional de Colombia, Colombia. (SI) Single infection and (EMI) experimentally mixed infections. (L) Leucocytozoon spp., (H) Haemoproteus (Parahaemoproteus) spp., and (P) Plasmodium spp. NA, do not apply. SI, single infections, EMI, Experimentally mixed infections.
Sample not tested. The overall specificity and the sensitivity are shown as a percentage (%) in bold. Cox1, cytochrome c oxidase subunit 1; cox3, cytochrome c oxidase subunit 3; and cytb, cytochrome b.
3.1. Haemosporidian parasite detection and phylogenetic analysis
In the case of PCR detection of haemosporidian parasites, cytb primers AE298/299 and AE974/299 were used for outer PCRs and then, if amplicons were not detected in an agarose gel, AE064/066 were used in a nested PCR. It is worth noting that laboratory C (Colombia) tested these two pairs of primers on a set of 32 field samples with single or mixed natural infections (Supplementary Table S2). Although there were differences in the success of DNA amplifications between laboratories, the overall sensitivity of these three cytb sets of primers was greater than 80% (Table 3). Similar results were also found for cox3 primers AE959/961 (Table 3). The Bayesian phylogenies estimated from the cytb and cox3 fragments are shown in Fig. 4 and Supplementary Fig. S1. Overall, the cytb fragment of 1065 bp (Fig. 4) and concatenated cytb/cox3 fragments (1826 bp) (Supplementary Fig. S1) gave phylogenies with well-solved clades.
Figure 4.
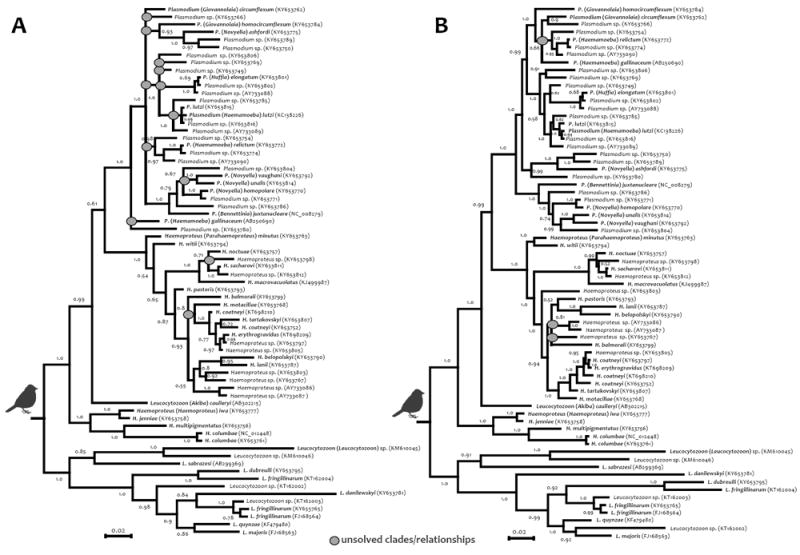
Bayesian phylogenetic hypotheses of avian haemosporidian parasites based on the partial cytochrome b gene (cytb) sequence (70 sequences, 479 bp (A) and 1109 bp (B)). The values at the nodes are posterior probabilities. Branches show the haemosporidian genera. Species names are shown in bold.
3.2. Differential DNA amplification of haemosporidian parasite genera
With regard to the five pairs of cytb primers designed for differential DNA amplification of haemosporidian parasite genera, the primer combinations AE980/982, AE989/982 and HaemF/AE982 amplified only DNA of Haemoproteus (Parahaemoproteus) spp. (Table 2). The overall sensitivity of these primers was higher than 71%, and the specificity was 100% (Table 3), thus these can be used for diagnosis and selective amplification of Haemoproteus during mixed infections with Plasmodium and/or Leucocytozoon spp. The cytb pair of primers AE983/985 amplified only DNA of Plasmodium spp. during mixed infections with Haemoproteus (Parahaemoproteus) spp. and/or Leucocytozoon spp. (Table 2). Their overall sensitivity was 94.4% with 100% specificity. However, the pair of primers AE986/987 amplified DNA of both Leucocytozoon and Plasmodium spp. In cases of Leucocytozoon and Plasmodium spp. mixes, these primers were biased towards amplifying Leucocytozoon spp. DNA, and in case of Plasmodium and Haemoproteus spp. mixes, they detected Plasmodium spp. (Tables 2 and 3).
The pair of primers AE971/973 only amplified DNA of the cox1 gene from Plasmodium spp. during mixed infections with Haemoproteus (Parahaemoproteus) spp. and/or Leucocytozoon spp. (Table 2) with 100% specificity (Table 3). In addition to this set of primers, a combination of primers, forward AE965 (5′ AAAGTTTTAGGWTTATAYTAYYTATGG 3′) and reverse AE966 (5′ AAGAGARCATAHCATATTCCAWCC ′3), that amplified a 1,296 bp fragment of the cox1 gene was only tested in laboratory A, using the same samples and PCR protocol but with 54°C for the annealing temperature. The specificity of this pair of primers was 100% (4/4) amplifying only DNA of Plasmodium spp. from bird (n=2) and lizard (n=1) samples, and human samples (n=2) with a sensitivity of 100% (5/5). Therefore, primers AE971/973 and AE965/966 (both targeting cox1) can be used for diagnosis and selective amplification of Plasmodium spp. It is worth noting that these two sets of primers also can be used to amplify Plasmodium spp. from lizards.
3.3. Nested multiplex PCR for differential DNA amplification of Haemoproteus and Plasmodium spp. from field isolates
Results from the three laboratories for the nested multiplex PCR for differential DNA amplification of Haemoproteus/Plasmodium spp. are shown in Fig. 3. All experimental or naturally mixed infections with a similar or different parasitemia of Plasmodium and Haemoproteus were successfully amplified. Although some unspecific products/background can be observed in the gels as a result of the nested protocol, the products (strong bands) at the proper sizes corresponded to Haemoproteus/Plasmodium spp. Indeed, given the sizes of the amplicons obtained from multiplexing both pairs of primers AE980/982 and AE983/985, the bands corresponding to each genus could be perfectly separated and excised from an agarose gel (1.5%) when a sample has a mixed infection with an equal or dissimilar parasitemia of Plasmodium and Haemoproteus spp. (see Table 4 and Fig. 3). Similarly, using the pair of primers AE974/299 for the primary PCR, people from laboratory C were also able to amplify their samples (data not shown). Thus, the three laboratories could successfully amplify and differentiate mixed Plasmodium and Haemoproteus infections using this single tube PCR multiplex assay.
Table 4.
Summary of the results of PCR assays using different sets of primers for detection/phylogenetic analysis and differential DNA amplification of avian haemosporidian parasites belonging to three genera.
| Gene | Code (pairs) | Notes | ||
|---|---|---|---|---|
| Haemosporidian detection/phylogenetic analysis | cytb | AE298-F | All three genera | • All 3 primer combinations amplified DNA of parasites belonging to Leucocytozoon, Haemoproteus and Plasmodium spp. Primers AE064/066 can be used as inner primes for a nested PCR. Due to the amplicon size, these new sets of primers can be used for detection and, only in the case of single infection, for phylogenetic analysis. |
| AE299-R | ||||
| AE974-F | ||||
| AE299-R | ||||
| AE064-F | ||||
| AE066-R | ||||
|
|
|
|||
| cox3 | AE959-F | •These primers amplified DNA of parasites belonging to Leucocytozoon, Haemoproteus and Plasmodium species. This fragment (995bp) can be used as a new molecular marker. | ||
| AE961-R | ||||
|
| ||||
| Differential DNA amplification of three avian haemosporidian genera | cytb | AE980-F | Haemoproteus | • These primers amplified only DNA of Haemoproteus (Parahaemoproteus) spp. thus can be used for diagnostics and selective amplification of Haemoproteus during mixed infections with Plasmodium and Leucocytozoon species. This set of primers can be also used for a nested-multiplex PCR with primers AE983/985. |
| AE982-R | ||||
| AE989-F | • These primers amplified only DNA of Haemoproteus (Parahaemoproteus) spp. thus can be used for diagnostics and selective amplification of Haemoproteus during mixed infections with Plasmodium and Leucocytozoon species. | |||
| AE982-R | ||||
| HaemF | • These primers also amplify only DNA of Haemoproteus (Parahaemoproteus) spp. HaemF can be used as an external primer for a semi-nested PCR, using primers AE989/AE982 as inner primers. | |||
| AE982-R | ||||
|
| ||||
| AE983-F | Plasmodium | •These primers amplified only DNA of Plasmodium spp. thus can be used for diagnostics and selective amplification of Plasmodium during mixed infections with Haemoproteus and Leucocytozoon species. This set of primers can be used for a nested-multiplex PCR with primers AE980/982. | ||
| AE985-R | ||||
| AE986-F | •These primers amplified DNA of Leucocytozoon and Plasmodium spp. In cases of Leucocytozoon/Plasmodium spp. mixes, these primers amplified DNA of Leucocytozoon spp., and in case of Plasmodium/Haemoproteus spp. mixes, they detect Plasmodium spp. | |||
| AE987-R | ||||
|
| ||||
| cox1 | AE971-F | Plasmodium | •This primer pair amplified only DNA of Plasmodium spp., thus can be used for diagnostics and selective amplification of Plasmodium spp. DNA during mixed infections with Haemoproteus and Leucocytozoon species. This fragment (507 bp) can be used as a new molecular marker. | |
| AE973-R | ||||
| AE965-F | •This primer pair amplified DNA of parasites belonging to Plasmodium species. This fragment might be used as a new molecular marker. | |||
| AE966-R | ||||
Cox1, cytochrome c oxidase subunit 1; cox3, cytochrome c oxidase subunit 3; and cytb, cytochrome b.
4. Discussion
The challenges faced by those describing the biodiversity of haemosporidian parasites cannot be equated to a well-defined diagnostic problem such as the differential detection of human malaria parasites. Yet, even when there is a handful of Plasmodium species causing human malaria, sensitivity is still an issue in the case of low parasitemias (sub-microscopic infections) or when there are mixed infections (e.g., Demas et al., 2011; Cheng et al., 2015). Thus, the situation is understandably more complex in wildlife biodiversity studies targeting a pool of parasite species with limited taxonomic information in a broad range of host species. Considering this context, a combination of microscopy and PCR assays (including restriction enzyme-based PCR, nested PCR, and quantitative PCR) has been used to detect avian haemosporidian infections and mixed infections, and to characterize parasite prevalence and genetic diversity across different host species and geographic locations. However, not surprisingly, the specificity and sensitivity across methods depend on several factors such as the intensity of infection (parasitemia), the combination of parasite lineages present in a sample, and target (parasite) DNA quantity and quality. As a result, failure in detection of a clearly visible and even predominant parasite in blood samples, lineages or mixed infections of Plasmodium and Haemoproteus spp. has often been reported in avian malaria research (Pérez-Tris and Bensch, 2005; Valkiūnas et al., 2006, 2016; Martínez et al., 2009; Zehtindjiev et al., 2012; Schaer et al., 2015; Bernotienė et al., 2016). The PCR protocols currently in use underestimate haemosporidian mixed infections of different species and genetic lineages of haemosporidian parasites that are predominant in wildlife (Pérez-Tris and Bensch, 2005; Zehtindjiev et al., 2012; Bernotienė et al., 2016). That is expected because PCR assays currently used on avian parasites target conserved regions of mitochondrial genes (e.g., cytb) of haemosporidians (Bensch et al., 2000; Richard et al., 2002; Beadell et al., 2004; Hellgren et al., 2004). Here, new sets of haemosporidian mitochondrial primers (especially the cytb gene), designed for both PCR detection (longer fragments, >995 bp) and differential DNA amplification of haemosporidian parasite genera are reported (Table 4). It is important to highlight that, in order to fully characterize mixed infections with different species from the same or different genera, methods such as cloning or next-generation sequencing (NGS) are required (e.g., Pacheco et al., 2011; Barbosa et al., 2017). However, the genus-specific primers reported here can mitigate, at least in part, the problem of mixed infections by allowing the detection of two species from different genera. Although these primers have high sensitivity and specificity (in the case of differential DNA amplification), there are important factors that need to be considered when standardizing this PCR protocol (or any other) in the context of a specific investigation.
The implementation of a PCR detection protocol should consider the intensity of infections (parasitemias) since it determines the quantity of target DNA (parasite DNA in the whole extraction that is expected to be mostly DNA from the host). Parasitemia patterns can change not only between parasite species and hosts but also geographically. The amount of total DNA has a noticeable effect on the outcome of a PCR procedure since both an excess or insufficient amount of template are the most common causes of failure. Although counterintuitive, the use of too much total DNA template results in false priming and even poor DNA synthesis during the elongation phase of the PCR. On the other hand, when the total amount of the DNA template is extremely low, there is a greater probability of loss due to a number of possible causes such as clotting, adsorption, and/or chemical or enzymatic degradation. Furthermore, a small amount of target DNA increases the risk of contamination from impurities that can get into the PCR mix (Altshuler, 2006).
PCR failure can also occur when the ratio of target DNA (e.g., parasite cytb) to non-target DNA (e.g., host DNA) is very low. In this case, the concentration of the target DNA should be considered in the number of cycles used in the reaction. In our hands, using an elevated concentration of the target DNA combined with the normal or higher than normal number of cycles can cause the accelerated accumulation of non-specific products. To avoid this, reducing the number of cycles is highly recommended. Indeed, low concentrations of primer, target, Taq, magnesium, and nucleotides are recommended as these generally ensure cleaner amplification products and lower background (Altshuler, 2006). For blood parasites such as haemosporidians, estimating the right amount of DNA to be used in a PCR assay is problematic. The total amount of the DNA extracted contains DNA from the host (non-target DNA) as well as the parasite (target DNA). Thus, measurements of total DNA mostly correspond to the vertebrate host. Given that the concentration of target DNA is determined by the intensity of the infection or parasitemia, whenever the parasitemia is considered high (by blood-smear microscopy) it is recommended to make serial dilutions, including a non-diluted sample, of the original DNA extraction to do the PCRs. In this study, the dilution of the original extraction improved the PCR sensitivity when parasitemia exceeded 2%. On the contrary, when the parasitemia is very low (not or hardly detectable by blood-smear microscopy), increasing the amount of total DNA is suggested. In the case of a mixed infection, the amount of total target DNA is the result of an unknown ratio of the lineages present in the mix (different parasitemias), so serial dilutions of the total DNA extraction are also recommended. Finally, it is worth mentioning that the yield of the PCR evidenced by the strength of the band observed in an agarose gel is also affected by the parasitemia. Many protocols standardize the amount of PCR product used to observe a band in an agarose gel (e.g., 2 ul); however, low parasitemias will produce an almost imperceptible band with such a small amount of product. A simple way to mitigate this problem is to load the entire PCR product (e.g., 25 or 50 ul) in the gel and then excise the band with the expected size for sequencing if it is needed.
Since DNA extraction is an important stage in molecular detection, it requires a sensitive and cost-effective method. With regard to quantity/quality, the DNA concentration and total yield of extracted DNA vary between the methods. For example, Phenol-Chloroform protocols can extract significantly more concentrated DNA compared with other protocols such as commercial kits without any protocol modifications (Psifidi et al., 2015). Although this protocol yielded highly concentrated DNA, in some cases DNA pellet could be lost and PCR inhibitors can be present. Thus, it is important to consider all these factors before processing field samples, in order to obtain enough target DNA and achieve a successful PCR amplification.
Primers for detection of haemosporidian parsites reported in this investigation (group 1, see Table 1) successfully amplify larger fragments of cytb (1109 to 1741 bp) and cox3 (761 bp) genes of three genera included in this study. These fragments have more informative sites that can be used for phylogenetic reconstruction methods. Indeed, when a comparison of phylogenies was made using Bayesian approaches with cytb fragments (479 bp and 1065 bp, without primer regions), and concatenated cytb/cox3 genes (1826 bp), better results were obtained for both cytb (1065 bp) and cytb/cox3 (1826 bp) gene phylogenies with more well-supported clades (Fig. 4, Supplementary Fig. S1). It is worth noting that phylogenetic studies using single genes or the concatenation of cytb and cox3 genes/fragments only can be done when a single infection in the host samples has been confirmed by microscopic, nested PCR, and careful visual inspection of the electropherograms.
Likely because it was the first mitochondrial gene used in a haemosporidian parasite phylogeny (Escalante et al., 1998), a cytb fragment (479 bp) has been the marker of choice in ecological, taxonomic and phylogenetic investigations of avian malaria parasites. Although usually insufficient for accurate phylogenetic reconstructions due to its limited number of sites (Fig. 4), this fragment has allowed the correct identification of morphologically distinct species currently available (Bensch et al., 2009; Outlaw and Ricklefs, 2014; Lotta et al., 2016; Pacheco et al., 2018). Given that there is no evidence indicating that the haemosporidian cytb gene is saturated, it has approximately the same A/T content across species, and exhibits a relatively high substitution rate of evolution (Escalante et al., 1998; Perkins, 2008; Pacheco et al., 2018), this gene (not the small fragment) is a suitable molecular marker to be used in phylogenetic studies (Fig. 4). However, the cox3 gene could also be a good candidate to be considered for barcoding studies. Indeed, these mitochondrial genes evolved at distinct rates, with cox3 having the highest substitution rate (0.00474 substitutions/site/million years), followed by cytb (0.00419) and cox1 (0.00371) (Pacheco et al., 2018). In all cases, the use of DNA barcoding approaches requires development of criteria for species delimitation that can link taxa, usually described by using morphology, to molecular data, including understanding the geographic variation of species at the molecular level (Bergsten et al., 2012).
This study showed a sensitive methodology that can be used to estimate the parasite diversity and prevalence in single or mixed infections by two species of different genera. Although mixed infections of haemosporidian parasites are common in wild bird species worldwide, (Valkiūnas et al., 2003, 2006; Beadell et al., 2004; Pérez –Tris and Bensch, 2005; Loiseau et al., 2010; Silva-Iturriza et al., 2012; Dimitrov et al., 2014; González et al., 2014; Lotta et al., 2016; Mantilla et al., 2016), their detection involves methodologies that are difficult to apply in biodiversity research due to parasite lineage/species combinations which are difficult to predict and heterogeneity in their parasitemias. These characteristics are often unique to each field study site and bird population. The situation is particularly difficult in tropical areas where the diversity of haemosporidian parasites is often high and remains insufficiently described (Loiseau et al. 2010; González et al., 2014; Lotta et al., 2016; Mantilla et al., 2016). The genus-specific primers proposed here can mitigate this problem by improving the differential detection of parasites belonging to different genera by PCR assays. Primers successfully tested in this study are promising, although more assays need to be done by the avian malaria community to standardize those. A summary of the results obtained for each genus-specific pair of primers is given in Table 4 and Supplementary Table S3. The tables also indicate whether or not the obtained amplicons overlap with the data available in the Malavi databases (http://mbio-serv2.mbioekol.lu.se/Malavi/, Bensch et al., 2009).
Taking advantage of genus-specific primers reported here, a novel nested multiplex PCR protocol is proposed for differential DNA amplification of Haemoproteus/Plasmodium spp. Importantly, this protocol provides an opportunity to determine the presence of mixed infections of parasites belonging to these genera in blood samples, avoiding the sequencing stage. Whereas there are apparently more combinations, it is important to consider the primer specificity when preparing a multiplex assay, especially since competition exists when multiple target sequences are in a single reaction vessel. Here, out of all possible pairs of primer combinations tested for the nested multiplex PCR, only the combinations of primers AE980/982 and AE983/985 gave excellent results. These primers (AE980/982 and AE983/985) could be used in a multiplex without nesting the PCR (no primary amplification with AE298/299) if lineages of both species have high parasitemias.
Importantly, the combination of other genus-specific primers gave cross-annealing between primer pairs. As an example, two bands with different molecular sizes were observed in a multiplex experiment with different primers, but both were the same Plasmodium spp. as corroborated by sequencing. Nevertheless, the multiplex PCR assay proposed here using primers AE980/982 and AE983/985 performed well across laboratories, providing an inexpensive, fast and easy method that not only can be used to detect Haemoproteus and Plasmodium parasites but also mixed infection with these species at the same time. The expenses of reagents and preparation time is less in multiplex PCR than in systems where several tubes of single PCRs are used. A multiplex reaction is ideal for conserving templates in short supply. Another advantage of a nested multiplex PCR is that false negatives are often revealed in multiplex assays because each amplicon provides an internal control for the other amplified fragments. However, it is worth noting that nested PCRs (single or multiplex) are prone to contamination simply because aerosol DNAs, which otherwise are not detected, could be accidentally amplified. The development of rigorous cleaning protocols and good practices such as including multiple negative controls are especially important whenever nested PCR protocols are implemented.
The results from a nested multiplex PCR such as the one proposed here can help to identify whether all haemosporidian blood stage parasites observed in a blood-smear correspond to single or different genera, avoiding parasite misidentification, particularly at the stage of young gametocytes and/or trophozoites of Plasmodium and Haemoproteus spp. This is an important diagnostic issue in wildlife when only young blood stages are available in blood smears (Valkiūnas, 2005) and/or new species are present. It is difficult and often even impossible to distinguish young blood stages of parasites belonging to these two genera under a light microscope during mixed infections. It is worth noting that detection of mixed infection with different lineages of the same genus is still challenging and it only can be done by methods which are more expensive and laborious such as cloning or NGS (e.g., Pacheco et al., 2011; Barbosa et al., 2017). If cloning is the method of choice, it is recommended to clone two or three independent PCR products using reagents of high quality and sequencing more than three clones for PCR products to reduce the problems associated with this technique (see Pérez-Tris and Bensch, 2005). NGS is likely the future preference for parasite biodiversity studies. However, it requires development of suitable protocols and bioinformatic expertise (e.g., Barbosa et al., 2017). We anticipate that the proposed primers could be adapted for NGS target deep-sequencing approaches.
In summary, new sets of haemosporidian mitochondrial primers (especially the cytb gene), designed for both PCR detection (longer fragments, >995 bp) and differential DNA amplification of haemosporidian parasite genera were tested under different laboratory working conditions (equipment, reagents) with promising results (Table 4, Supplementary Table S3). These primers have high sensitivity and specificity, and the novel nested-multiplex PCR protocol could be an excellent tool for detection and characterization of haemosporidian infections. More importantly, the amplicons obtained using these primers also overlap with the data that is already available in the different databases, allowing the comparison of new data with those sequences already available.
Supplementary Material
Supplementary Fig. S1. Bayesian phylogenetic hypotheses of avian haemosporidian parasites based on concatenated partial cytochrome b (cytb) and cytochrome c oxidase subunit 3 (cox3) genes (70 sequences and 1826 bp). The values at the nodes are posterior probabilities. Branch colors indicate the haemosporidian genus. Branch colors indicate the haemosporidian genus: Plasmodium sp. (blue), Haemoproteus (Parahaemoproteus) sp. (dark red), Leucocytozoon (Akiba) caulleryi (light red), Haemoproteus (Haemoproteus) sp. (orange), and Leucocytozoon sp. (green). Species names are shown in bold.
Highlights.
All pairs of primers were successfully tested at three laboratories.
Primers designed in this study exhibited high sensitivity.
Primers designed to separate parasite genera showed high specificity.
Nested multiplex PCR detect lineages of Plasmodium and Haemoproteus parasites in samples with mixed infections.
Amplicons obtained using these primers overlap with the fragments widely used by the community.
Acknowledgments
This work was supported in part by the US National Institutes of Health (grant R01 GM080586 to AAE, Temple University, USA), Research Council of Lithuania (grant MIP-045/2015 to GV), and by the División de Investigación y Extensión of the Universidad Nacional de Colombia (grant 37416 to AGC and NEM). Tatjana A. Iezhova, Vaidas Palinauskas, Dovilė Bukauskaitė and Mikas Ilgūnas are acknowledged for participation in field work and assistance in the laboratory in Vilnius, Lithuania. We thank all the students of the Host-Parasite Relationship Research Group at Universidad Nacional de Colombia, and the people from the DNA Laboratory at the School of Life Sciences (Arizona State University, USA) for their technical support during the sequencing process.
Footnotes
Publisher's Disclaimer: This is a PDF file of an unedited manuscript that has been accepted for publication. As a service to our customers we are providing this early version of the manuscript. The manuscript will undergo copyediting, typesetting, and review of the resulting proof before it is published in its final citable form. Please note that during the production process errors may be discovered which could affect the content, and all legal disclaimers that apply to the journal pertain.
References
- Altshuler ML. PCR troubleshooting: the essential guide. Caister Academic Press; United Kingdom: 2006. [Google Scholar]
- Barbosa AD, Gofton AW, Paparini A, Codello A, Greay T, Gillett A, Warren K, Irwin P, Ryan U. Increased genetic diversity and prevalence of co-infection with Trypanosoma spp. in koalas (Phascolarctos cinereus) and their ticks identified using next-generation sequencing (NGS) PLoS One. 2017;12:e0181279. doi: 10.1371/journal.pone.0181279. [DOI] [PMC free article] [PubMed] [Google Scholar]
- Beadell JS, Gering E, Austin J, Dumbacher JP, Peirce MA, Pratt TK, Atkinson CT, Fleischer RC. Prevalence and differential host-specificity of two avian blood parasite genera in the Australo-Papuan region. Mol Ecol. 2004;13:3829–3844. doi: 10.1111/j.1365-294X.2004.02363.x. [DOI] [PubMed] [Google Scholar]
- Bensch S, Hellgren O, Pérez-Tris J. MalAvi: a public database of malaria parasites and related haemosporidians in avian hosts based on mitochondrial cytochrome b lineages. Mol Ecol Resour. 2009;9:1353–1358. doi: 10.1111/j.1755-0998.2009.02692.x. [DOI] [PubMed] [Google Scholar]
- Bensch S, Pérez-Tris J, Waldenström J, Hellgren O. Linkage between nuclear and mitochondrial DNA sequences in avian malaria parasites: multiple cases of cryptic speciation? Evolution. 2004;58:1617–1621. doi: 10.1111/j.0014-3820.2004.tb01742.x. [DOI] [PubMed] [Google Scholar]
- Bensch S, Stjernman M, Hasselquist D, Ostman O, Hansson B, Westerdahl H, Pinheiro RT. Host specificity in avian blood parasites: a study of Plasmodium and Haemoproteus mitochondrial DNA amplified from birds. Proc Biol Sci. 2000;267:1583–1589. doi: 10.1098/rspb.2000.1181. [DOI] [PMC free article] [PubMed] [Google Scholar]
- Bergsten J, Bilton DT, Fujisawa T, Elliott M, Monaghan MT, Balke M, Hendrich L, Geijer J, Herrmann J, Foster GN, Ribera I, Nilsson AN, Barraclough TG, Vogler AP. The effect of geographical scale of sampling on DNA barcoding. Syst Biol. 2012;61:851–869. doi: 10.1093/sysbio/sys037. [DOI] [PMC free article] [PubMed] [Google Scholar]
- Bernotienė R, Palinauskas V, Iezhova T, Murauskaitė D, Valkiūnas G. Avian haemosporidian parasites (Haemosporida): A comparative analysis of different polymerase chain reaction assays in detection of mixed infections. Exp Parasitol. 2016;163:31–37. doi: 10.1016/j.exppara.2016.01.009. [DOI] [PubMed] [Google Scholar]
- Cheng Q, Cunningham J, Gatton ML. Systematic review of sub-microscopic P. vivax infections: prevalence and determining factors. PLoS Negl Trop Dis. 2015;9:e3413. doi: 10.1371/journal.pntd.0003413. [DOI] [PMC free article] [PubMed] [Google Scholar]
- Clark NJ, Wells K, Dimitrov D, Clegg SM. Co-infections and environmental conditions drive the distributions of blood parasites in wild birds. J Anim Ecol. 2016;85:1461–1470. doi: 10.1111/1365-2656.12578. [DOI] [PubMed] [Google Scholar]
- Demas A, Oberstaller J, DeBarry J, Lucchi NW, Srinivasamoorthy G, Sumari D, Kabanywanyi AM, Villegas L, Escalante AA, Kachur SP, Barnwell JW, Peterson DS, Udhayakumar V, Kissinger JC. Applied genomics: data mining reveals species-specific malaria diagnostic targets more sensitive than 18S rRNA. J Clin Microbiol. 2011;49:2411–2418. doi: 10.1128/JCM.02603-10. [DOI] [PMC free article] [PubMed] [Google Scholar]
- Dimitrov D, Palinauskas V, Iezhova TA, Bernotienė R, Ilgūnas M, Bukauskaitė D, Zehtindjiev P, Ilieva M, Shapoval AP, Bolshakov CV, Markovets MY, Bensch S, Valkiūnas G. Plasmodium spp.: an experimental study on vertebrate host susceptibility to avian malaria. Exp Parasitol. 2015;148:1–16. doi: 10.1016/j.exppara.2014.11.005. [DOI] [PubMed] [Google Scholar]
- Dimitrov D, Zehtindjiev P, Bensch S, Ilieva M, Iezhova T, Valkiūnas G. Two new species of Haemoproteus Kruse, 1890 (Haemosporida, Haemoproteidae) from European birds, with emphasis on DNA barcoding for detection of haemosporidians in wildlife. Syst Parasitol. 2014;87:135–151. doi: 10.1007/s11230-013-9464-1. [DOI] [PubMed] [Google Scholar]
- Escalante AA, Freeland DE, Collins WE, Lal AA. The evolution of primate malaria parasites based on the gene encoding cytochrome b from the linear mitochondrial genome. Proc Natl Acad Sci U S A. 1998;95:8124–8129. doi: 10.1073/pnas.95.14.8124. [DOI] [PMC free article] [PubMed] [Google Scholar]
- Falk BG, Mahler DL, Perkins SL. Tree-based delimitation of morphologically ambiguous taxa: a study of the lizard malaria parasites on the Caribbean island of Hispaniola. Int J Parasitol. 2011;41:967–980. doi: 10.1016/j.ijpara.2011.05.004. [DOI] [PubMed] [Google Scholar]
- Garnham PCC. Malaria parasites and other haemosporidia. Blackwell Scientific Publications; Oxford: 1966. [Google Scholar]
- González AD, Matta NE, Ellis VA, Miller ET, Ricklefs RE, Gutiérrez HR. Mixed species flock, nest height, and elevation partially explain avian haemoparasite prevalence in Colombia. PLoS One. 2014;9:e100695. doi: 10.1371/journal.pone.0100695. [DOI] [PMC free article] [PubMed] [Google Scholar]
- Gouy M, Guindon S, Gascuel O. SeaView version 4: a multiplatform graphical user interface for sequence alignment and phylogenetic tree building. Mol Biol Evol. 2010;27:221–224. doi: 10.1093/molbev/msp259. [DOI] [PubMed] [Google Scholar]
- Hall TA. BioEdit: a user-friendly biological sequence alignment editor and analysis program for Windows 95/98/NT. Nucleic Acids Symp Ser. 1999;41:95e98. [Google Scholar]
- Hellgren O, Waldenström J, Bensch S. A new PCR assay for simultaneous studies of Leucocytozoon, Plasmodium, and Haemoproteus from avian blood. J Parasitol. 2004;90:797–802. doi: 10.1645/GE-184R1. [DOI] [PubMed] [Google Scholar]
- Ishtiaq F, Rao M, Huang X, Bensch S. Estimating prevalence of avian haemosporidians in natural populations: a comparative study on screening protocols. Parasit Vectors. 2017;10:127. doi: 10.1186/s13071-017-2066-z. [DOI] [PMC free article] [PubMed] [Google Scholar]
- Jennings WB. Phylogenomic data acquisition: principles and practice. CRC Press, Taylor & Francis Group; Boca Raton, Florida: 2017. [Google Scholar]
- Kumar S, Stecher G, Tamura K. MEGA7: Molecular Evolutionary Genetics Analysis Version 7.0 for Bigger Datasets. Mol Biol Evol. 2016;33:1870–1874. doi: 10.1093/molbev/msw054. [DOI] [PMC free article] [PubMed] [Google Scholar]
- Loiseau C, Iezhova T, Valkiūnas G, Chasar A, Hutchinson A, Buermann W, Smith TB, Sehgal RN. Spatial variation of haemosporidian parasite infection in African rainforest bird species. J Parasitol. 2010;96:21–29. doi: 10.1645/GE-2123.1. [DOI] [PubMed] [Google Scholar]
- Lotta IA, Pacheco MA, Escalante AA, González AD, Mantilla JS, Moncada LI, Adler PH, Matta NE. Leucocytozoon diversity and possible vectors in the Neotropical highlands of Colombia. Protist. 2016;167:185–204. doi: 10.1016/j.protis.2016.02.002. [DOI] [PubMed] [Google Scholar]
- Mantilla JS, González AD, Lotta IA, Moens M, Pacheco MA, Escalante AA, Valkiūnas G, Moncada LI, Pérez-Tris J, Matta NE. Haemoproteus erythrogravidus n. sp. (Haemosporida, Haemoproteidae): Description and molecular characterization of a widespread blood parasite of birds in South America. Acta Trop. 2016;159:83–94. doi: 10.1016/j.actatropica.2016.02.025. [DOI] [PubMed] [Google Scholar]
- Martínez J, Martínez-DE LA Puente J, Herrero J, Del Cerro S, Lobato E, Rivero-DE Aguilar J, Vásquez RA, Merino S. A restriction site to differentiate Plasmodium and Haemoproteus infections in birds: on the inefficiency of general primers for detection of mixed infections. Parasitology. 2009;136:713–22. doi: 10.1017/S0031182009006118. [DOI] [PubMed] [Google Scholar]
- Martinsen ES, Perkins SL, Schall JJ. A three-genome phylogeny of malaria parasites (Plasmodium and closely related genera): evolution of life-history traits and host switches. Mol Phylogenet Evol. 2008;47:261–273. doi: 10.1016/j.ympev.2007.11.012. [DOI] [PubMed] [Google Scholar]
- Muehlenbein MP, Pacheco MA, Taylor JE, Prall SP, Ambu L, Nathan S, Alsisto S, Ramirez D, Escalante AA. Accelerated diversification of nonhuman primate malarias in Southeast Asia: adaptive radiation or geographic speciation? Mol Biol Evol. 2015;32:422–439. doi: 10.1093/molbev/msu310. [DOI] [PMC free article] [PubMed] [Google Scholar]
- Nilsson E, Taubert H, Hellgren O, Huang X, Palinauskas V, Markovets MY, Valkiūnas G, Bensch S. Multiple cryptic species of sympatric generalists within the avian blood parasite Haemoproteus majoris. J Evol Biol. 2016;29:1812–1826. doi: 10.1111/jeb.12911. [DOI] [PubMed] [Google Scholar]
- Outlaw DC, Ricklefs RE. Species limits in avian malaria parasites (Haemosporida): how to move forward in the molecular era. Parasitology. 2014;141:1223–1232. doi: 10.1017/S0031182014000560. [DOI] [PubMed] [Google Scholar]
- Pacheco MA, Cranfield M, Cameron K, Escalante AA. Malarial parasite diversity in chimpanzees: the value of comparative approaches to ascertain the evolution of Plasmodium falciparum antigens. Malar J. 2013;12:328. doi: 10.1186/1475-2875-12-328. [DOI] [PMC free article] [PubMed] [Google Scholar]
- Pacheco MA, Escalante AA, Garner MM, Bradley GA, Aguilar RF. Haemosporidian infection in captive masked bobwhite quail (Colinus virginianus ridgwayi), an endangered subspecies of the northern bobwhite quail. Vet Parasitol. 2011;182:113–120. doi: 10.1016/j.vetpar.2011.06.006. [DOI] [PMC free article] [PubMed] [Google Scholar]
- Pacheco MA, Matta NE, Valkiūnas G, Parker PG, Mello B, Stanley CE, Jr, Lentino M, Garcia-Amado MA, Cranfield M, Kosakovsky Pond SL, Escalante AA. Mode and rate of evolution of haemosporidian mitochondrial genomes: timing the radiation of avian parasites. Mol Biol Evol. 2018;35:383–403. doi: 10.1093/molbev/msx285. [DOI] [PMC free article] [PubMed] [Google Scholar]
- Pacheco MA, Reid MJ, Schillaci MA, Lowenberger CA, Galdikas BM, Jones-Engel L, Escalante AA. The origin of malarial parasites in orangutans. PLoS One. 2012;7:e34990. doi: 10.1371/journal.pone.0034990. [DOI] [PMC free article] [PubMed] [Google Scholar]
- Pérez-Tris J, Bensch S. Diagnosing genetically diverse avian malarial infections using mixed-sequence analysis and TA-cloning. Parasitology. 2005;131:15–23. doi: 10.1017/s003118200500733x. [DOI] [PubMed] [Google Scholar]
- Perkins SL. Molecular systematics of the three mitochondrial protein-coding genes of malaria parasites: corroborative and new evidence for the origins of human malaria. Mitochondrial DNA. 2008;19:471–478. doi: 10.1080/19401730802570926. [DOI] [PubMed] [Google Scholar]
- Perkins SL, Schall JJ. A molecular phylogeny of malarial parasites recovered from cytochrome b gene sequences. J Parasitol. 2002;88:972–978. doi: 10.1645/0022-3395(2002)088[0972:AMPOMP]2.0.CO;2. [DOI] [PubMed] [Google Scholar]
- Poulin R. Evolutionary Ecology of Parasites. Princeton University Press; Princeton: 2007. [Google Scholar]
- Psifidi A, Dovas CI, Bramis G, Lazou T, Russel CL, Arsenos G, Banos G. Comparison of eleven methods for genomic DNA extraction suitable for large-scale whole-genome genotyping and long-term DNA banking using blood samples. PLoS One. 2015;10:e0115960. doi: 10.1371/journal.pone.0115960. [DOI] [PMC free article] [PubMed] [Google Scholar]
- Richard FA, Sehgal RN, Jones HI, Smith TB. A comparative analysis of PCR-based detection methods for avian malaria. J Parasitol. 2002;88:819–822. doi: 10.1645/0022-3395(2002)088[0819:ACAOPB]2.0.CO;2. [DOI] [PubMed] [Google Scholar]
- Richardson DS, Jury FL, Blaakmeer K, Komdeur J, Burke T. Parentage assignment and extra-group paternity in a cooperative breeder: the Seychelles warbler (Acrocephalus sechellensis) Mol Ecol. 2001;10:2263–2273. doi: 10.1046/j.0962-1083.2001.01355.x. [DOI] [PubMed] [Google Scholar]
- Ricklefs RE, Fallon SM. Diversification and host switching in avian malaria parasites. Proc Biol Sci. 2002;269:885–892. doi: 10.1098/rspb.2001.1940. [DOI] [PMC free article] [PubMed] [Google Scholar]
- Ricklefs RE, Fallon SM, Bermingham E. Evolutionary relationships, cospeciation, and host switching in avian malaria parasites. Syst Biol. 2004;53:111–119. doi: 10.1080/10635150490264987. [DOI] [PubMed] [Google Scholar]
- Ronquist F, Huelsenbeck JP. MrBayes 3: Bayesian phylogenetic inference under mixed models. Bioinformatics. 2003;19:1572–1574. doi: 10.1093/bioinformatics/btg180. [DOI] [PubMed] [Google Scholar]
- Sambrook J, Fritsch EF, Maniatis T. Molecular cloning: a laboratory manual. Cold Spring Harbor Laboratory Press; New York: 1989. [Google Scholar]
- Sawabe K, Isawa H, Hoshino K, Sasaki T, Roychoudhury S, Higa Y, Kasai S, Tsuda Y, Nishiumi I, Hisai N, Hamao S, Kobayashi M. Host-feeding habits of Culex pipiens and Aedes albopictus (Diptera: Culicidae) collected at the urban and suburban residential areas of Japan. J Med Entomol. 2010;47:442–50. doi: 10.1603/ME09256. [DOI] [PubMed] [Google Scholar]
- Schaer J, Reeder DM, Vodzak ME, Olival KJ, Weber N, Mayer F, Matuschewski K, Perkins SL. Nycteria parasites of Afrotropical insectivorous bats. Int J Parasitol. 2015;45:375–384. doi: 10.1016/j.ijpara.2015.01.008. [DOI] [PubMed] [Google Scholar]
- Silva-Iturriza A, Ketmaier V, Tiedemann R. Prevalence of avian haemosporidian parasites and their host fidelity in the central Philippine islands. Parasitol Int. 2012;61:650–657. doi: 10.1016/j.parint.2012.07.003. [DOI] [PubMed] [Google Scholar]
- Telford SR., Jr . Hemoparasites of the Reptilia: Color Atlas and Text. CRC Press, Taylor & Francis Group; Boca Raton, Florida: 2009. [Google Scholar]
- Valkiūnas G. Avian malaria parasites and other haemosporidia. CRC Press; Boca Raton, Florida: 2005. [Google Scholar]
- Valkiunas G, Bensch S, Iezhova TA, Krizanauskiené A, Hellgren O, Bolshakov CV. Nested cytochrome b polymerase chain reaction diagnostics underestimate mixed infections of avian blood haemosporidian parasites: microscopy is still essential. J Parasitol. 2006;92:418–422. doi: 10.1645/GE-3547RN.1. [DOI] [PubMed] [Google Scholar]
- Valkiūnas G, Iezhova TA, Shapoval AP. High prevalence of blood parasites in hawfinch Coccothraustes coccothraustes. J Nat Hist. 2003;37:2647–2652. [Google Scholar]
- Valkiūnas G, Iezhova TA. Exo-erythrocytic development of avian malaria and related haemosporidian parasites. Malar J. 2017;16:101. doi: 10.1186/s12936-017-1746-7. [DOI] [PMC free article] [PubMed] [Google Scholar]
- Valkiūnas G, Ilgūnas M, Bukauskaitė D, Iezhova TA. Description of Haemoproteus ciconiae sp. nov. (Haemoproteidae, Haemosporida) from the white stork Ciconia ciconia, with remarks on insensitivity of established polymerase chain reaction assays to detect this infection. Parasitol Res. 2016;115:2609–2616. doi: 10.1007/s00436-016-5007-4. [DOI] [PubMed] [Google Scholar]
- Valkiūnas G, Ilgūnas M, Bukauskaitė D, Palinauskas V, Bernotienė R, Iezhova TA. Parasitology. Molecular characterization and distribution of Plasmodium matutinum, a common avian malaria parasite. Parasitology. 2017;144:1726–1735. doi: 10.1017/S0031182017000737. [DOI] [PubMed] [Google Scholar]
- Zehtindjiev P, Križanauskienė A, Bensch S, Palinauskas V, Asghar M, Dimitrov D, Scebba S, Valkiūnas G. A new morphologically distinct avian malaria parasite that fails detection by established polymerase chain reaction-based protocols for amplification of the cytochrome B gene. J Parasitol. 2012;98:657–65. doi: 10.1645/GE-3006.1. [DOI] [PubMed] [Google Scholar]
Associated Data
This section collects any data citations, data availability statements, or supplementary materials included in this article.
Supplementary Materials
Supplementary Fig. S1. Bayesian phylogenetic hypotheses of avian haemosporidian parasites based on concatenated partial cytochrome b (cytb) and cytochrome c oxidase subunit 3 (cox3) genes (70 sequences and 1826 bp). The values at the nodes are posterior probabilities. Branch colors indicate the haemosporidian genus. Branch colors indicate the haemosporidian genus: Plasmodium sp. (blue), Haemoproteus (Parahaemoproteus) sp. (dark red), Leucocytozoon (Akiba) caulleryi (light red), Haemoproteus (Haemoproteus) sp. (orange), and Leucocytozoon sp. (green). Species names are shown in bold.