Significance
Protein fluctuations and hydrogen-bond networks play an important—although incompletely understood—role in facilitating efficient biological electron transfer (ET). Experimental mutagenesis results provide evidence for the role of protein motions in Ru-modified azurin ET, a quintessential example of biological ET. A recently developed nonadiabatic molecular dynamics method allows for exploration of the nature of protein fluctuations, providing insight into the conformational motions that accompany ET in Ru-modified azurin. In particular, a fluctuating hydrogen-bond network is identified that transiently ruptures to allow for donor–acceptor compression during ET.
Keywords: electron transfer, azurin, ring polymer molecular dynamics, Marcus theory, protein dynamics
Abstract
We combine experimental and computational methods to address the anomalous kinetics of long-range electron transfer (ET) in mutants of Pseudomonas aeruginosa azurin. ET rates and driving forces for wild type (WT) and three N47X mutants (X = L, S, and D) of Ru(2,2′-bipyridine)2 (imidazole)(His83) azurin are reported. An enhanced ET rate for the N47L mutant suggests either an increase of the donor–acceptor (DA) electronic coupling or a decrease in the reorganization energy for the reaction. The underlying atomistic features are investigated using a recently developed nonadiabatic molecular dynamics method to simulate ET in each of the azurin mutants, revealing unexpected aspects of DA electronic coupling. In particular, WT azurin and all studied mutants exhibit more DA compression during ET (>2 Å) than previously recognized. Moreover, it is found that DA compression involves an extended network of hydrogen bonds, the fluctuations of which gate the ET reaction, such that DA compression is facilitated by transiently rupturing hydrogen bonds. It is found that the N47L mutant intrinsically disrupts this hydrogen-bond network, enabling particularly facile DA compression. This work, which reveals the surprisingly fluctional nature of ET in azurin, suggests that hydrogen-bond networks can modulate the efficiency of long-range biological ET.
Electron transfer (ET) is of central importance in biological processes ranging from photosynthesis to respiration (1–6). Understanding the mechanisms by which biochemical systems facilitate efficient ET is essential for the elucidation of biochemical pathways and development of biomimetic catalysts.
Extensive investigations of Ru-modified derivatives of the blue copper protein azurin have shed light on the factors that control long-range biological ET (7, 8). Notably, the copper site in azurin is tuned for efficient ET with a low reaction activation energy (8, 9). Extensive mutagenesis studies have also been performed for this ET process, the results of which have been explained in terms of either the effect of individual residues on the Cu reduction potential (10–15) or the ET reorganization energy (16, 17). This previous work was consistently explained using the Marcus theory of ET subject to the assumption that the donor–acceptor (DA) electronic coupling for the ET reaction is unaffected by the mutations. Mutagenesis studies that account for changes in the DA coupling are less common and either assume static protein configurations or include only protein fluctuations in the reactant basin (18–20).
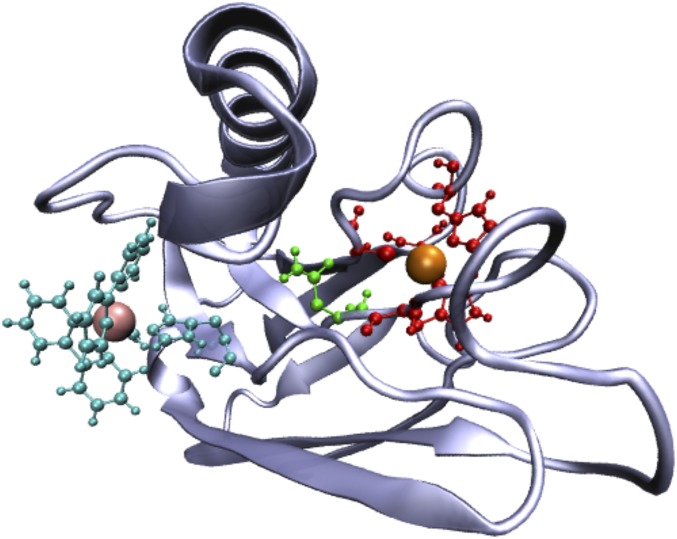
The current work explores mutations at the N47 site of Ru(2,2′-bipyridine)2 (imidazole)(His83) azurin (i.e., Ru-azurin). Both ET rates and Cu reduction potentials for wild type (WT) and three mutants (N47D, N47S, and N47L) are measured. The motivation for exploring residue 47 is that this asparagine participates in an extended hydrogen-bonding network that stabilizes the “rigid rack” for the Cu center in the protein (8–12, 21). A representative configuration of WT azurin in Fig. 1 shows the location of asparagine-47 between the two metal centers.
Fig. 1.
Representative configuration of WT azurin. ET occurs from the Cu center (large orange sphere) to the Ru center (large pink sphere). The Ru center is attached to the protein exterior at H83 (shown in cyan along with the Ru ligands); the Cu ligands are shown in red, and asparagine residue 47 is highlighted in green.
Unlike previous mutagenesis studies, the observed reactions cannot be explained using standard Marcus theory without accounting for the important role of protein fluctuations in the ET reaction mechanism. To understand these effects and to elucidate the protein motions that accompany ET in these azurin mutants, we use a recently developed nonadiabatic simulation technique, kinetically constrained ring polymer molecular dynamics (KC-RPMD). KC-RPMD is a Feynman path-integral method that enables the simulation of electronically nonadiabatic processes using classical trajectories; it accurately describes condensed-phase ET reaction dynamics and mechanisms across the normal, barrierless, and inverted regimes including the weak electronic-coupling regime associated with long-range ET (22, 23). The main benefit of the methodology is that it allows for the unbiased simulation of the ET dynamics, accounting for the full range of protein fluctuations that accompany the ET reaction.
Results and Discussion
Experimentally determined Cu reduction potentials and ET rates for WT azurin and the three mutants are shown in Table 1. Also reported is the driving force, , for each ET reaction, obtained from the measured Cu reduction potentials and the known Ru reduction potential, V vs. the normal hydrogen electrode (NHE) (8). The mutations at residue 47 significantly affect both the driving force and overall ET rate. Notably, while all three mutants show a decrease in the driving force for the reaction in comparison with WT, only N47D and N47S exhibit a decrease in the ET rate; the rate for N47L is enhanced relative to WT.
Table 1.
Experimentally determined copper reduction potentials (Cu II/I) vs. NHE, ET driving forces , and ET rates , for WT azurin and mutants
| Mutant | (CuII/I)/V | /eV | s−1⋅10−5 |
| WT | 0.30(2) | −0.70(2) | |
| N47D | 0.38(2) | −0.62(2) | |
| N47S | 0.42(2) | −0.58(2) | |
| N47L | 0.44(2) | −0.56(2) |
To disentangle the effect of the driving force on the ET reaction rate, the experimentally measured kinetics parameters are analyzed using the standard ET rate constant expression from Marcus theory (24–27),
| [1] |
where is the DA electronic coupling between the donor and acceptor, is the reorganization energy, and is the driving force. Isolating the contribution from the driving force, we assume that all other parameters are unaffected by mutation, including and , such that the relative rate for a given mutant vs. WT is
| [2] |
where eV (Table 1) and = 0.8 eV (28). Table 2 compares the ratio of ET rates measured from experiment, , to the ratio obtained using Eq. 2. For two of the mutations, N47D and N47S, the trend from this application of Marcus theory is consistent with the experimentally observed rates, with both mutations leading to lower rates. However, N47L shows clear enhancement of the observed ET rate compared with the prediction based solely on the change in driving force (Eq. 2). This suggests that an additional aspect of protein motion plays an important role in the ET rates.
Table 2.
ET reaction rates from experiment, ; Marcus theory under the assumptions of Eq. 2, ; and KC-RPMD, , as well as the reorganization energy and average electronic coupling from KC-RPMD
| Mutant | |||||
| WT | 1.0 | 1.00 | 1.00 | 0.78 | |
| N47D | 0.5(1) | 0.76(8) | 0.75(2) | 0.78 | |
| N47S | 0.23(5) | 0.63(7) | 0.88(4) | 0.77 | |
| N47L | 1.9(5) | 0.56(7) | 1.71(6) | 0.78 |
Units for λKC and ⟨HAB⟩ are eV and 10−5 eV, respectively. Statistical error for these is smaller than the last reported digit.
To investigate the atomistic features governing the rate enhancement, KC-RPMD is used to simulate the nonadiabatic ET in both WT azurin and the investigated mutants. The KC-RPMD simulations use a fully atomistic representation of the metalloprotein, with over 15,000 atoms including explicit solvent. A two-state molecular mechanics force field, which is parameterized to fit WT experimental data, is used to describe the protein in the ET reactant and product diabatic states; the force field additionally describes the electronic coupling, , which explicitly depends on the distance between the Ru and Cu metal centers. All simulation details are provided in Materials and Methods and SI Appendix, sections S1 and S2.
Although KC-RPMD has been demonstrated to accurately describe ET across a broad range of electronic-coupling, driving-force, and solvent-coupling regimes (22, 23), the calculations converge with fewer trajectories when applied with a physically reasonable dividing surface (29). Throughout this work we use the “kink-pair” dividing surface in KC-RPMD (22, 23), which rapidly converges for ET reactions in the weak-coupling regime. This dividing surface corresponds to the ensemble of configurations for which the reactant and product electronic diabats are degenerate and weighted according to both the Boltzmann distribution and the magnitude of the DA electronic coupling, such that in the weak-coupling regime
| [3] |
where is the probability of a nuclear configuration and and are the reactant and product potential energy surfaces, respectively. SI Appendix, Fig. S1 demonstrates that fewer than 8% of KC-RPMD trajectories undergo dynamical recrossing when initialized from the kink-pair dividing surface for WT azurin and for all mutants; this result confirms that the bottleneck for the ET reaction is well described by the kink-pair dividing surface, and it further indicates that the ET rate is accurately described by a Marcus-type transition-state rate theory of the form
| [4] |
where is the average electronic coupling at the kink-pair dividing surface and is the outer-sphere reorganization energy calculated using KC-RPMD. A more detailed description of the rate-law analysis is provided in SI Appendix, section S4.
Table 2 gives the ET rates obtained using KC-RPMD, as well as the breakdown of the contributions to the rate in terms of the calculated outer-sphere reorganization energy and average electronic coupling. As anticipated, the outer-sphere reorganization energies computed from the KC-RPMD simulations confirm that this quantity is unaffected by the considered mutations. In contrast, while the WT, N47S, and N47D have almost identical values of the average electronic coupling, the value for N47L is markedly larger, fully accounting for the observed rate enhancement of N47L. Finally, we note that the relative KC-RPMD rates are in good agreement with experiment, suggesting that analysis of the contributions to the KC-RPMD rate will yield insight into the anomalous trend in the experimental kinetics upon mutation.
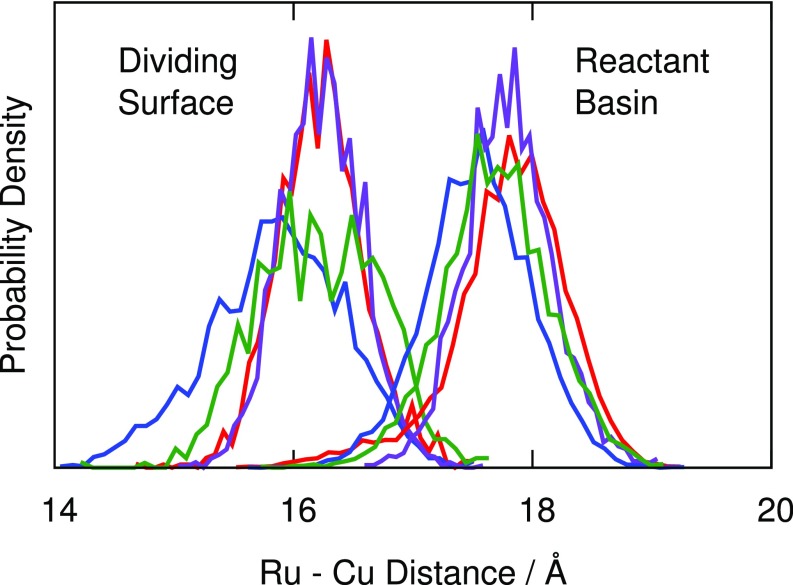
The effect of mutations on the electronic coupling can be seen from the distributions of DA distances calculated from KC-RPMD simulations in the reactant basin and at the dividing surface (Fig. 2). Surprisingly, WT and all three mutants show a large compression of the DA distance (> 2 Å) at the dividing surface compared with the reactant basin. In addition, N47L exhibits a stronger degree of compression in comparison with WT and the other mutants, displaying both a shifted peak and a fat tail at short DA distances for the dividing surface ensemble. The greater compression in N47L leads to an increased value of the average electronic coupling, , which in turn accounts for the anomalous N47L rate enhancement in Table 2.
Fig. 2.
Histogram of the Ru–Cu distance generated using KC-RPMD in the reactant basin and at the dividing surface for WT (red), N47D (purple), N47S (green), and N47L (blue). The dividing surface shows a clear compression of the Ru–Cu distance for WT and all mutants, with N47L showing the strongest degree of compression leading to an increased electronic coupling.
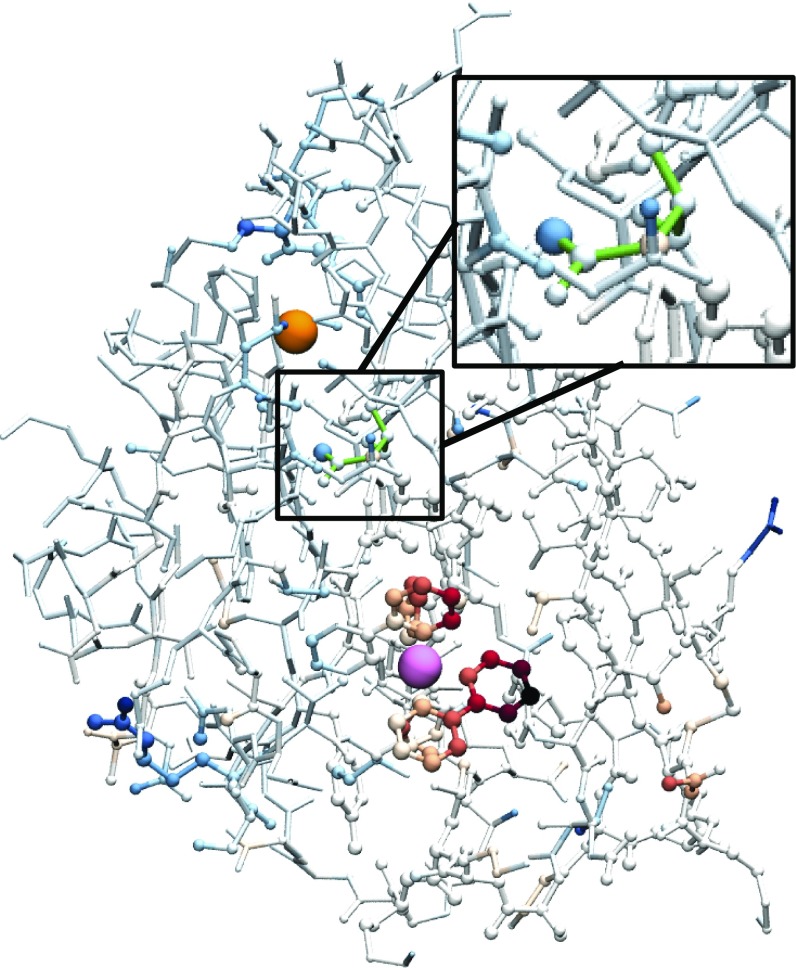
We now explore the detailed molecular rearrangements and interactions that lead to the DA compression trends in Fig. 2. For WT azurin, the color map in Fig. 3 shows the degree to which various residues are coupled to this compression during the ET reaction. Specifically, the crystal structure of the WT is depicted with the color and size of each atom scaled according to , where is the average distance of atom to the Cu center in the reactant ensemble and is the corresponding average from the dividing surface ensemble; blue indicates that the atom is farther from the Cu center in the dividing surface compared with the reactant basin, and red indicates that the atom is closer. Most of the protein is white, indicating that these regions do not compress toward the Cu center at the dividing surface. The main colored portion of the protein is the Ru moiety, which behaves as a rigid body bending toward the Cu center at the dividing surface. However, residue N47, highlighted in Inset, is observed to move away from the Cu center during the ET event, indicating that this residue is coupled in some way to the compression process.
Fig. 3.
The WT crystal structure with Cu (orange) and Ru (pink) indicated. The size and color of the remaining atoms are scaled according to the difference in distance from the atom to the Cu center in the reactant basin and dividing surface; blue/red indicates farther from/closer to Cu at the dividing surface than in the reactant basin. Inset expands the N47 region.
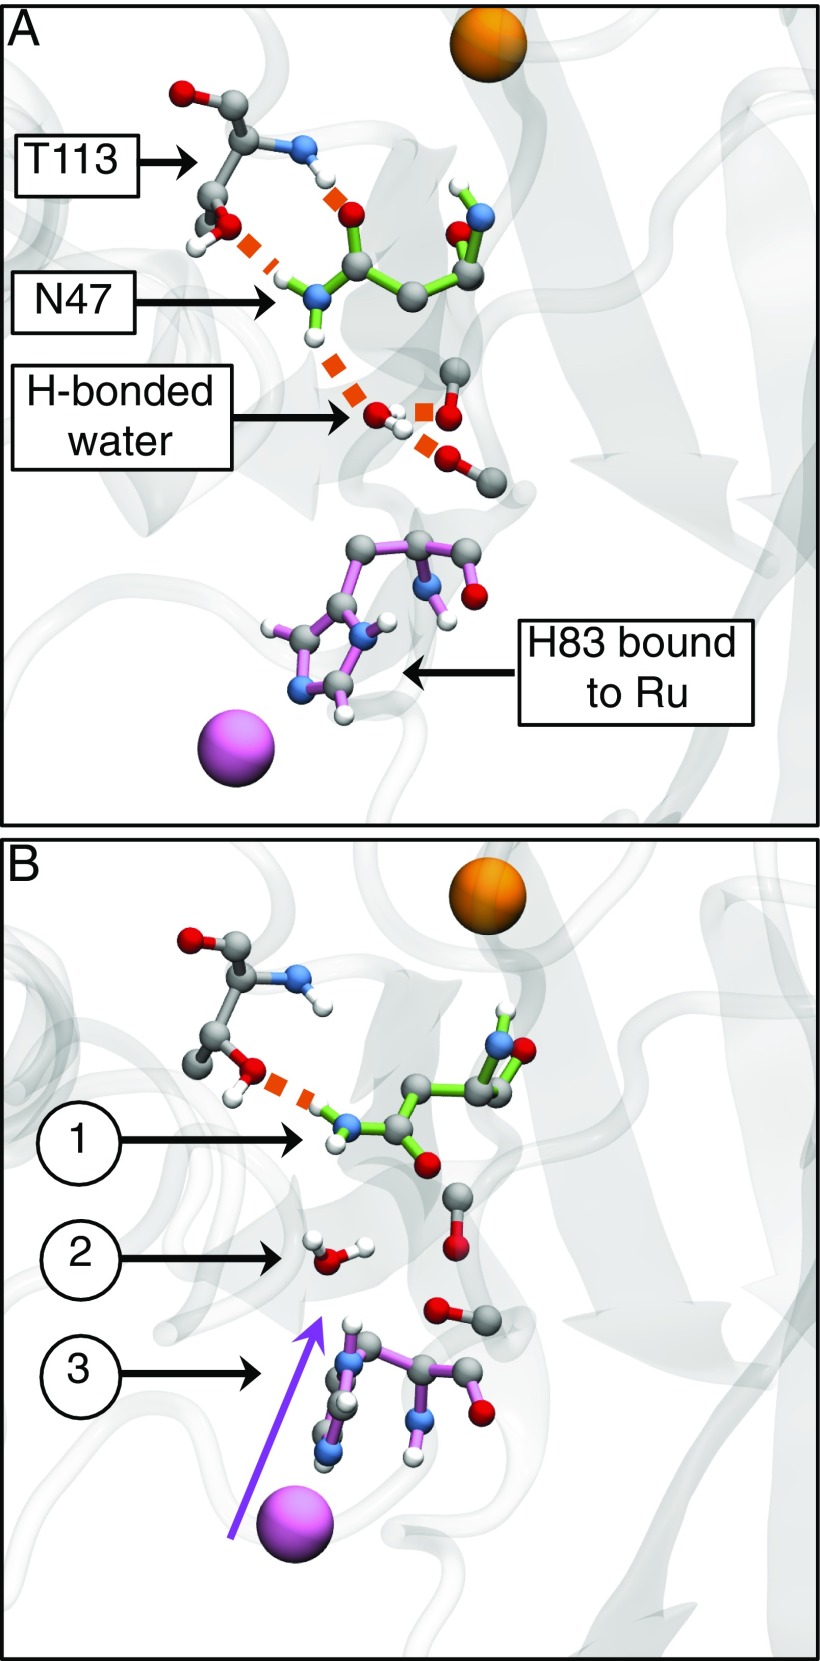
Fig. 4 compares representative configurations of the region around N47 obtained from the WT reactant basin and dividing surface ensembles. Fig. 4A shows that in the reactant basin, the N47 in WT forms a hydrogen bond to a nearby threonine (T113) and to a water molecule found in the pocket between the Ru moiety and N47; the water molecule additionally forms hydrogen bonds with backbone oxygens in the pocket. Fig. 4B illustrates that very different configurations are adopted in the dividing surface ensemble for WT. H83 compresses into the pocket, displacing the water and disrupting the hydrogen-bonding network around N47; four of the five reactant-basin hydrogen bonds are broken to allow for the motion of the Ru moiety into the pocket. As such, compression in WT during the ET process appears to be gated by a substantial fluctuation in which the local hydrogen-bonding network of the N47 residue is disrupted.
Fig. 4.
Representative WT configurations from KC-RPMD simulations illustrating the hydrogen-bonding network in the pocket surrounding residue 47. (A) The reactant basin exhibits a hydrogen-bond network between N47, the neighboring T113, a water molecule present in the pocket between N47 and H83, and nearby backbone oxygens. (B) The dividing surface is characterized by changes that include (1) breaking of the hydrogen bonds around N47, (2) displacement of the water molecule from the pocket, and (3) compression of H83 into the pocket. Hydrogen bonds are indicated by orange-dashed lines, the Cu center is in orange, residue 47 is highlighted in green, and the Ru center and H83 are highlighted in pink.
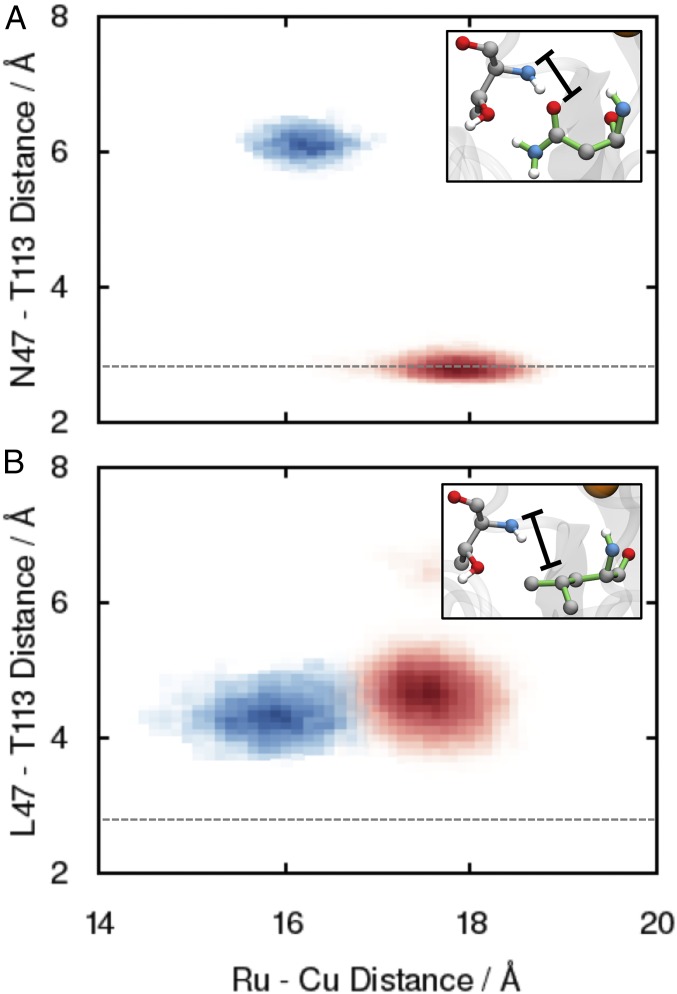
To quantify the observations from Fig. 4, and to compare the WT behavior during compression with that of the N47L mutant, Fig. 5 plots the 2D histogram of the Ru–Cu distance and the hydrogen-bonding distance between residue 47 and T113 in the reactant basin ensemble (red) and in the dividing surface ensemble (blue), for both WT (Fig. 5A) and N47L (Fig. 5B). The distance between residue 47 and T113 (indicated in Fig. 5 A and B, Insets) reports on fluctuations in the hydrogen-bonding network and is defined as the distance between the backbone nitrogen on T113 and the carbonyl oxygen on N47 for WT and as the distance between the backbone nitrogen on T113 and one of the methyl carbons on L47 for N47L.
Fig. 5.
Two-dimensional histogram of the Ru–Cu distance and the hydrogen-bonding distance between residue 47 and the nearby T113 for (A) WT and (B) N47L. Reactant basin and dividing surface configurations are indicated by red and blue, respectively. The dashed lines indicate the average hydrogen-bond distance for the WT in the reactant basin. Insets indicate characteristic configurations for the two cases, with the hydrogen-bond distance indicated.
Fig. 5A shows strong correlation between the Ru–Cu distance and the N47–T113 distance in WT, confirming that the hydrogen bond in the reactant basin is broken during the compression that gates ET. In contrast, Fig. 5B shows that the corresponding distance in the N47 L mutant is uncorrelated with DA compression, reflecting that point mutation to a leucine residue intrinsically disrupts the hydrogen-bonding network around residue 47. These results emphasize that the N47L mutant is “primed” for an enhanced ET reaction rate relative to WT, since facile compression of the DA distance can be performed without the restraints of the hydrogen-bond network in the vicinity of residue 47. We further note that these observations are completely consistent with the reported DA distance distributions in Fig. 2; the lack of hydrogen-bonding network in the N47 L mutant leads to more facile compression in the dividing surface ensemble, which in turn leads to stronger electronic couplings and faster ET rates.
As may be anticipated from the relative similarity of the DA distance distributions in Fig. 2 for the WT and the N47S and N47D mutations, SI Appendix, Fig. S15 A and B reveals that the hydrogen-bond fluctuations in the N47S and N47D mutations during ET are more similar to the WT results in Fig. 5A than to the N47L mutant results in Fig. 5B. Specifically, like the WT, N47S exhibits an intact hydrogen bond in the reactant basin that becomes disrupted during the DA compression that gates the ET reaction. Interestingly, the D47–T113 hydrogen bond in the N47D mutant appears to be sufficiently strong that it remains preserved, even in the compressed configurations at the dividing surface.
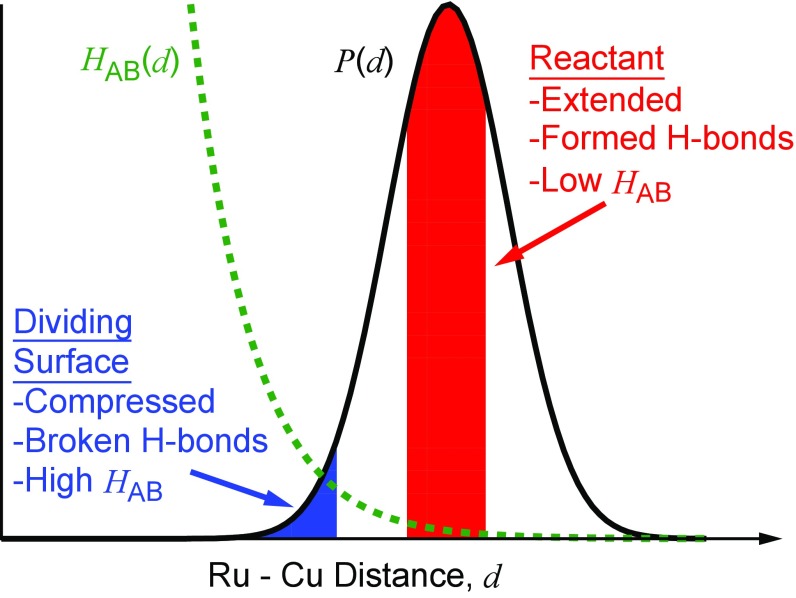
Taken together, Figs. 4 and 5 reveal the strikingly fluctional nature of the hydrogen-bonding network that gates the ET reaction in WT azurin, and it provides a molecular basis for understanding the qualitatively different DA distance distributions in the N47L mutant that lead to anomalously fast ET kinetics. The key features of the ET conformational gating in WT azurin are illustrated in Fig. 6, which depicts the distribution of Ru–Cu distances [, black curve] and electronic coupling [, green curve]. The red portion of the distribution indicates the thermally accessible configurations in the reactant basin, which exhibit an extended Ru–Cu distance, a small electronic coupling, and a well-formed hydrogen-bonding network involving residue N47. Given the strong distance dependence of the electronic coupling on DA distance, the ET process is most favorable from configurations in which the system fluctuates to compressed DA distances, indicated by the blue region, which involves disrupting the hydrogen-bond network in the WT azurin. Because the N47L mutant intrinsically disrupts this hydrogen-bond network, DA compression is more facile, leading to the accessibility of configurations with substantially shorter DA distances (Fig. 2) and thus faster ET reaction rates. We note that although this mechanistic explanation was made possible with all-atom nonadiabatic simulations, the basic interpretation of the experimentally observed trends does not hinge on the details of the force field or the form of the electronic coupling, beyond the robust assumption that the electronic coupling is strongly dependent upon the DA distance.
Fig. 6.
Schematic illustration of the atomistic features governing ET in WT azurin. The black curve corresponds to the probability distribution, , of Ru–Cu distances, , while the green-dashed curve corresponds to the distance-dependent electronic coupling, . Reactant basin and dividing surface configurations are indicated in red and blue, respectively.
Finally, we show that the experimentally observed trends for the ET rates are poorly explained without explicit inclusion of the DA compression that gates the ET reaction, even when a more sophisticated description of the electronic coupling is used. Previous theoretical work illustrated the dynamical nature of azurin, but modeled ET on the assumption that the reaction proceeds from the ensemble of configurations in the reactant basin (i.e., without inclusion of the DA compression discussed here) (30–33). Table 3 presents the relative ET rates, , obtained using Eq. 4 but with the average value of the electronic coupling calculated in the reactant basin instead of at the dividing surface. The results calculated in this way fail to capture the anomalous enhancement of the N47L rate. When the electronic coupling is calculated using the Pathways model (34–36), which is more sophisticated than the simple exponential form of the coupling (Eq. 6) that is otherwise used in this study, the estimate of the N47L rate is in even greater disagreement with experiment. These results highlight that capturing the experimentally observed trends in azurin demands explicit inclusion of DA compression during the ET reaction, as in the KC-RPMD simulations reported here.
Table 3.
Comparison of the relative experimental rates, , to the those calculated while neglecting DA compression
| Mutant | |||
| WT | 1.0 | 1.00 | 1.00 |
| N47D | 0.5(1) | 0.64(1) | 0.73(4) |
| N47S | 0.23(5) | 0.83(2) | 0.75(5) |
| N47L | 1.9(5) | 0.93(2) | 0.57(3) |
uses Eq. 6 for the electronic coupling, and uses the Pathways model.
Concluding Remarks
We present a combined experimental and computational study to elucidate the kinetics and conformational fluctuations associated with ET in Ru-modified Pseudomonas aeruginosa azurin. Experimental measurements of the ET rate and driving force of the WT Ru-azurin and three mutants (N47S, N47D, and N47L) show significant enhancement of the ET rate for N47L, which is inconsistent with behavior that is expected solely on the basis of the changes in the ET driving force among the mutants.
To understand this anomalous rate enhancement, the recently developed KC-RPMD method is used to directly simulate the nonadiabatic dynamics of the ET reaction in azurin and its mutants. Calculation of the ET rate constants for azurin and its mutants (Table 2) reveals good agreement with experiment, allowing for the analysis of the KC-RPMD trajectories to understand the anomalous kinetics of N47L. Analysis of the KC-RPMD trajectories reveals that, surprisingly, WT and all mutants exhibit a strong compression of the DA distance between the Cu (electron donor) and Ru (electron acceptor) species that gates the ET reaction (Fig. 2). The N47L mutant shows a particularly large degree of compression in comparison with WT and the other mutants that leads to stronger DA electronic coupling and the observed rate enhancement for N47L.
Analysis of the molecular fluctuations that accompany the ET reaction in the WT reveals an extended hydrogen-bond network that is disrupted during compression of the DA distance (Figs. 4 and 5). The nonpolar character of the leucine mutation in N47L intrinsically disrupts this hydrogen-bond network even in the reactant basin, giving rise to a more facile DA compression which leads to the higher electronic coupling and anomalously fast N47L ET rate.
This work reveals unexpected features of ET in protein systems, even for the extensively studied case of WT azurin, and it illustrates the importance of methods that naturally describe the fluctuations that accompany ET reactions. We emphasize that the results presented here do not indicate a breakdown in the Marcus theory for electron transfer—they simply demonstrate the importance of explicitly including the DA compression motions that gate the ET reaction, which may be accompanied by nontrivial fluctuations in extended hydrogen-bond networks. These effects are rigorously and conveniently captured via KC-RPMD, without the need for computationally costly multidimensional free-energy profile calculations. We expect KC-RPMD to prove useful in future studies of nonadiabatic chemical reactions in other protein systems, particularly those for which conformational fluctuations are thought to play an even more important role than in azurin, such as cytochromes (7, 18, 37).
Materials and Methods
Experimental Details.
Mutant azurin proteins were expressed, purified, and modified with [Ru(2,2′-bipyridine)2]2+, using literature protocols (38, 39). The CuII/I reduction potentials were determined using differential pulse voltammetry experiments with a standard three-electrode electrochemical cell. Reported potentials are referenced to the NHE. Transient absorption (TA) experiments were conducted in the Beckman Institute Laser Resource Center at California Institute of Technology. Reactions were initiated using 500 nm pump light and monitored using a white-light probe or 632.8 nm light from a HeNe continuous-wave laser. Established flash–quench conditions were used in all TA experiments (40). Full details of the experimental procedures can be found in SI Appendix, section S5.
Calculation Details.
All KC-RPMD simulations were performed at 300 K using a modified version of the Gromacs-5.0 molecular dynamics package (41). The potential energy surfaces used to define the ET reactant and product states are based on the GROMOS 53a6 force field (42) with additional terms to describe the interactions of the metal centers and the ET driving force. These additions are parameterized on the basis of WT experimental data; no additional potential energy fitting was performed for the mutants. Full details are provided in SI Appendix, sections S1 and S2.
The KC-RPMD equations of motion used to simulate the nonadiabatic ET dynamics are (22, 23)
| [5] |
which correspond to the classical limit for the nuclei. The position, velocity, and mass of nuclear coordinate are indicated by , , and , respectively, and the vector of nuclear positions is . The auxiliary electronic variable in KC-RPMD reports on nonadiabatic transitions between electronic states and is described by position , velocity , and mass . It is coupled to a Langevin bath with friction coefficient ; is a normal Gaussian random variable. Additional KC-RPMD details are provided in SI Appendix, section S3.
The electronic coupling, , is modeled using an exponential form that depends on the distance between the Ru and Cu metal centers, ,
| [6] |
using the experimentally determined values of cm−1, d0=3 Å, and Å−1 for all mutants (8, 28).
Ensemble averages reported for the reactant basin and dividing surface are obtained from KC-RPMD sampling trajectories that are run for at least 20 ns and 4 ns with a time step of 1 fs and 0.5 fs, respectively. The reactant basin corresponds to configurations for which the auxiliary electronic variable is constrained to , while the kink-pair dividing surfaces configurations are constrained to (22, 23).
Supplementary Material
Acknowledgments
This work was supported by the NIH under Award R01DK019038 (to H.B.G. and J.R.W.) and by the NSF under Award CHE-1611581 (to T.F.M.). Additional support was provided by NIH Grant GM095037 (to J.J.W.), the Arnold and Mabel Beckman Foundation, and NSF Grant DGE-1144469 (to J.S.K.).
Footnotes
The authors declare no conflict of interest.
This article is a PNAS Direct Submission.
This article contains supporting information online at www.pnas.org/lookup/suppl/doi:10.1073/pnas.1805719115/-/DCSupplemental.
References
- 1.Rappaport F, Diner BA. Primary photochemistry and energetics leading to the oxidation of the (Mn)4Ca cluster and to the evolution of molecular oxygen in photosystem II. Coord Chem Rev. 2008;252:259–272. [Google Scholar]
- 2.McEvoy JP, Brudvig GW. Water-splitting chemistry of photosystem II. Chem Rev. 2006;106:4455–4483. doi: 10.1021/cr0204294. [DOI] [PubMed] [Google Scholar]
- 3.Siegbahn PEM. Water oxidation in photosystem II: Oxygen release, proton release and the effect of chloride. Dalton Trans. 2009:10063–10068. doi: 10.1039/b909470a. [DOI] [PubMed] [Google Scholar]
- 4.Kaila VRI, Verkhovsky MI, Wikstrom M. Proton-coupled electron transfer in cytochrome oxidase. Chem Rev. 2010;110:7062–7081. doi: 10.1021/cr1002003. [DOI] [PubMed] [Google Scholar]
- 5.Brzezinski P, Adelroth P. Design principles of proton-pumping haem-copper oxidases. Curr Opin Struct Biol. 2006;16:465–472. doi: 10.1016/j.sbi.2006.06.012. [DOI] [PubMed] [Google Scholar]
- 6.Hosler JP, Ferguson-Miller S, Mills DA. Energy transduction: Proton transfer through the respiratory complexes. Annu Rev Biochem. 2006;75:165–187. doi: 10.1146/annurev.biochem.75.062003.101730. [DOI] [PMC free article] [PubMed] [Google Scholar]
- 7.Winkler JR, Gray HB. Electron flow through metalloproteins. Chem Rev. 2013;114:3369–3380. doi: 10.1021/cr4004715. [DOI] [PMC free article] [PubMed] [Google Scholar]
- 8.Gray HB, Winkler JR. Long-range electron transfer. Proc Natl Acad Sci USA. 2005;102:3534. doi: 10.1073/pnas.0408029102. [DOI] [PMC free article] [PubMed] [Google Scholar]
- 9.Warren JJ, Lancaster KM, Richards JH, Gray HB. Inner- and outer-sphere metal coordination in blue copper proteins. J Inorg Biochem. 2012;115:119–126. doi: 10.1016/j.jinorgbio.2012.05.002. [DOI] [PMC free article] [PubMed] [Google Scholar]
- 10.Marshall NM, et al. Rationally tuning the reduction potential of a single cupredoxin beyond the natural range. Nature. 2009;462:113–116. doi: 10.1038/nature08551. [DOI] [PMC free article] [PubMed] [Google Scholar]
- 11.Hadt RG, et al. Spectroscopic and DFT studies of second-sphere variants of the type 1 copper site in azurin: Covalent and nonlocal electrostatic contributions to reduction potentials. J Am Chem Soc. 2012;134:16701–16716. doi: 10.1021/ja306438n. [DOI] [PMC free article] [PubMed] [Google Scholar]
- 12.Zanetti-Polzi L, et al. A few key residues determine the high redox potential shift in azurin mutants. Org Biomol Chem. 2015;13:11003–11013. doi: 10.1039/c5ob01819f. [DOI] [PubMed] [Google Scholar]
- 13.Hoitink CWG, Canters G. The importance of asn47 for structure and reactivity of azurin from Alcaligenes denitrificans as studied by site-directed mutagenesis and spectroscopy. J Biol Chem. 1992;267:13836. [PubMed] [Google Scholar]
- 14.Wei C, Lazim R, Zhang D. Importance of polarization effect in the study of metalloproteins: Application of polarized protein specific charge scheme in predicting the reduction potential of azurin. Proteins. 2014;82:2209–2219. doi: 10.1002/prot.24584. [DOI] [PubMed] [Google Scholar]
- 15.Zanetti-Polzi L, Corni S, Daidonea I, Amadei A. Extending the essential dynamics analysis to investigate molecular properties: Application to the redox potential of proteins. Phys Chem Chem Phys. 2016;18:18450–18459. doi: 10.1039/c6cp03394f. [DOI] [PubMed] [Google Scholar]
- 16.Paltrinieri L, et al. The active site loop modulates the reorganization energy of blue copper proteins by controlling the dynamic interplay with solvent. J Phys Chem Lett. 2013;4:710–715. doi: 10.1021/jz302125k. [DOI] [PubMed] [Google Scholar]
- 17.Farver O, Marshall NM, Wherland S, Lu Y, Pecht I. Designed azurins show lower reorganization free energies for intraprotein electron transfer. Proc Natl Acad Sci USA. 2013;110:10536–10540. doi: 10.1073/pnas.1215081110. [DOI] [PMC free article] [PubMed] [Google Scholar]
- 18.Beratan DN, et al. Charge transfer in dynamical biosystems, or the treachery of (static) images. Acc Chem Res. 2015;48:474–481. doi: 10.1021/ar500271d. [DOI] [PMC free article] [PubMed] [Google Scholar]
- 19.Skourtis SS, Balabin IA, Kawatsu T, Beratan DN. Protein dynamics and electron transfer: Electronic decoherence and non-Condon effects. Proc Natl Acad Sci USA. 2005;102:3552–3557. doi: 10.1073/pnas.0409047102. [DOI] [PMC free article] [PubMed] [Google Scholar]
- 20.Regan JJ, Bilio AJD, Winkler JR, Richards JH, Gray HB. Electron tunneling in Ru-modified His46Asp azurin. Coupling through the Cu ligands. Inorg Chim Acta. 1998;275–276:470–480. [Google Scholar]
- 21.Arcangelia C, Bizzarri AR, Cannistraro S. Long-term molecular dynamics simulation of copper azurin: Structure, dynamics and functionality. Biophys Chem. 1999;78:247–257. doi: 10.1016/s0301-4622(99)00029-0. [DOI] [PubMed] [Google Scholar]
- 22.Menzeleev AR, Bell F, Miller TF., III Kinetically constrained ring-polymer molecular dynamics for non-adiabatic chemical reactions. J Chem Phys. 2014;140:064103. doi: 10.1063/1.4863919. [DOI] [PubMed] [Google Scholar]
- 23.Kretchmer JS, Miller TF., III Kinetically-constrained ring-polymer molecular dynamics for non-adiabatic chemistries involving solvent and donor-acceptor dynamical effects. Faraday Discuss. 2016;195:191–214. doi: 10.1039/c6fd00143b. [DOI] [PubMed] [Google Scholar]
- 24.Marcus RA, Sutin N. Electron transfers in chemistry and biology. Biochim Biophys Acta. 1985;811:265–322. [Google Scholar]
- 25.Marcus RA. Theory of electron-transfer reaction rates of solvated electrons. J Chem Phys. 1965;43:3477–3489. [Google Scholar]
- 26.Marcus RA. Theory of oxidation-reduction reactions involving electron transfer. 4. A statistical-mechanical basis for treating contributions from solvent, ligands and inert salt. Disc Faraday Soc. 1960;29:21. [Google Scholar]
- 27.Marcus RA. On the theory of oxidation-reduction reactions involving electron transfer I. J Chem Phys. 1956;24:966–978. [Google Scholar]
- 28.Warren JJ, Herrera N, Hill MG, Winkler JR, Gray HB. Electron flow through nitrotyrosinate in Pseudomonas aeruginosa azurin. J Am Chem Soc. 2013;135:11151–11158. doi: 10.1021/ja403734n. [DOI] [PMC free article] [PubMed] [Google Scholar]
- 29.Habershon S, Manolopoulos DE, Markland TE, Miller TF., III Ring-polymer molecular dynamics: Quantum effects in chemical dynamics from classical trajectories in an extended phase space. Annu Rev Phys Chem. 2013;64:387–413. doi: 10.1146/annurev-physchem-040412-110122. [DOI] [PubMed] [Google Scholar]
- 30.Prytkova TR, Kurnikov IV, Beratan DN. Ab initio based calculations of electron-transfer rates in metalloproteins. J Phys Chem B. 2005;109:1618–1625. doi: 10.1021/jp0457491. [DOI] [PubMed] [Google Scholar]
- 31.Kawatsu T, Kakitani T, Yamato T. Destructive interference in the electron tunneling through protein media. J Phys Chem B. 2002;106:11356–11366. [Google Scholar]
- 32.Daizadeh I, Medvedev ES, Stuchebrukhov AA. Effect of protein dynamics on biological electron transfer. Proc Natl Acad Sci USA. 1997;94:3703–3708. doi: 10.1073/pnas.94.8.3703. [DOI] [PMC free article] [PubMed] [Google Scholar]
- 33.Migliore A, Corni S, Di Felice R, Molinari E. First-principles density-functional theory calculations of electron-transfer rates in azurin dimers. J Chem Phys. 2006;124:064501. doi: 10.1063/1.2166233. [DOI] [PubMed] [Google Scholar]
- 34.Balabin IA, Hu X, Beratan DN. Exploring biological electron transfer pathway dynamics with the Pathways plugin for VMD. J Comp Chem. 2012;33:906–910. doi: 10.1002/jcc.22927. [DOI] [PMC free article] [PubMed] [Google Scholar]
- 35.Beratan DN, Betts JN, Onuchic JN. Protein electron transfer rates set by the bridging secondary and tertiary structures. Science. 1991;252:1285–1288. doi: 10.1126/science.1656523. [DOI] [PubMed] [Google Scholar]
- 36.Migliore A, Sit PHL, Klein ML. Evaluation of electronic coupling in transition-metal systems using DFT: Application to the hexa-aquo ferric-ferrous redox couple. J Chem Theor Comput. 2009;5:307–323. doi: 10.1021/ct800340v. [DOI] [PubMed] [Google Scholar]
- 37.Onuchic JN, Beratan DN, Winkler JR, Gray HB. Pathway analysis of protein electron-transfer reactions. Annu Rev Biophys Biomol Struct. 1992;21:349–377. doi: 10.1146/annurev.bb.21.060192.002025. [DOI] [PubMed] [Google Scholar]
- 38.Chang T, et al. Gene synthesis, expression, and mutagenesis of the blue copper proteins azurin and plastocyanin. Proc Natl Acad Sci USA. 1991;88:1325–1329. doi: 10.1073/pnas.88.4.1325. [DOI] [PMC free article] [PubMed] [Google Scholar]
- 39.Faham S, et al. Structures of ruthenium-modified Pseudomonas aeruginosa azurin and [Ru(2,2’-bipyridine)(2)(imidazole)(2)]SO4 10H(2)O. Acta Crystallogr D Biol Crystallogr. 1999;55:379–385. doi: 10.1107/s0907444998010464. [DOI] [PubMed] [Google Scholar]
- 40.Regan JJ, et al. Electron tunneling in azurin - the coupling across a beta-sheet. Chem Biol. 1995;2:489–496. doi: 10.1016/1074-5521(95)90266-x. [DOI] [PubMed] [Google Scholar]
- 41.Abraham MJ, et al. Gromacs: High performance molecular simulations through multi-level parallelism from laptops to supercomputers. Softw X. 2015;1–2:19–25. [Google Scholar]
- 42.Oostenbrink C, Villa A, Mark A, van Gunsteren W. A biomolecular force field based on the free enthalpy of hydration and solvation: The GROMOS force-field parameter sets 53A5 and 53A6. J Comput Chem. 2004;13:1656–1676. doi: 10.1002/jcc.20090. [DOI] [PubMed] [Google Scholar]
Associated Data
This section collects any data citations, data availability statements, or supplementary materials included in this article.


