Abstract
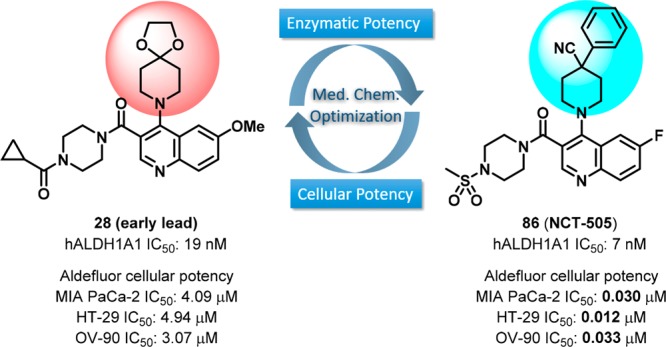
Aldehyde dehydrogenases (ALDHs) are responsible for the metabolism of aldehydes (exogenous and endogenous) and possess vital physiological and toxicological functions in areas such as CNS, inflammation, metabolic disorders, and cancers. Overexpression of certain ALDHs (e.g., ALDH1A1) is an important biomarker in cancers and cancer stem cells (CSCs) indicating the potential need for the identification and development of small molecule ALDH inhibitors. Herein, a newly designed series of quinoline-based analogs of ALDH1A1 inhibitors is described. Extensive medicinal chemistry optimization and biological characterization led to the identification of analogs with significantly improved enzymatic and cellular ALDH inhibition. Selected analogs, e.g., 86 (NCT-505) and 91 (NCT-506), demonstrated target engagement in a cellular thermal shift assay (CETSA), inhibited the formation of 3D spheroid cultures of OV-90 cancer cells, and potentiated the cytotoxicity of paclitaxel in SKOV-3-TR, a paclitaxel resistant ovarian cancer cell line. Lead compounds also exhibit high specificity over other ALDH isozymes and unrelated dehydrogenases. The in vitro ADME profiles and pharmacokinetic evaluation of selected analogs are also highlighted.
Introduction
The human aldehyde dehydrogenase (ALDH) gene family encodes 19 isozymes that metabolize reactive aldehydes to their corresponding carboxylic acid derivatives.1 Unbalanced biological activity of ALDHs has been associated with a variety of diseases, including cancers.2−5 Overexpression of certain ALDHs, especially ALDH1A1, in a number of malignancies and cancer stem cells (CSCs) correlates with poor prognosis and tumor aggressiveness, and is linked to drug resistance in traditional cancer chemotherapy.6,7 Evidence gained from utilizing nonspecific ALDH inhibitors and siRNA silencing techniques8 suggests that ALDH1A1 not only is a biomarker of cancer stem cells and a predictor of the prognosis, but also plays an important role in the biology of tumors and cancer stem cells.9,10
It has also been found that ALDH1A1 deficient mice display significantly decreased fasting glucose concentrations as well as attenuated hepatic glucose production and hepatic triacylglycerol synthesis.11,12 Furthermore, increased production of retinoic acid by intestinal CD14+ macrophages associated with local induction of ALDH1A1 expression was shown to contribute to their inflammatory phenotype in Crohn’s disease patients.13 These findings suggest that inhibition of ALDH1A1 enzymatic activity may offer new therapeutic options not only for cancer but also for obesity,14 diabetes, and inflammation. As such, discovery of novel small molecule ALDH (e.g., ALDH1A1) inhibitors with suitable drug-like properties and selectivity profiles is a prudent approach for potential new cancer therapeutics and other diseases. Moreover, such inhibitors are expected to aid researchers in obtaining a better understanding of the function of this enzyme in physiologic and pathophysiologic conditions.15,16
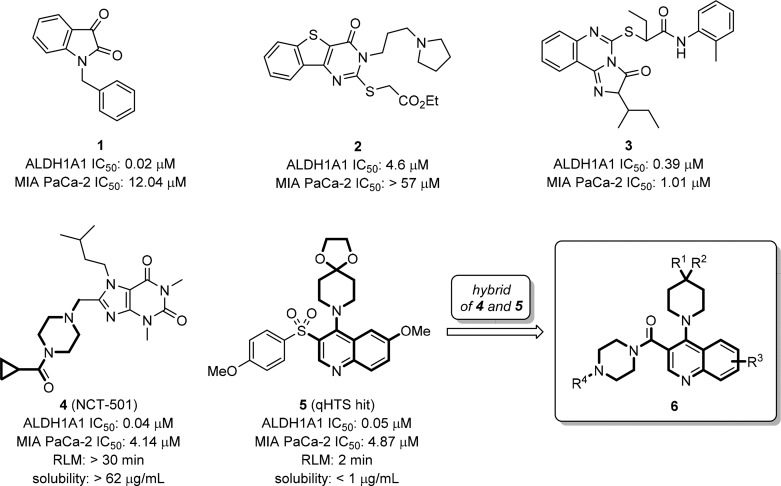
Among the list of known ALDH1A1 inhibitors,17 indolinedione-based analogs (e.g., 1, Figure 1)18 and tricyclic pyrimidinone 2(19,20) reported by Hurley and co-workers exhibit significant hALDH1A1 inhibitory activity (0.02 μM and 4.6 μM for 1 and 2, respectively). These were reported to be substrate competitive and selective ALDH1A1 inhibitors against other ALDH isozymes, such as ALDH2 and ALDH3A1. The inhibition of ALDH1A1 activity by compound 2 resulted in dose-dependent disruption of ovarian cancer (OC) spheroid formation and moderately sensitized IGROV1 cells to cisplatin.21 Another novel tricyclic, ALDH1A1-selective, inhibitor 3 was found to sensitize the cytotoxic effect of paclitaxel or doxorubicin in human multidrug resistant ovarian NCI/ADR-RES and TOV-21G-RT cancer cells.22 Most recently, we reported a potent and selective ALDH1A1 inhibitor NCT-501 (4) derived through an extensive hit-to-lead optimization of a theophylline-based compound.23 Compound 4 has demonstrated in vivo efficacy in cisplatin-resistant Cal-27 CisR HNSCC (head and neck squamous cell carcinoma) cell line derived xenografts and induced cisplatin sensitivity in ex vivo explant studies.24 To facilitate the identification of novel ALDH1A1 inhibitors with potent cellular activity during the optimization process, we recently implemented a high-content cell-based Aldefluor assay.25 These efforts revealed that in a high ALDH1A1 expressing pancreatic cancer cell line (MIA PaCa-2), most compounds, including 4, exhibited only moderate to low cellular activities (IC50 > 4 μM), with compound 3 exhibiting a potency of ∼1 μM. Therefore, identifying more robust, bioavailable, and efficacious ALDH1A1 inhibitors with potent cellular activities is essential to support the potential utility of ALDH1A1 inhibitors in cancer and other indications.
Figure 1.
Representative small molecule ALDH1A1 inhibitors, quinoline-based qHTS hit, and newly designed hybrid quinoline-based inhibitors.
In view of the structure similarity of 4 and previously identified quinoline-based qHTS hit 5 (PubChem assay identifier 1030, http://pubchem.ncbi.nlm.nih.gov/assay/assay.cgi?aid=1030; compound identifier, CID 12006038), both containing a bicyclic core with two adjacent arms, we envisioned the possibility of forming a new hybrid series exemplified as compound 6. Herein, we report the systematic medicinal chemistry optimization of this newly designed chemical series that led to the identification of ALDH1A1 selective inhibitors with potent cellular activity and desirable pharmacokinetic properties. Characterization of their cellular target engagement and efficacy in cancer cell in vitro models are also described.
Chemistry
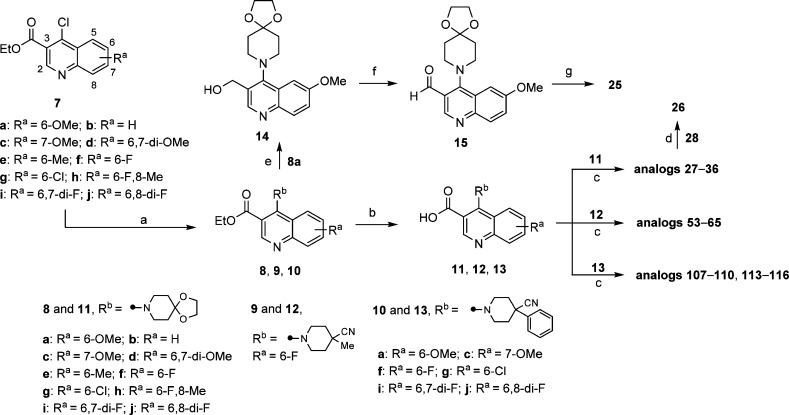
Access to the desired analogs was straightforward as illustrated in Schemes 1–3. Starting with suitably substituted quinoline esters 7, displacement of 4-Cl functionality with substituted piperidines gave ester intermediates 8–10 in excellent yields (Scheme 1). Subsequent hydrolysis of the ester group afforded the corresponding carboxylic acids 11–13, which were subjected to amide formation conditions with cyclic amines using HATU as coupling reagent. This synthetic route is particularly suited for the efficient structure–activity relationships (SARs) investigations of the amide substitution at 3-position of quinoline ring, such as analogs 27–36, 53–65, 107–110, and 113–116. Reduction of the ester group on intermediate 8a with lithium borohydride followed by oxidation using Dess–Martin periodinane gave aldehyde 15. Subsequent reductive amination with cyclopropyl(piperazin-1-yl)methanone using sodium triacetoxyborohydride as the reducing agent afforded analog 25. Deprotection of 28 in the presence of catalytic amount of p-toluenesulfonic acid gave the corresponding ketone 26.
Scheme 1. Synthesis and Modification of 3-Substitution of Quinoline-Based ALDH1A1 Inhibitors.
Reagents and conditions: (a) corresponding substituted piperidine, (i-Pr)2NEt, EtOH, 80–90 °C, sealed, 2–24 h, 8 (84–99%), 9 (90%), 10 (75–94%); (b) 1 N NaOH(aq) or 1.5 N LiOH(aq), THF/MeOH, rt to 50 °C, 3–24 h, 11 (80–99%), 12 (82%), 13 (87–99%); (c) corresponding amine, (i-Pr)2NEt, HATU, DMF, rt, 1–3 h; (d) cat. p-toluenesulfonic acid monohydrate, acetone/H2O, 55 °C, 2 d; (e) LiBH4, THF, 60 °C, 3 h, 14 (41%); (f) Dess–Martin periodinane, CH2Cl2, rt, 2 h, 15 (43%); (g) cyclopropyl(piperazin-1-yl)methanone (HCl salt), NaBH(OAc)3, CH2Cl2, rt, 4 h.
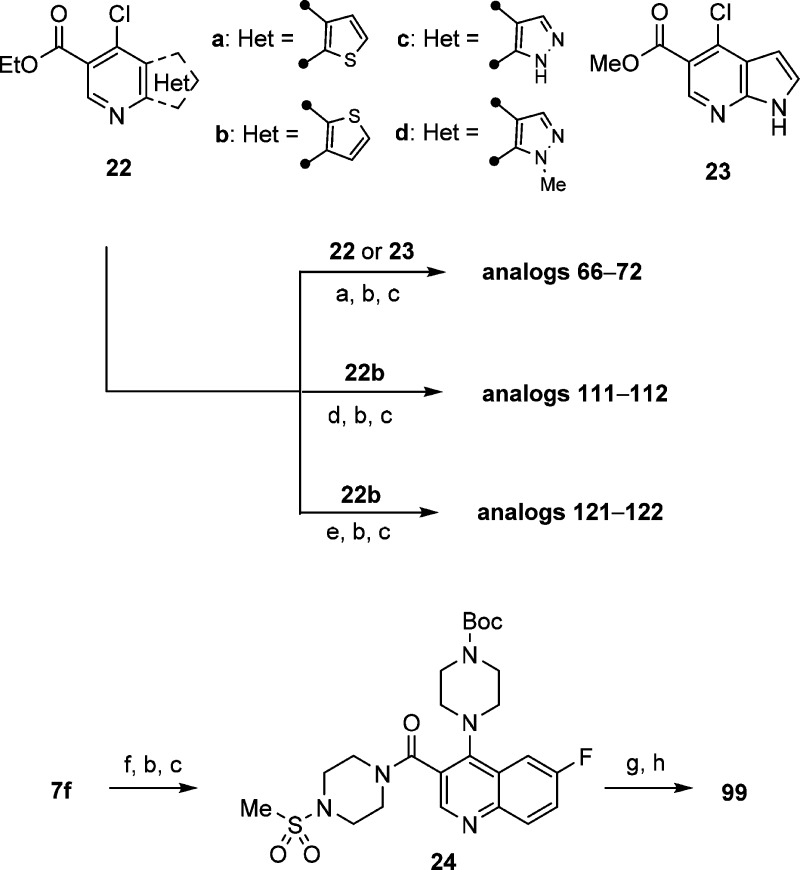
Scheme 3. Synthesis of Heteroaryl-Fused Pyridine ALDH1A1 Inhibitors.
Reagents and conditions: (a) 4-methylpiperidine-4-carbonitrile HCl salt, (i-Pr)2NEt, EtOH, 80 °C, sealed, 24 h, 80–99%; (b) 1 N NaOH(aq) or 1.5 N LiOH(aq), THF/MeOH, rt to 50 °C, 3–24 h, 56–97%; (c) corresponding amine, (i-Pr)2NEt, HATU, DMF, rt, 1–3 h; (d) 4-phenylpiperidine-4-carbonitrile HCl salt, (i-Pr)2NEt, EtOH, 80 °C, sealed, 8 h, 94%; (e) (4-(1-cyanocyclopropyl)phenyl)boronic acid, cat. PdCl2(dppf)–CH2Cl2 adduct, K2CO3, DMF, 110 °C, 1.5 h, 52%. (f) tert-butyl piperazine-1-carboxylate, (i-Pr)2NEt, EtOH, 80 °C, sealed, 24 h, 99%; (g) HCl (4 M in 1,4-dioxane), CH2Cl2, rt, 24 h; (h) ethenesulfonyl chloride, Et3N, CH2Cl2, rt, 1 h, 48%.
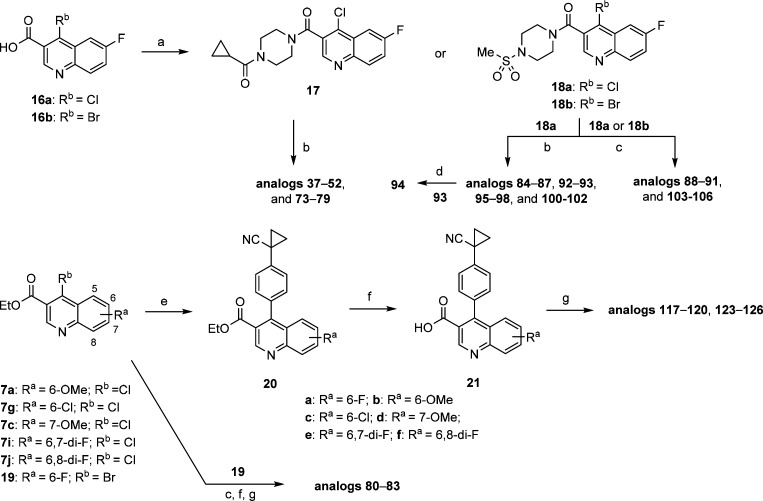
To investigate the SAR at the 4-position more efficiently, an alternative synthetic route was applied (Scheme 2). This involved amide formation of 16 to give compounds 17 and 18 which could be further elaborated to the desired analogs using the existing chloro- or bromo-functionalities. Toward this end, replacement of the chloro group with the corresponding cyclic amines was achieved under microwave irradiation conditions (such as for analogs 37–52, 73–79, 84–87, 92, 93, 95–98, and 100–102). Furthermore, by utilizing the Suzuki coupling, analogs 88–91 and 103–106 bearing carbocycles at 4-position were generated. Notably, these Suzuki coupling reactions with the chloro-functionality require harsher conditions such as polar solvent (DMF) and slightly elevated temperature (110 °C). Similar to the route described in Scheme 1, the carbocyclic substitution can be introduced first, followed by hydrolysis of the ester group and amide formation to afford desired analogs 80–83, 117–120, and 123–126.
Scheme 2. Synthesis and Modification of 4-Substitution of Quinoline-Based ALDH1A1 Inhibitors.
Reagents and conditions: (a) cyclopropyl(piperazin-1-yl)methanone HCl salt or 1-(methylsulfonyl)piperazine, (i-Pr)2NEt, HATU, DMF, rt, 1.5 h, 28–86%; (b) corresponding amine, (i-Pr)2NEt, DMF, microwave, 160–170 °C, 1–2 h; (c) corresponding boronic acid or ester, cat. PdCl2(dppf)–CH2Cl2 adduct, K2CO3, for 18a (Rb = Cl), DMF, 110 °C, 1.5 h, for 18b (Rb = Br), 1,4-dioxane/H2O (3/1), 90–95 °C, 1–2 h; (d) Dess–Martin periodinane, CH2Cl2, rt, 1 h, 76%; (e) (4-(1-cyanocyclopropyl)phenyl)boronic acid, cat. PdCl2(dppf)–CH2Cl2 adduct, K2CO3, for 20b–f, DMF, 110 °C, 1.5 h, 50–88%, for 20a, 1,4-dioxane/H2O (3/1), 90–95 °C, 2 h, 73%; (f) 1 N NaOH(aq) or 1.5 N LiOH(aq), THF/MeOH, 50–55 °C, 2 h, 86–99%; (g) corresponding amine, (i-Pr)2NEt, HATU, DMF, rt, 1–3 h
The synthetic routes illustrated in Scheme 1 and Scheme 2 not only are efficient for rapid SAR exploration at 3- and 4-positions but can also be applied to heteroaryl-fused pyridine derivatives 22 and 23 (Scheme 3). Therefore, by using similar transformations as described above, the analogs with substituted piperidine substitutions (66–72 and 111 and 112) or (1-cyanocyclopropyl)phenyl substitution (121 and 122) at the 4-position were generated by displacement or Suzuki coupling with chloro-functionality, respectively. Finally, the Boc-protected intermediate 24 was synthesized in a similar manner, subsequently deprotected and then reacted with α,β-unsaturated sulfonyl chloride to give sulfonamide 99.
Results and Discussion
The inhibitory potency of these analogs was tested in enzymatic assays using recombinant human ALDH1A1. In parallel, the cellular activity was evaluated using a high-throughput Aldefluor assay, in which the fluorescent BODIPY-aminoacetaldehyde is converted to BODIPY-aminoacetic acid by cellular ALDHs. Specifically, we utilized MIA PaCa-2, a pancreatic cancer cell line with high ALDH1A1 expression levels.25 To aid the SAR development and optimization, a single point, high-throughput rat liver microsomal (RLM) stability assay was also implemented. The first set of data compiled in Table 1 served to reconfirm the activities of existing prior art compounds. Importantly, these compounds (1–5) exhibited similar potency to previously reported values in both the ALDH1A1 enzymatic assay and MIA PaCa-2 Aldefluor cell-based assay except that 3 was slightly more potent in ALDH1A1 enzymatic assay (0.12 μM vs 0.39 μM). Encouragingly, the first compound (28) synthesized based on the hybrid design approach had comparable potencies to NCT-501 (4) and 5 in both ALDH1A1 (0.019 μM) and MIA PaCa-2 (4.09 μM) with moderate RLM stability. Removal of carbonyl group (25) showed similar biochemical potency in the ALDH1A1 assay but was ∼3-fold less potent in Aldefluor assay than analog 28 or the sulfone HTS hit 5 and had decreased RLM stability (t1/2 = 3 min). Furthermore, converting the potential acid-labile ketal functionality to corresponding ketone 26 resulted in significantly decreased potency in both the enzyme and cell assays. Therefore, the ketal-piperidine and piperazine-amide functionalities were maintained for further evaluating the substituent effect around quinoline core. Several substituted groups (such as H, Me, OMe, F, and Cl) at positions 6–8 were evaluated, and significant differences in potency was observed depending on the substitution on quinoline core. In general, F substitution (e.g., 32, 35–36) seemed to be favored with good RLM stability. Given these results, the 6-F substituted quinoline (32), which has slightly lower molecular weight and a promising activity profile, was selected for further optimization.
Table 1. SAR of Substitution Effect on Quinoline Core of ALDH1A1 Inhibitors.
Values with standard deviation (SD) represent the average from at least three experiments.
RLM represents rat liver microsomal stability conducted at NCATS in the presence of NADPH.
Internal rescreened data in this study.
Compounds noted as >57 μM represent a very weak or no inhibition [efficacy of ≤50% of full inhibition at highest tested concentration (57 μM)].
Data not available.
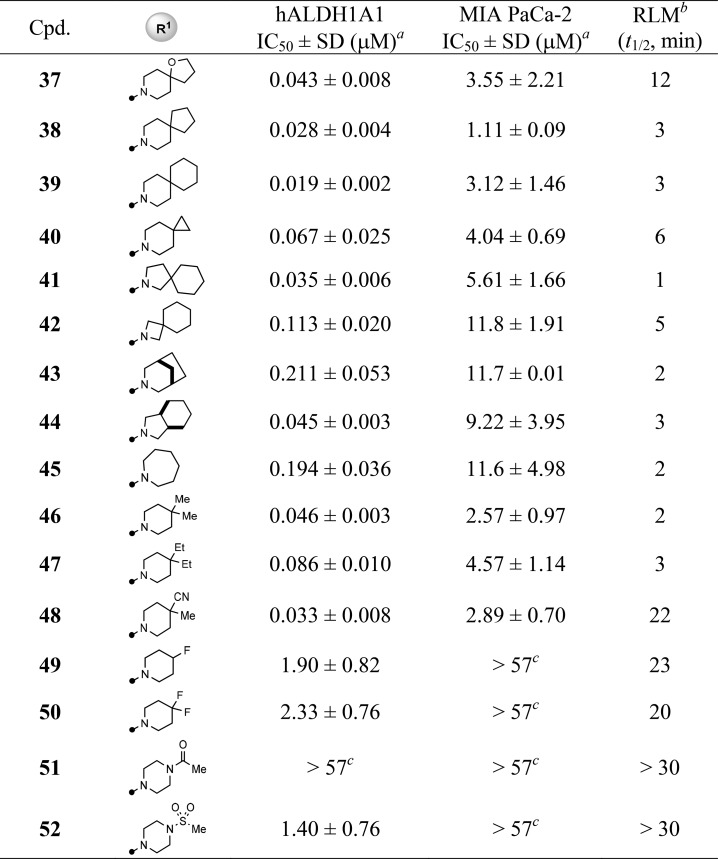
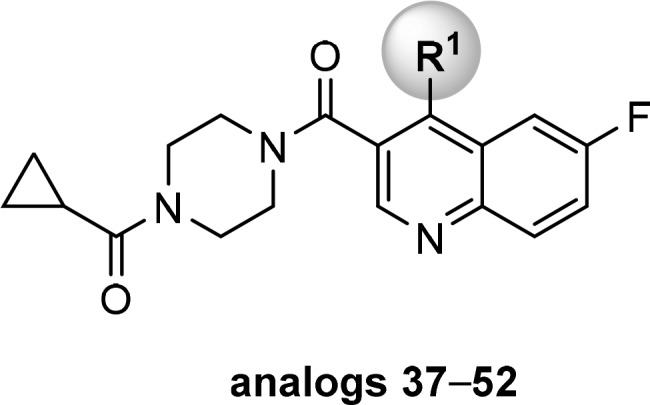
In light of the deprotected ketone 26 losing all inhibition, seeking a suitable replacement of the potential acid-labile ketal moiety became our next focus and priority (Table 2). Removing the oxygen atom from the ketal functionality (37, 38) or using spiro-piperidine (38–40) substitution gave comparable inhibitory activities, yet decreased RLM stabilities (t1/2 < 12 min). The potency in both ALDH1A1 and MIA PaCa-2 assays started to drop when the ring size of the six-membered spiro-piperidine was reduced to the four-membered spiro-azetidine (39 vs 41–42). Furthermore, the fused-bicyclic substitutions (43, 44) and seven-membered homopiperidine (45) also resulted in a loss of potency, especially with respect to cellular activity (IC50 = 9–11 μM). In contrast, replacing the ketal ring with dimethyl (46) or diethyl (47) groups retained potency. Among the changes made for ketal replacement, the 4-methyl-4-cyanopiperidine (48) was found to be the one that possessed both desirable potency (IC50 = 0.033 μM and 2.89 μM for ALDH1A1 and MIA PaCa-2, respectively) and improved RLM stability (t1/2 = 22 min). Finally, the R1 group at 4-position seemed to favor hydrophobic substituents as polar groups (e.g., 51, 52) and even F-substituted piperidine (e.g., 49, 50) were significantly less potent, though these substitutions showed better RLM stability. These findings suggest that the R1 substitution likely mimics the isopentyl of NCT-501 (4) that points to the catalytic pocket.20
Table 2. SAR of R1 Substitution of Quinoline Core.
Values with standard deviation (SD) represent the average from at least three experiments.
RLM represents rat liver microsomal stability conducted at NCATS in the presence of NADPH.
Compounds noted as >57 μM represent a very weak or no inhibition [efficacy of ≤50% of full inhibition at highest tested concentration (57 μM)].
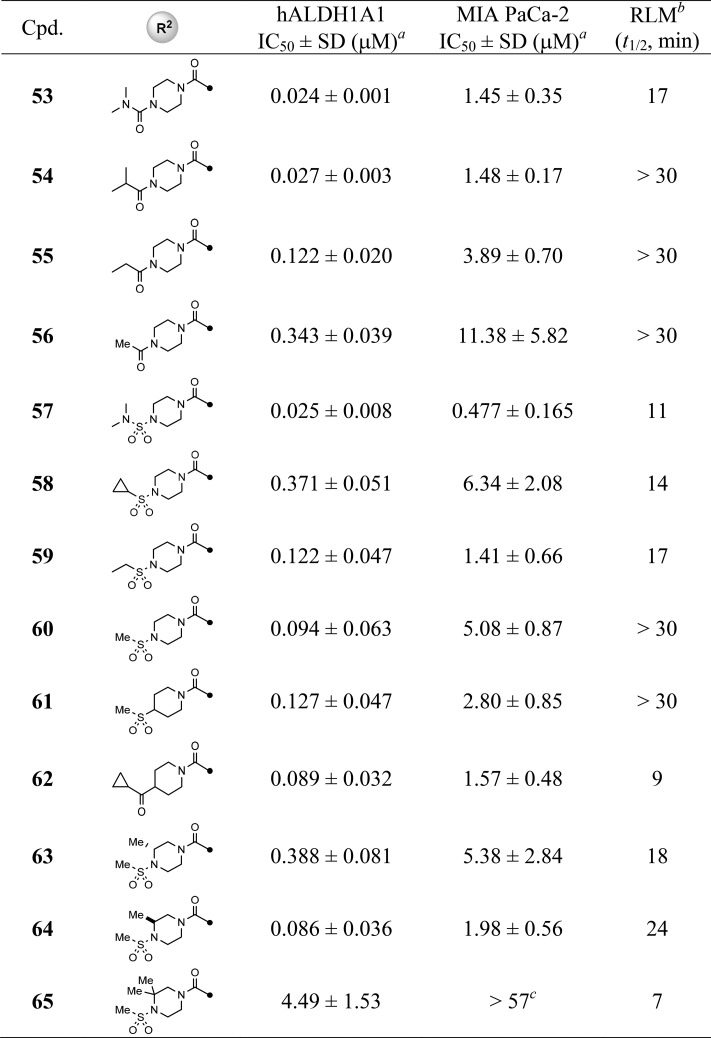
Given that the 4-methyl-4-cyanopiperidine is a suitable replacement of original ketal-piperidine substitution, we maintained this motif on a set of analogs aimed to address the SAR on R2 substitution in comparison with newly identified lead 48 (Table 3). Potency was retained when replacing the cyclopropylamide with dimethylurea moiety (53) or ring-opened isopropylamide (54), whereas reducing the size of isopropyl to ethyl or methylamide resulted in a decrease in both enzymatic and cellular potencies (54–56); however, these compounds were more metabolically stable (RLM t1/2 > 30 min). For the sulfonamide modifications, the dimethylureasulfonamide (57) was less stable (RLM t1/2 = 11 min) yet potent in the MIA PaCa-2 cell assay (IC50 = 0.48 μM). Moreover, the trend of SAR seemed opposite to amide substitutions described above in that the smaller methanesulfonamide was favored in both potency and RLM stability (e.g., 58 and 59 vs 60). Replacing the piperazine (60) with a piperidine (61, 62) resulted in a similar potency but much less RLM stability for 62 (t1/2 = 9 min vs 22 min for 48). The effect of various substitutions on the piperazine ring was briefly examined and revealed no obvious improvement in terms of potency and/or RLM stability, with the dimethylpiperazine (65) being inactive in cell-based assays.
Table 3. SAR of R2 Substitution of Quinoline Core.

Values with standard deviation (SD) represent the average from at least three experiments.
RLM represents rat liver microsomal stability conducted at NCATS in the presence of NADPH.
Compounds noted as >57 μM represent a very weak or no inhibition [efficacy of ≤50% of full inhibition at highest tested concentration (57 μM)].
Having already evaluated the SAR of substitutions at 3- and 4-position of quinoline core, several bicyclic heteroaryl cores were briefly examined. The results compiled in Table 4 revealed the thiophene-fused pyridine (bioisostere of quinoline) analogs, such as 66–69, were all well tolerated. The pyrrole- and pyrazole-fused pyridine analogs, 70–72, resulted in slightly decreased potency in both ALDH1A1 and MIA PaCa-2. In general, these analogs maintained good RLM stability and suggest these heteroaryl cores as suitable alternatives to the existing quinoline core.
Table 4. SAR of Bicyclic Heteroaryl Cores.
Values with standard deviation (SD) represent the average from at least three experiments.
RLM represents rat liver microsomal stability conducted at NCATS in the presence of NADPH.
Data not available.
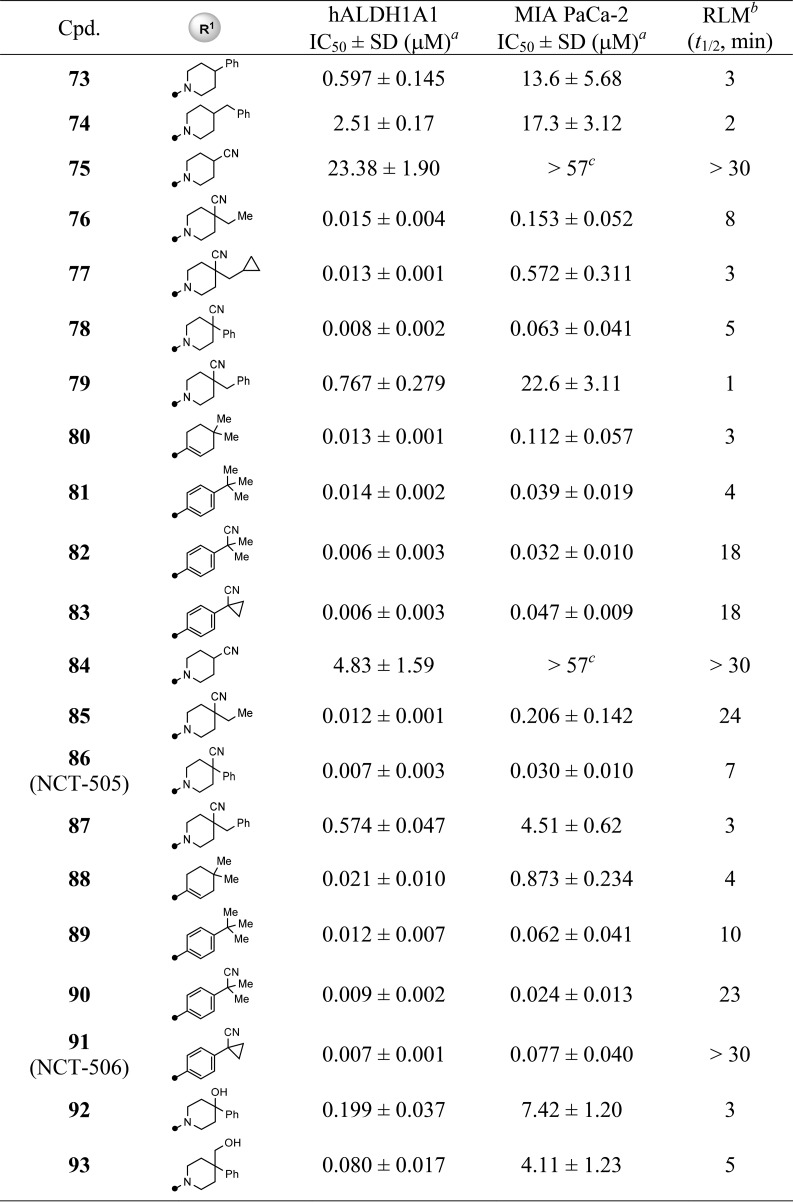
With the completion of the first round of SAR exploration (Tables 1–4) which covered the SAR at 3- and 4-positions, substitution on the quinoline ring, and the influence of bicyclic heteroaryl cores, several new leads, such as 48, 60, and 68, were identified as having excellent enzymatic potency and suitable RLM stability. However, no marked improvement of cellular potency in MIA PaCa-2 cells was achieved. In light of the reported cocrystallized structure of a theophylline-based analog that is structurally similar to 4, the current R1 substitution at 4-position seemed to mimic the isopentyl group that points toward the catalytic site surrounded by hydrophobic residues Phe171 and Phe466.20 We reasoned that increasing the interaction with these amino acid residues, perhaps via π–π interaction, may potentially boost the cellular activity (i.e., through longer drug–target residence time). To test this hypothesis, we revisited the R1 portion with a phenyl-substituted piperidine or phenyl groups directly attached; the results are compiled in Table 5. In comparison to the lead 48, modification at the 4-position of the piperidine with simple phenyl (73) or benzyl (74) groups resulted in a loss of potency. Removal of methyl group using 4-cyanopiperidine (75) as the R1 substitution caused the inhibitory potency to drop significantly (75, IC50 = 23.4 μM) and to be completely inactive (75, IC50 > 57 μM) in the MIA PaCa-2 assay. The SAR suggested both the cyano group and perhaps a suitable hydrophobic group are required to enhance the potency. This speculation was further supported by changing the methyl group to the slightly larger ethyl (76) or cyclopropylmethyl (77) groups which returned the enzymatic potency back to low nanomolar range with improved cellular potencies below 1 μM (48 vs 76 and 77). Most impressively, replacing the methyl group with phenyl (analog 78) dramatically improved the biochemical and cell-based potency with IC50 values of 8 nM and 63 nM, respectively. Perhaps the larger phenyl group preferably occupies the 4-equatorial position of piperidine ring leading the cyano group to occupy the axial position, providing favorable interactions with enzyme backbone. However, the combination of cyano and benzyl group (79) led to a decrease in potency, presumably due to the benzyl group being too large sterically for that region of the binding pocket. Other attempts to improve cellular activity were also examined by using planar carbocycles instead of piperidine ring to provide a potential π–π interaction with Phe171 or Phe466. For instance, by attachment of cyclohexene (80) or a planar phenyl ring (81), the cellular potencies were once again significantly improved to 39–112 nM (2.57 μM for 46). Furthermore, replacing one methyl group from tert-butyl substitution with cyano group (81 vs 82) or forming a cyclopropyl ring (83) increased RLM stability while retaining the potent cellular potency. These SAR findings that led to marked improvement of cellular activity were further corroborated by piperazine-sulfonamide substituted analogs 84–91. The 4-cyano-4-phenyl-piperidine substituted compound 86 (NCT-505) and the analogs with the phenyl group directly attached (89–91 (NCT-506)) remained highly potent in both enzymatic (7–12 nM) and cellular assays (24–77 nM).
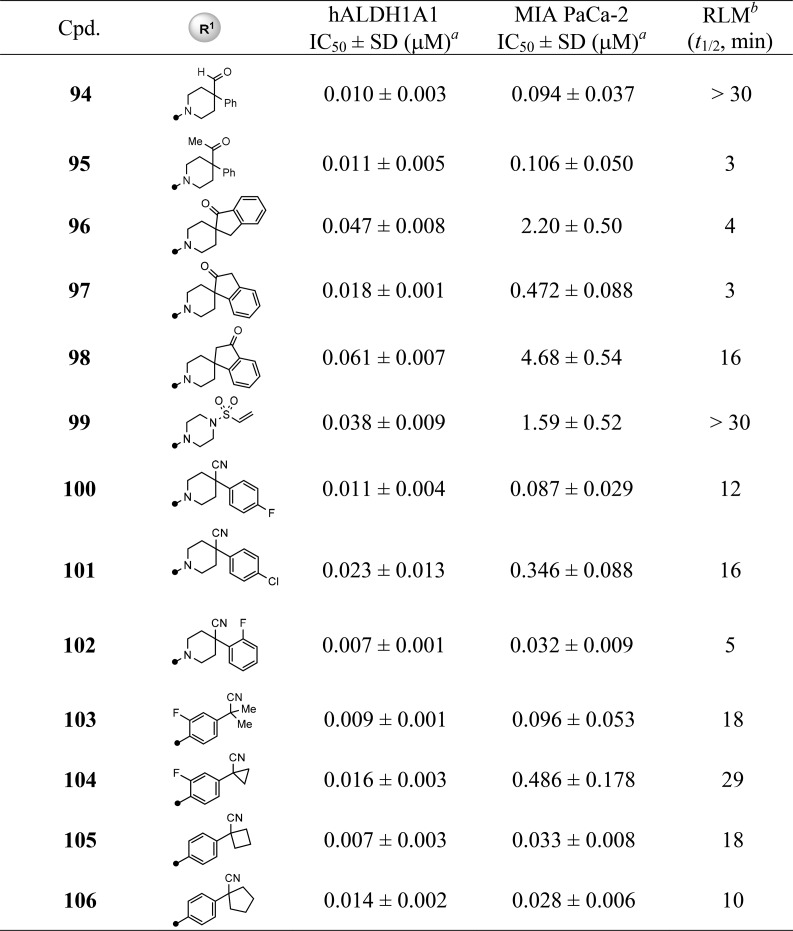
Table 5. SAR of R1 Substitution: Analogs 73–106.
Values with standard deviation (SD) represent the average from at least three experiments.
RLM represents rat liver microsomal stability conducted at NCATS in the presence of NADPH.
Compounds noted as >57 μM represent a very weak or no inhibition [efficacy of ≤50% of full inhibition at highest tested concentration (57 μM)].
We consistently found that changing the cyano group to hydroxyl or hydroxymethyl greatly diminished cellular potency to the 4–7 μM range (92 and 93 vs 86). Interestingly, aldehyde (94) or methyl ketone (95) substitutions seemed well tolerated, supporting the possibility of forming reversible covalent adducts with the cysteine residue at catalytic site.18 Of note, connecting the carbonyl functionality with a phenyl ring to form spiro substitutions (e.g., 96–98) decreased cellular potency. However, unlike the much less potent piperazine-sulfonamide analog 52 described above, the α,β-unsaturated sulfonamide 99, exhibited good potency in biochemical (IC50 = 38 nM) and moderate activity in cell-based (IC50 = 1.59 μM) assays. Moreover, introducing small halogen substitution on the phenyl ring, which aimed to improve RLM stability, showed no significant improvement (100–102). In contrast, introduction of F substitution on the directly attached phenyl ring caused cellular potency and RLM stability to drop slightly (103 and 104 vs 90 and 91). Finally, the ring expansion from cyclopropyl (91) to cyclobutyl (105) and cyclopentyl (106) were well tolerated with similar inhibitory activities. Though the optimization has led to analogs with potent enzymatic and cellular activities, in general, the piperidine-type substitution has less RLM stability (e.g., 78, 86, and 102) than the phenyl group directly attached analogs (e.g., 83, 91, and 105).
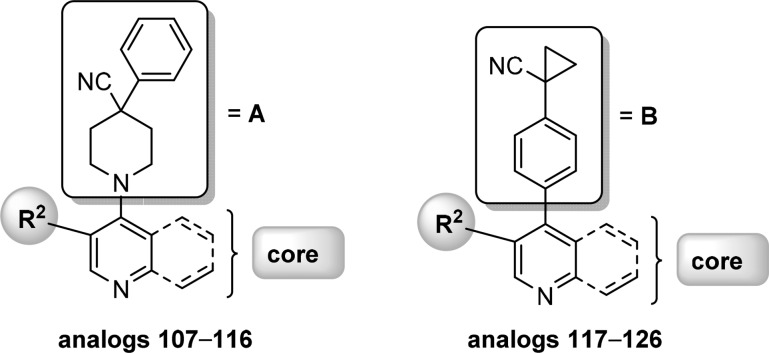
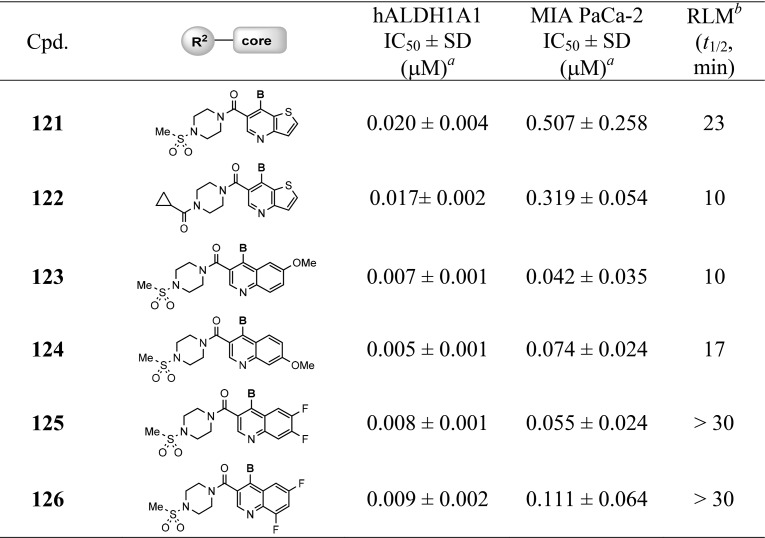
With suitable substitutions at the 4-position of quinoline ring that led to high cellular potency having been identified, a set of analogs were synthesized which represent a combination of these favored substitutions (A and B in Table 6) with preferred R2 substitution, bicyclic cores, and substitution on quinoline ring selected from the SAR efforts described above. Results compiled in Table 6 reveal that these analogs exhibited excellent inhibitory activities in both enzymatic and cellular assays as expected. With exception of analogs 121, 122, and 126, all analogs were highly potent in MIA PaCa-2 cells (<100 nM). Consistently, the phenyl analogs (117–126) showed better RLM stability in a comparison to the corresponding piperidine substituted analogs 107–116. To date, the above-mentioned analogs identified through a systematic medicinal chemistry optimization represent the first chemical series of ALDH1A1 inhibitors having high cellular potency (<100 nM).
Table 6. SAR of Analogs 107–126.
Values with standard deviation (SD) represent the average from at least three experiments.
RLM represents rat liver microsomal stability conducted at NCATS in the presence of NADPH.
Selectivity Evaluation
With completion of SAR campaign, a set of analogs with potent ALDH1A1 biochemical and MIA PaCa-2 cellular activities, along with the above-described prior art inhibitors, were selected and screened against a panel of enzymes including ALDH1A subfamily (ALDH1A2 and ALDH1A3), ALDH isozymes (ALDH2, and ALDH3A1) and other dehydrogenases such as 15-hydroxyprostaglandin dehydrogenase (HPGD) and type-4 hydroxysteroid dehydrogenase (HSD17β4).26 ALDH1A1 shares high sequence identity (>70%) to subfamily members ALDH1A2 and ALDH1A3, nearly 70% similarity to mitochondrial ALDH2 isozyme, less than 50% sequence identity to ALDH3A1,20 and significantly less similarity to HPGD or HSD17β4. The selection of analogs includes piperazine-type substitutions, 4-cyano-4-phenylpiperidinyl and 4-(cyano-cyclopropyl)phenyl substitutions with representative bicyclic heteroaryl core (e.g., thieno[3,2-b]pyridine), and various small substitutions on quinoline core. As shown in Supporting Information Table S1, these analogs generally exhibited no inhibition (>57 μM) toward HSD17β4 and weak (>20 μM) to no inhibition against HPGD, ALDH3A1, and even ALDH1A2, despite its higher sequence identity to ALDH1A1. However, some low inhibitory activities in the 10–30 μM range against ALDH1A3 and/or ALDH2 were observed, such as analogs 78 and 88 having potency in 5–9 μM. These selectivity data support the notion of this chemical series inhibitory activity being highly ALDH1A1 specific.
Correlations in Various Cancer Cell Lines
To demonstrate the potential utility in different types of cancers, these selective ALDH1A1 inhibitors were also screened against other cancer cell lines using the high-content Aldefluor assay. These cell lines included HT-29 (a colon cancer cell line) and OV-90 (an OC cell line) which both express high levels of ALDH1A1 as confirmed by Western blotting (Supporting Information Figure S1A).25 All screened compounds showed comparable activity levels in all cell lines with high activity correlations (R2 > 0.96) between MIA PaCa-2, HT-29, and OV-90 (Figure 2 and Supporting Information Table S2).
Figure 2.
Correlation plots of Aldefluor cell-based assays: (A) MIA PaCa-2 vs HT-29; (B) MIA PaCa-2 vs OV-90; (C) OV-90 vs HT-29.
Cellular Thermal Shift Assay (CETSA)27,28
To further confirm the target engagement in cells, several analogs were selected and evaluated through CETSA using the OV-90 cell line. Analogs 86 and 91, which represent two different types of substitution at 4-position of the quinoline ring and have potent cellular activity, were used to determine the ALDH1A1 melting curve and facilitate the temperature selection for further efficacy determination. As showed in Figure 3A and Supporting Information Figure S2, both 86 and 91 increased by 3–4 °C the melting point of ALDH1A1 compared to DMSO vehicle, indicating ligand-mediated stabilization. Subsequently, a temperature of 70 °C was chosen to assess compounds in dose titration. Among analogs screened (Figure 3B and Supporting Information Figure S3), those with potent cellular activity, such as 86, 91, 109, and 119, demonstrated better stabilization with EC50 in the 2–5.6 μM range. While compound 3 having cellular potency at 1.13 μM (MIA PaCa-2) showed some stabilization at higher concentration (EC50 > 50 μM), analogs exhibiting weaker cellular potency (MIA PaCa-2 IC50 > 5 μM), such as analogs 1, 4 (NCT-501), and early lead 60, did not stabilize ALDH1A1.
Figure 3.
CETSA assay in OV-90 cells: (A) ALDH1A1 melting curve determination; (B) compound titration and EC50 determination at 70 °C.
Monolayer (2D) vs Spheroid (3D) Cultures of OV-90 Cells
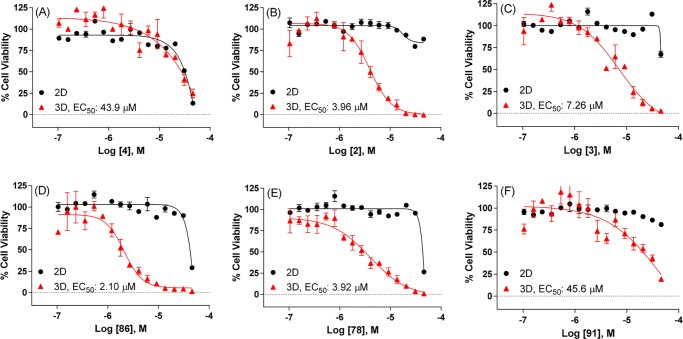
Cells grown in three-dimensional cultures or spheroids behave differently compared to cells grown in two-dimensional cultures or monolayers, better approximating the growth conditions of tumor cells in vivo.29,30 The spheroids of several OC tumor cell lines were shown to display upregulated ALDH1A1 expression compared to their monolayer counterparts.21 Moreover, inhibition of ALDH1A1 activity reportedly disrupts spheroid formation.21 To this end, the OV-90 cells were chosen to test the effect of ALDH inhibition in spheroid formation assays as this cell line has higher ALDH1A1 expression levels compared to other OC cell lines examined (Supporting Information Figure S1B) and increased expression of ALDH1A1 in 3D vs 2D cultures (Supporting Information Figure S1D). Furthermore, the OV-90 cells have undetectable expression of ALDH1A2, ALDH1A3, ALDH3A1 isozymes in Western blotting assays (Supporting Information Figure S1C) and the capability to form spheroids.31,32 Therefore, OV-90 cells grown in 2D and 3D cell cultures were treated with selected ALDH1A1 inhibitors and prior art compounds. The viability was measured using the CellTiter-Glo assay. NCT-501 (4) exhibited some cytotoxicity at high concentrations but displayed no difference in 2D vs 3D formats (Figure 4A). Despite weak stabilization in the CETSA assay (3) and micromolar range of cellular activities (>57 μM and 1.13 μM for 2 and 3, respectively), compounds 2 and 3 demonstrated significantly decreased cell viability in 3D assays with EC50 of 3.96 and 7.26 μM for 2 and 3, respectively (Figure 4B and Figure 4C). These results suggest possible off-target effects could be involved, particularly for 2, as it showed weak potency in enzymatic assay and no activity in Aldefluor cell-based assays described above. The compounds with moderate cellular activities, such as 1 and 60 (5–13 μM in MIA PaCa-2), showed little to no shift in 3D assays (Supporting Information Figure S4A and Figure S4B). However, the 4-cyano-4-phenyl-piperidine substituted analogs, exemplified as 86 and 78, not only possessed potent cellular activities but also exhibited a marked left shift in 3D assays with low micromolar range of EC50 (2.10–3.92 μM, Figure 4D and Figure 4E). In comparison with 86, the cyano-cyclopropyl-phenyl substituted analog 91 showed much less efficacy, though it exhibited good potency in cells (Figure 4D vs Figure 4F). A similar trend was observed for analogs 108 and 109 vs 118 and 119, respectively, which confirms that the 4-cyano-4-phenyl-piperidine substituted analogs are superior to the cyano-cyclopropyl-phenyl substituted compounds (Supporting Information Figure S4C–F).
Figure 4.
Viability of OV-90 cells in 2D and 3D cultures treated with representative ALDH1A1 inhibitors for (A) compound 4, (B) compound 2, (C) compound 3, (D) compound 86, (E) compound 78, (F) compound 91: (black dot) 2D; (red triangle) 3D.
Sensitizing Effects in a Paclitaxel Resistant Cell Line
The up-regulation of ALDH1A1 in cancers has been implicated in the development of drug resistance both in vitro and in vivo. More specifically, overexpression of ALDH1A1 was found in paclitaxel- and cisplatin-resistant lung cancer and OC cell lines.33−37 An increased expression of ALDH1A1 after paclitaxel and epirubicin-based chemotherapy was also associated with poor clinical response to chemotherapy in breast cancer patients.7,38 Knockdown of ALDH1A1 was shown to reverse cisplatin resistance in lung adenocarcinoma cells as well as paclitaxel and topotecan resistance in OC cells.37,39
Therefore, to demonstrate the effectiveness of these inhibitors, combination studies with paclitaxel were conducted using SKOV-3-TR, a paclitaxel-resistant OC cell line. The expression of ALDH1A1 in SKOV-3-TR is markedly higher than in SKOV-3-WT (wild-type) cells as determined by Western blotting (Supporting Information Figure S1E). As expected, SKOV-3-TR cells are less sensitive toward paclitaxel compared to SKOV-3-WT cells (IC50 = 17.4 and 1175 nM for WT and TR cells, respectively, Supporting Information Figure S5). Treatment with the proteasome inhibitor bortezomib yielded comparable IC50 in both cell types (IC50 = 12.9 nM and IC50 = 8.0 nM for WT and TR cells, respectively). Of note, the efficacy of paclitaxel inhibition in SKOV-3-WT reached only 50% in a comparison with complete inhibition measured with bortezomib.
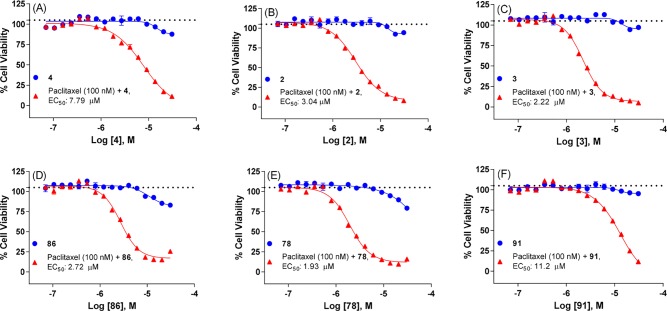
Our initial study focused on a dose-dependent titration of ALDH1A1 inhibitor with a fixed paclitaxel concentration of 100 nM, which is approximately 12-fold below its IC50 in SKOV-3-TR and does not alter cell viability. The results from selected inhibitors were compiled in Figure 5 and Supporting Information Figure S6. In contrast to the lack of effect observed in the 2D vs 3D assay above, NCT-501 (4) sensitized SKOV-3-TR cells to paclitaxel, while no effect was observed with paclitaxel (100 nM) or 4 (dose dependent) alone (Figure 5A). Compounds 2 and 3 also decreased cell viability in combined treatments with EC50 of 3.04 and 2.22 μM, respectively. Consistently, the 4-cyano-4-phenyl-piperidine substituted analog, exemplified as 86 and 78, demonstrated higher sensitizing effect (EC50 = 1.93–2.72 μM) than cyano-cyclopropyl-phenyl substituted analog 91 (EC50 = 11.2 μM). (A similar trend was observed for analogs 108 and 109 vs 118 and 119, Supporting Information Figure S6C–F.)
Figure 5.
Cell viability of SKOV-3-TR (paclitaxel-resistant) cells in combined treatments of paclitaxel (100 nM) and ALDH1A1 inhibitor (dose-dependent) for (A) compound 4, (B) compound 2, (C) compound 3, (D) compound 86, (E) compound 78, (F) compound 91: (blue dot) ALDH1A1 inhibitor (dose dependent); (red triangle) paclitaxel (100 nM) + ALDH1A1 inhibitor (dose dependent). Black dotted line indicates paclitaxel treatment at 100 nM (n = 32).
Conversely, we then treated cells with a titration of paclitaxel and a fixed concentration of selected ALDH1A1 inhibitors. The results compiled in Figure 6 and Supporting Information Figure S7 showed marked left shift in paclitaxel’s IC50 when the concentration of ALDH1A1 inhibitor increased. For example, the IC50 of paclitaxel titration was 1202, 848, 226, 25.2, 9.2, and 6.5 nM when combined with 86 at 0 (DMSO), 1, 3, 10, 20, 30 μM, respectively (Figure 6A and Figure 6B). A less prominent shift of paclitaxel’s IC50 was observed in combined treatment with 91, together with paclitaxel’s IC50 of 1202, 924, 870, 411, 102, and 31.8 nM with concentrations of 91 at 0 (DMSO), 1, 3, 10, 20, 30 μM, respectively (Figure 6C and Figure 6D).
Figure 6.
Cell viability of SKOV-3-TR (paclitaxel-resistant) cells in combination treatments of paclitaxel (dose dependent) and ALDH1A1 inhibitor (fixed concentration at 0 (DMSO), 1, 3, 10, 20, 30 μM, respectively).
Through the stabilization of microtubules, paclitaxel induces mitotic arrest and apoptosis-mediated cell death in vitro.40 We treated SKOV-3-TR cells with paclitaxel, 86, or a combination of both and measured the percentage of mitotic cells using imaging-based analysis. The results presented in Figure 7A indicate that either paclitaxel or 86 alone has no effect on the percentage of mitotic cells compared to DMSO. However, a combination treatment increased the percentage of mitotic cells by 4-fold. Kinetic quantification of caspase activation also indicates that combination of paclitaxel and 86, but not either compound alone, induces apoptosis in SKOV-3-TR cells (Figure 7B). Altogether, these results further supported that inhibiting ALDH1A1 activity with specific inhibitors could sensitize and boost drug efficacy providing a potential treatment in drug-resistant cancers.
Figure 7.
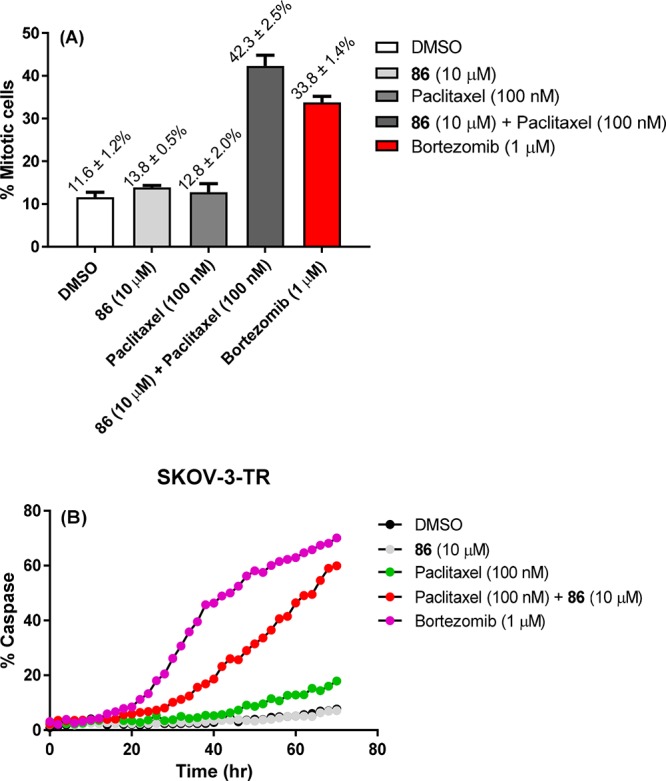
(A) Mitotic percentage of SKOV-3-TR (paclitaxel-resistant) cells in single and combination treatments of paclitaxel (100 nM) and 86 (10 μM). (B) Apoptosis induction in SKOV-3-TR cells in single and combination treatments of paclitaxel (100 nM) and 86 (10 μM) over time.
Lastly, to confirm that the boosted efficacy of paclitaxel in SKOV-3-TR was not caused by ALDH1A1 inhibitors preventing drug transporter-mediated efflux, 86 and 91 were co-incubated with the P-gp substrate paclitaxel or vincristine in P-gp expressing KB-8-5-11 cells (a derivative of HeLa cells).41 Compared to co-incubation with the known P-gp inhibitor tariquidar, both 86 and 91 did not potentiate the cell-killing effects of paclitaxel or vincristine, suggesting that they are not inhibitors of P-gp (Figure S8).
Pharmacokinetics and in Vitro ADME Profiles
After demonstration of desirable potency and selectivity, as well as efficacy in several cancer cell lines, representative analogs were selected and further evaluated for their pharmacokinetics (PK) in male CD-1 mice at 2 mg/kg and 10 mg/kg for intravenous (iv) and oral (po) administration, respectively. The PK results compiled in Table 7 and Supporting Information Table S3 revealed that compound 86 has a better PK profile than other 4-cyano-4-phenyl-piperidine substituted analogs 78, 108, and 109, in terms of improved drug exposure (e.g., AUC0–∞ values after oral treatment of 10 mg/kg are 2518, 844, 720, 227 h·ng/mL for 86, 108, 109, and 78, respectively) and better oral bioavailability (44% for 86 vs 9–31% for 78, 108, and 109). The moderate plasma clearance level (CLp= 30 mL/min/kg) of 86 is largely attributed to the hepatic metabolism as its half-life in in vitro mouse microsomal stability assays (in multipoint format) is only 5 min. Carefully analyzing the in vitro metabolism of 86 by ultraperformance LC–MS/MS indicated the hydroxylation at piperazine ring and the subsequent ring opening of piperazine ring are the major metabolites. Furthermore, the instability of 86 is not attributed to metabolism by aldehyde oxidase (AO) as its in vitro t1/2 in the presence of mouse or human liver cytosol (2 mg protein/mL) was greater than 120 min.42 Of the cyano-cyclopropyl-phenyl substituted analogs, 91 demonstrated a superior mouse PK profile compared to 118 and 119. The steady-state volume of distribution (Vss) of 1.4 L/kg suggests that the compound penetrates to tissues well, and high systemic exposure (e.g., oral AUC0–∞ = 6980 h·ng/mL) with 76% of bioavailability indicates that 91 is well absorbed after oral administration. Compound 91 also exhibited lower clearance (CLp= 18 mL/min/kg) and long half-life of drug exposure (t1/2 = 1.3 and 2.2 h for iv and po administration, respectively) than analog 86, which is consistent with its in vitro stability in mouse liver microsomes (t1/2 > 120 min, in multipoint format).43 With suitable exposure obtained, the tolerability of both 86 and 91 was further evaluated in CD-1 mice via po route (50 mg/kg), once daily, for 5 consecutive days (QD*5) following 5 days observation period. During this pilot toxicity study, the animals exhibited no significant weight loss or abnormal clinical signs and no mortality was observed. In addition, 91 also demonstrated favorable plasma clearance (e.g., CLp = 11 mL/min/kg) and good systemic exposure (e.g., oral AUC0–∞ = 7536 h·ng/mL) in Sprague-Dawley rats with 48% of oral bioavailability. While compound 91 is less efficacious in the in vitro assays, the favorable PK profile and drug-like properties support its further development.
Table 7. Pharmacokinetics (PK) of Compounds 86 and 91.
| compda | routeb | speciesc | Cmax (ng/mL)d | t1/2 (h) | AUC0–∞ (h·ng/mL) | Vss (L/kg) | CLp (mL/min/kg) | F (%) |
|---|---|---|---|---|---|---|---|---|
| 86 | iv | mouse | 2350 | 0.3 | 1141 | 0.7 | 30 | |
| 86 | po | mouse | 1234 | 1.6 | 2518 | 44 | ||
| 91 | iv | mouse | 1997 | 1.3 | 1830 | 1.4 | 18 | |
| 91 | po | mouse | 1530 | 2.2 | 6980 | 76 | ||
| 91 | iv | rat | 2587 | 1.5 | 3160 | 0.7 | 11 | |
| 91 | po | rat | 1980 | 3.5 | 7536 | 48 |
n = 3. The compound was formulated as solution in 20% HP-β-CD in saline.
Dosage: 2 mg/kg for intravenous (iv) and 10 mg/kg for oral (po) administration. Plasma samples were measured for drug exposure by LC–MS/MS.
CD-1 mouse or Sprague-Dawley rat were used.
The maximum drug concentration (Cmax) was observed at t = 5 min, the first sampling time point after iv administration.
With the favorable PK profiles obtained in mice, 86 and 91 were further profiled for other in vitro ADME properties. Both 86 and 91 possessed good permeability (725 × 10–6 cm/s and 388 × 10–6 cm/s, respectively) in parallel artificial membrane permeability assay (PAMPA), which is further corroborated by the permeability measurement in Caco-2 cells (Papp(A–B) = 11.4 × 10⁻⁶ cm/s and 5.76 × 10⁻⁶ cm/s for 86 and 91, respectively). The efflux ratio, calculated by Papp(B–A) (10–6 cm/s)/Papp(A–B) (10–6 cm/s) = 17.2/11.4 = 1.52 for 86 and Papp(B–A) (10–6 cm/s)/Papp(A–B) (10–6 cm/s) = 22.40/5.76 = 3.89 for 91, indicates that 86 and 91 do not seem to be a good substrate for P-gp transporters, though the efflux ratio for 91 is slightly higher. These analogs also exhibited high plasma protein binding (in mouse, 97.9% and 95.9% bound for 86 and 91, respectively) with low inhibition potential (>10 μM) to major human CYP isozymes, such as 3A4-midazolam, 2C9, and 2D6. No significant shift in IC50 of human CYP inhibition study in the presence and absence of NADPH preincubation indicates both 86 and 91 are not time-dependent inhibitors for these CYP isozymes. Finally, these compounds exhibited moderate activity in hERG channel binding assay (5.46 and 10.94 μM for 86 and 91, respectively) which suggests that additional studies to determine the potential cardiovascular side effects may be warranted.
Conclusion
The overexpression of specific ALDH isozymes in certain cancers and CSCs, supported by the effects of preventing spheroids formation and reducing tumor proliferation through selective targeting of ALDH isozymes, suggests ALDHs as potential targets for cancer and CSC-directed therapeutics.30 In this study, a newly designed series of quinoline-based ALDH1A1 inhibitors derived from a hybrid approach of NCT-501 and a structurally distinct qHTS hit was synthesized and evaluated. A systematic medicinal chemistry optimization ultimately led to inhibitors that exhibited high enzymatic potencies44 and potent cellular activities in various cancer cell lines with improved eADME properties. This chemotype exhibited a high selectivity over other ALDH isozymes (ALDH1A2, ALDH1A3, ALDH3A1, and ALDH2) and other dehydrogenases (HPGD and HSD17β4). Selected analogs also demonstrated target engagement in a cellular thermal shift assay (CETSA) and are capable of inhibiting the formation of 3D spheroid cultures of OV-90 cancer cells. Lead compounds potentiated the cytotoxicity of paclitaxel in SKOV-3-TR, a paclitaxel-resistant OC cell line, which suggests the potential feasibility of combined treatment with existing cancer drugs. The PK study demonstrated that analogs 86 (NCT-505) and 91 (NCT-506) have reasonable drug exposure via po administration and should be suitable for in vivo proof of concept animal studies or other disease-relevant models and can be used for a better understanding of the physiological and pathophysiological actions of this enzyme. Attempts to cocrystallize key analogs (e.g., 86 and 91) with ALDH1A1 to gain insight of inhibitor–protein interactions are currently in progress.
Experimental Section
General Methods for Chemistry
All air or moisture sensitive reactions were performed under positive pressure of nitrogen with oven-dried glassware. Chemical reagents and anhydrous solvents were obtained from commercial sources and used as is. Preparative purification was performed on a Waters semipreparative HPLC. The column used was a Phenomenex Luna C18 (5 μm, 30 mm × 75 mm) at a flow rate of 45 mL/min. The mobile phase consisted of acetonitrile and water (each containing 0.1% trifluoroacetic acid). A gradient of 10% to 50% acetonitrile over 8 min was used during the purification. Fraction collection was triggered by UV detection (220 nm). Analytical analysis for purity was determined by two different methods denoted as final QC methods 1 and 2.
Method 1. Analysis was performed on an Agilent 1290 Infinity series HPLC. UHPLC long gradient equivalent 4% to 100% acetonitrile (0.05% trifluoroacetic acid) in water over 3 min run time of 4.5 min with a flow rate of 0.8 mL/min. A Phenomenex Luna C18 column (3 μm, 3 mm × 75 mm) was used at a temperature of 50 °C.
Method 2. Analysis was performed on an Agilent 1260 with a 7 min gradient of 4% to 100% acetonitrile (containing 0.025% trifluoroacetic acid) in water (containing 0.05% trifluoroacetic acid) over 8 min run time at a flow rate of 1 mL/min. A Phenomenex Luna C18 column (3 μm, 3 mm × 75 mm) was used at a temperature of 50 °C. Purity determination was performed using an Agilent diode array detector for both method 1 and method 2. Mass determination was performed using an Agilent 6130 mass spectrometer with electrospray ionization in the positive mode. All of the analogs for assay have purity greater than 95% based on both analytical methods. 1H NMR spectra were recorded on Varian 400 MHz spectrometers. High resolution mass spectrometry was recorded on Agilent 6210 time-of-flight LC/MS system.
Representative Synthetic Procedures. (4-(Cyclopropanecarbonyl)piperazin-1-yl)(6-methoxy-4-(1,4-dioxa-8-azaspiro[4.5]decan-8-yl)quinolin-3-yl)methanone, TFA (28)
Step 1. In a microwave vial were placed ethyl 4-chloro-6-methoxyquinoline-3-carboxylate (7a, 266 mg, 1 mmol) and 1,4-dioxa-8-azaspiro[4.5]decane (215 mg, 1.50 mmol). Then EtOH (2 mL) and Hunig’s base (0.262 mL, 1.50 mmol) were added sequentially. The tube was sealed and heated at 80 °C for 3 h. After cooling to rt, the mixture was concentrated and purified by silica gel chromatography using 40–70% EtOAc/hexane as the eluent to give ethyl 6-methoxy-4-(1,4-dioxa-8-azaspiro[4.5]decan-8-yl)quinoline-3-carboxylate (360 mg, 0.97 mmol, 97% yield). 1H NMR (400 MHz, chloroform-d) δ 8.76 (s, 1H), 7.97 (d, J = 9.0 Hz, 1H), 7.40 (d, J = 2.8 Hz, 1H), 7.37 (dd, J = 9.0, 2.8 Hz, 1H), 4.45 (q, J = 7.1 Hz, 2H), 4.04 (s, 4H), 3.94 (s, 3H), 3.45–3.32 (m, 4H), 2.03–1.89 (m, 4H), 1.45 (t, J = 7.1 Hz, 3H). LC–MS (method 1): tR = 2.86 min, m/z (M + H)+ = 373.
Step 2. To a solution of ethyl 6-methoxy-4-(1,4-dioxa-8-azaspiro[4.5]decan-8-yl)quinoline-3-carboxylate (8a, 360 mg, 0.967 mmol) in THF (4 mL)/MeOH (1 mL) was added NaOH(aq) (1 N in H2O, 3 mL, 3 mmol). The mixture was heated to 50–60 °C and stirred overnight. After cooling to rt, 1 N HCl(aq) was added until the pH of aqueous layer is approximately 4–5. The mixture was concentrated to remove most of solvent. The solid was filtered and triturated with small amount of ice–water and then dried to give 6-methoxy-4-(1,4-dioxa-8-azaspiro[4.5]decan-8-yl)quinoline-3-carboxylic acid (two crops, 335 mg, 0.973 mmol, >99% yield). 1H NMR (400 MHz, DMSO-d6) δ 8.91 (s, 1H), 8.06 (dd, J = 9.3, 1.2 Hz, 1H), 7.67 (dd, J = 9.2, 2.5 Hz, 1H), 7.40 (d, J = 2.7 Hz, 1H), 3.98 (d, J = 1.1 Hz, 7H), 3.62–3.54 (m, 4H), 1.98 (dd, J = 6.9, 4.5 Hz, 4H) (proton of the carboxylic acid not shown). LC–MS (method 1): tR = 2.58 min, m/z (M + H)+ = 345.
Step 3. To a mixture of 6-methoxy-4-(1,4-dioxa-8-azaspiro[4.5]decan-8-yl)quinoline-3-carboxylic acid (11a, 34.4 mg, 0.1 mmol), cyclopropyl(piperazin-1-yl)methanone, HCl (28.6 mg, 0.15 mmol), and HATU (95 mg, 0.25 mmol) were added DMF (1 mL) and then Hunig’s base (0.105 mL, 0.60 mmol). The mixture was stirred at rt for 1 h. The mixture was filtered and submitted for purification by semipreparative HPLC to give (4-(cyclopropanecarbonyl)piperazin-1-yl)(6-methoxy-4-(1,4-dioxa-8-azaspiro[4.5]decan-8-yl)quinolin-3-yl)methanone, TFA (30.9 mg, 0.052 mmol, 52% yield). 1H NMR (400 MHz, DMSO-d6) δ 8.66 (s, 1H), 7.95 (d, J = 9.2 Hz, 1H), 7.68–7.52 (m, 1H), 7.33 (d, J = 2.8 Hz, 1H), 3.94 (d, J = 3.9 Hz, 7H), 3.87–3.13 (m, 12H), 2.10–1.75 (m, 5H), 0.73 (d, J = 6.3 Hz, 4H). LC–MS (method 2): tR = 3.56 min, m/z (M + H)+ = 481. HRMS calculated for C26H33N4O5 (M + H)+: 481.2445; found, 481.2423.
(4-(Cyclopropanecarbonyl)piperazin-1-yl)(6-fluoro-4-(1-oxa-8-azaspiro[4.5]decan-8-yl)quinolin-3-yl)methanone, TFA (37)
Step 1. To a mixture of 4-chloro-6-fluoroquinoline-3-carboxylic acid (16a, 451 mg, 2 mmol), cyclopropyl(piperazin-1-yl)methanone, HCl (477 mg, 2.50 mmol), and HATU (951 mg, 2.50 mmol) were added DMF (5 mL) and then Hunig’s base (1.40 mL, 8.0 mmol). The mixture was stirred at rt for 1.5 h. The mixture was poured into EtOAc/H2O (50 mL/50 mL). The organic layer was washed with H2O (50 mL), dried (Na2SO4), and filtered. After removal of solvent, the product was purified by silica gel chromatography using 0–10% MeOH/EtOAc as the eluent to give (4-chloro-6-fluoroquinolin-3-yl)(4-(cyclopropanecarbonyl)piperazin-1-yl)methanone (625 mg, 1.727 mmol, 86% yield). LC–MS (method 1): tR = 2.99 min, m/z (M + H)+ = 362.
Step 2. In a microwave tube was placed (4-chloro-6-fluoroquinolin-3-yl)(4-(cyclopropanecarbonyl)piperazin-1-yl)methanone (17, 18.1 mg, 0.05 mmol) and 1-oxa-8-azaspiro[4.5]decane, HCl (53.3 mg, 0.30 mmol). Then, DMF (1 mL) and Hunig’s base (0.085 mL, 0.5 mmol) were added. The tube was sealed and heated at 160 °C for 1 h under microwave irradiation. After cooling to rt, the mixture was filtered and submitted for purification by semipreparative HPLC to give (4-(cyclopropanecarbonyl)piperazin-1-yl)(6-fluoro-4-(1-oxa-8-azaspiro[4.5]decan-8-yl)quinolin-3-yl)methanone, TFA (26.3 mg, 0.045 mmol, 91% yield). 1H NMR (400 MHz, DMSO-d6) δ 8.64 (s, 1H), 8.05 (dd, J = 9.1, 5.4 Hz, 1H), 7.83–7.69 (m, 2H), 4.34–2.96 (m, 14H), 2.09–1.57 (m, 9H), 0.74 (d, J = 4.5 Hz, 4H). LC–MS (method 2): tR = 3.82 min, m/z (M + H)+= 467. HRMS calculated for C26H32FN4O3 (M + H)+: 467.2453; found, 467.2447.
4-Methyl-1-(5-(4-(methylsulfonyl)piperazine-1-carbonyl)thieno[2,3-b]pyridin-4-yl)piperidine-4-carbonitrile, TFA (66)
Step 1. Synthesis of Ethyl 4-(4-cyano-4-methylpiperidin-1-yl)thieno[2,3-b]pyridine-5-carboxylate. In a microwave vial was placed ethyl 4-chlorothieno[2,3-b]pyridine-5-carboxylate (22a, 242 mg, 1.0 mmol) and 4-methylpiperidine-4-carbonitrile, HCl (241 mg, 1.50 mmol). Then EtOH (3 mL) and Hunig’s base (0.524 mL, 3.0 mmol) were added sequentially. The tube was sealed and heated at 80 °C overnight. After cooling to rt, the mixture was concentrated and purified by silica gel chromatography using 10–40% EtOAc/hexane as the eluent to give ethyl 4-(4-cyano-4-methylpiperidin-1-yl)thieno[2,3-b]pyridine-5-carboxylate (325 mg, 0.987 mmol, 99% yield). LC–MS (method 1): tR = 3.15 min, m/z (M + H)+ = 330.
Step 2. Synthesis of 4-(4-Cyano-4-methylpiperidin-1-yl)thieno[2,3-b]pyridine-5-carboxylic acid. To a suspension of ethyl 4-(4-cyano-4-methylpiperidin-1-yl)thieno[2,3-b]pyridine-5-carboxylate (325 mg, 0.987 mmol) in THF (5 mL)/MeOH (1 mL) was added NaOH(aq) (1 N, 4 mL) and stirred at 50 °C for overnight. The mixture was added with 1 N HCl(aq) until the pH of aqueous layer is about 4. The mixture was concentrated to remove most of the solvent. The resulting solid was triturated with small amount of H2O (1 mL × 3), hexane (5 mL × 2) and then dried to give 4-(4-cyano-4-methylpiperidin-1-yl)thieno[2,3-b]pyridine-5-carboxylic acid (270 mg, 0.896 mmol, 91% yield). This material was used for next step without further purification.
Step 3. Synthesis of 4-Methyl-1-(5-(4-(methylsulfonyl)piperazine-1-carbonyl)thieno[2,3-b]pyridin-4-yl)piperidine-4-carbonitrile, TFA (66). To a mixture of 4-(4-cyano-4-methylpiperidin-1-yl)thieno[2,3-b]pyridine-5-carboxylic acid (15.1 mg, 0.05 mmol), 1-(methylsulfonyl)piperazine (24.6 mg, 0.15 mmol), and HATU (76 mg, 0.20 mmol) were added DMF (1 mL) and then Hunig’s base (0.052 mL, 0.30 mmol). The mixture was stirred at rt for 2 h. The mixture was filtered and submitted for purification by semipreparative HPLC to give 4-methyl-1-(5-(4-(methylsulfonyl)piperazine-1-carbonyl)thieno[2,3-b]pyridin-4-yl)piperidine-4-carbonitrile, TFA (8 mg, 0.014 mmol, 29% yield). 1H NMR (400 MHz, DMSO-d6) δ 8.21 (s, 1H), 7.79 (d, J = 6.1 Hz, 1H), 7.41 (d, J = 6.1 Hz, 1H), 4.03–2.99 (m, 12H), 2.88 (s, 3H), 2.02–1.59 (m, 4H), 1.40 (s, 3H). LC–MS (method 2): tR = 3.86 min, m/z (M + H)+ = 448. HRMS calculated for C20H26N5O3S2 (M + H)+: 448.1472; found, 448.1483.
1-(6-Fluoro-3-(4-(methylsulfonyl)piperazine-1-carbonyl)quinolin-4-yl)piperidine-4-carbonitrile, TFA (84)
Compound 84 was prepared from 18a and 4-cyanopiperidine following the similar procedure as described in the synthesis of 37 (step 2). 1H NMR (400 MHz, DMSO-d6) δ 8.60 (s, 1H), 8.13–7.93 (m, 1H), 7.80–7.62 (m, 2H), 3.92 (dt, J = 13.3, 4.7 Hz, 1H), 3.63 (ddd, J = 12.5, 7.3, 3.9 Hz, 1H), 3.54–3.34 (m, 2H), 3.32–2.94 (m, 9H), 2.91 (s, 3H), 2.20–1.83 (m, 4H). LC–MS (method 2): tR = 3.26 min, m/z (M + H)+= 446. HRMS calculated for C21H25FN5O3S (M + H)+: 446.1657; found, 446.1669.
1-(6-Fluoro-3-(4-(methylsulfonyl)piperazine-1-carbonyl)quinolin-4-yl)-4-phenylpiperidine-4-carbonitrile, TFA (86)
Compound 86 was prepared from 18a and 4-cyano-4-phenylpiperidine following the similar procedure as described in the synthesis of 37 (step 2). 1H NMR (400 MHz, DMSO-d6) δ 8.63 (d, J = 3.4 Hz, 1H), 8.07 (dd, J = 9.2, 5.5 Hz, 1H), 7.89 (dd, J = 10.2, 2.8 Hz, 1H), 7.73 (td, J = 8.8, 2.8 Hz, 1H), 7.69–7.62 (m, 2H), 7.52–7.43 (m, 2H), 7.43–7.35 (m, 1H), 3.96–2.97 (m, 12H), 2.90 (s, 3H), 2.57–2.21 (m, 4H). LC–MS (method 2): tR = 4.44 min, m/z (M + H)+ = 522. HRMS calculated for C27H29FN5O3S (M + H)+: 522.1970; found, 522.1971.
(4-(4,4-Dimethylcyclohex-1-en-1-yl)-6-fluoroquinolin-3-yl)(4-(methylsulfonyl)piperazin-1-yl)methanone, TFA (88)
In a 2-neck flask was placed (4-bromo-6-fluoroquinolin-3-yl)(4-(methylsulfonyl)piperazin-1-yl)methanone (18b, 20.8 mg, 0.05 mmol), 2-(4,4-dimethylcyclohex-1-en-1-yl)-4,4,5,5-tetramethyl-1,3,2-dioxaborolane (23.62 mg, 0.10 mmol), PdCl2(dppf)–CH2Cl2 adduct (8.17 mg, 10.0 μmol), and K2CO3 (69.1 mg, 0.50 mmol). The air was removed and refilled with N2 (3 times). Then, a mixture of 1,4-dioxane (1 mL)/water (0.5 mL) was added and stirred at 90 °C (preheated) for 1 h. The organic layer was separated and filtered through a PL-thiol MP-resin and then eluted with EtOAc. After removal of solvent, the crude product dissolved in DMF, filtered, and submitted for purification by semipreparative HPLC to give (4-(4,4-dimethylcyclohex-1-en-1-yl)-6-fluoroquinolin-3-yl)(4-(methylsulfonyl)piperazin-1-yl)methanone, TFA (2.3 mg, 4.11 μmol, 8.2% yield). 1H NMR (400 MHz, DMSO-d6) δ 8.75 (s, 1H), 8.13 (dd, J = 9.2, 5.6 Hz, 1H), 7.72 (ddd, J = 9.3, 8.3, 2.9 Hz, 1H), 7.57–7.41 (m, 1H), 5.66 (t, J = 3.7 Hz, 1H), 4.00–2.92 (m, 8H), 2.89 (s, 3H), 2.37–1.28 (m, 6H), 1.01 (s, 3H), 0.93 (s, 3H). LC–MS (method 2): tR = 5.44 min, m/z (M + H)+ = 446. HRMS calculated for C23H28FN3O3SNa (M + Na)+: 468.1728; found, 468.1731.
1-(4-(6-Fluoro-3-(4-(methylsulfonyl)piperazine-1-carbonyl)quinolin-4-yl)phenyl)cyclopropanecarbonitrile, TFA (91)
Compound 91 was prepared from 18b and (4-(1-cyanocyclopropyl)phenyl)boronic acid following the similar procedure as described in the synthesis of 88. 1H NMR (400 MHz, DMSO-d6) δ 8.85 (s, 1H), 8.21 (dd, J = 9.2, 5.6 Hz, 1H), 7.77 (ddd, J = 9.3, 8.2, 2.9 Hz, 1H), 7.57 (d, J = 8.3 Hz, 1H), 7.53 (d, J = 8.1 Hz, 1H), 7.46 (d, J = 8.3 Hz, 1H), 7.38 (d, J = 8.1 Hz, 1H), 7.28 (dd, J = 10.2, 2.8 Hz, 1H), 3.67–2.86 (m, 6H), 2.75 (s, 3H), 2.53 (d, J = 9.0 Hz, 1H), 2.09 (d, J = 9.4 Hz, 1H), 1.82 (q, J = 4.1 Hz, 2H), 1.67–1.58 (m, 2H). LC–MS (method 2): tR = 4.71 min, m/z (M + H)+ = 479. HRMS calculated for C25H24FN4O3S (M + H)+: 479.1548; found, 479.1562.
4-(4-(4-(1-Cyanocyclopropyl)phenyl)-6-fluoroquinoline-3-carbonyl)-N,N-dimethylpiperazine-1-sulfonamide, TFA (117)
Step 1. In a 2-neck flask was placed ethyl 4-bromo-6-fluoroquinoline-3-carboxylate (852 mg, 2 mmol), (4-(1-cyanocyclopropyl)phenyl)boronic acid (468 mg, 2.50 mmol), PdCl2(dppf)–CH2Cl2 adduct (163 mg, 0.20 mmol), and K2CO3 (829 mg, 6.0 mmol). The air was removed and refilled with N2 (3 times). Then, a mixture of 1,4-dioxane (6 mL)/water (3 mL) was added and stirred at 95 °C (preheated) for 2 h. The organic layer was separated and the aqueous layer was extracted with EtOAc (5 mL × 2). The combined organic layer was dried (Na2SO4) and filtered. After removal of solvent, the product was purified by silica gel chromatography using 20–50% EtOAc/hexane as the eluent to give ethyl 4-(4-(1-cyanocyclopropyl)phenyl)-6-fluoroquinoline-3-carboxylate (526 mg, 1.46 mmol, 73% yield). LC–MS (method 1): tR = 3.61 min, m/z (M + H)+ = 361.
Step 2. To a solution of ethyl 4-(4-(1-cyanocyclopropyl)phenyl)-6-fluoroquinoline-3-carboxylate (20a, 526 mg, 1.46 mmol) in THF (9 mL)/MeOH (1 mL) was added 1 N NaOH(aq) (6 mL, 6 mmol). The mixture was then heated at 50 °C for 2 h. After cooling to rt, 1 N HCl(aq) was added until the pH of water layer is about 3. Then, hexane (20 mL) was added and the solid was filtered, triturated with small amount of water (2 mL × 2), hexane (5 mL), and then dried to give 4-(4-(1-cyanocyclopropyl)phenyl)-6-fluoroquinoline-3-carboxylic acid (463 mg, 1.4 mmol, 95% yield) as a solid. LC–MS (method 1): tR = 3.21 min, m/z (M + H)+= 333.
Step 3. To a mixture of 4-(4-(1-cyanocyclopropyl)phenyl)-6-fluoroquinoline-3-carboxylic acid (16.6 mg, 0.05 mmol), N,N-dimethylpiperazine-1-sulfonamide (29.0 mg, 0.15 mmol), and HATU (76 mg, 0.20 mmol) were added DMF (2 mL) and then Hunig’s base (0.087 mL, 0.50 mmol). The mixture was stirred at rt for 1.5 h. The mixture was filtered and submitted for purification by semipreparative HPLC to give 4-(4-(4-(1-cyanocyclopropyl)phenyl)-6-fluoroquinoline-3-carbonyl)-N,N-dimethylpiperazine-1-sulfonamide, TFA (12.3 mg, 0.02 mmol, 40% yield). 1H NMR (400 MHz, DMSO-d6) δ 8.85 (s, 1H), 8.20 (dd, J = 9.3, 5.6 Hz, 1H), 7.77 (ddd, J = 9.3, 8.2, 2.9 Hz, 1H), 7.57–7.52 (m, 2H), 7.47 (d, J = 8.2 Hz, 1H), 7.39 (d, J = 8.1 Hz, 1H), 7.29 (dd, J = 10.2, 2.8 Hz, 1H), 3.66 (d, J = 12.6 Hz, 1H), 3.33–2.93 (m, 5H), 2.68 (s, 6H), 2.52 (t, J = 9.0 Hz, 1H), 2.08 (t, J = 8.7 Hz, 1H), 1.85–1.82 (m, 2H), 1.66–1.52 (m, 2H). LC–MS (method 2): tR = 5.00 min, m/z (M + H)+ = 508. HRMS calculated for C26H27FN5O3S (M + H)+: 508.1813; found, 508.1838.
Biological Methods. Protein Expression and Activity Measurement
Human ALDH1A1 and ALDH3A1 were expressed and purified as described elsewhere.45,46 Human ALDH2 was purchased from Abcam (Cambridge, MA). Human ALDH1A2 and ALDH1A3 were purchased from MyBioSource (MBS1005929; San Diego, CA) and ThermoFisher (11636H07E50), respectively.
ALDH Enzymatic Assays
The inhibitory activity against ALDH1A1, ALDH1A2, ALDH1A3, ALDH2, ALDH3A1 was measured according protocols described previously.23,25
Aldefluor Cell-Based Assays
The inhibitory activity in MIA PaCa-2, HT-29, and OV-90 cell lines was measured according protocols described previously.25
Dehydrogenase Selectivity Assays
The inhibitory activity against dehydrogenases HPGD and HSD17β4 was measured according protocols described previously.26
High-Throughput RLM Measurement
The rat liver microsomal stability (RLM) was measured according protocol described previously.23
Cell Lines and Culture Conditions
MIA PaCa-2, HT-29, OV-90, and SKOV-3 cells were obtained from America Type Culture Collection (ATCC, Manassas, VA; no. CRL-1420, HTB-38, CRL-11732, and HTB-77, respectively). SKOV-3-paclitaxel resistant (SKOV-3-TR) cell line was a kind gift from Dr. Hilary Kenny (University of Chicago). KB-8-5-11 and KB-3-1 cell lines were a kind gift of Dr. Michael Gottesman (NCI/NIH). It is important to note that KB cells are actually indistinguishable from HeLa cells by STR profiling and are considered a derivative of HeLa cells. MIA PaCa-2 and HT-29 cells were cultured as previously described.25 SKOV-3 and SKOV-3-TR were cultured in McCoy’s 5A containing l-glutamine (Life Technologies, Carlsbad, CA), supplemented with 10% HyClone fetal bovine serum (FBS, GE Healthcare, Piscataway, NJ) and 1% penicillin–streptomycin (Life Technologies). OV-90 cells cultured in monolayers (2D) were grown in a 1:1 mixture of MCDB 105 medium (Cell Applications Inc., San Diego, CA) and M199 medium (HyClone, GE), supplemented with 15% FBS, 1% penicillin–streptomycin (Life Technologies), and a final concentration of 1.85 g/L sodium bicarbonate (HyClone, GE). OV-90 cells cultured in spheroids (3D) were grown in DMEM/F12 + GlutaMAX medium (ATCC), supplemented with 1% penicillin–streptomycin, 0.4% BSA (Sigma-Aldrich, St. Louis, MO), 10 ng/mL rhbFGF (STEMCELL Technologies, Vancouver, Canada), 20 ng/mL rhEGF (STEMCELL Technologies), 1× insulin-transferrin-selenium-A (ThermoFisher, Carlsbad, CA) and 1% knockout serum replacement (ThermoFisher). KB-8-5-11 and KB-3-1 were cultured in DMEM supplemented with 4.5 g/L glucose, 110 mg/L sodium pyruvate, 10% FBS, and 1% penicillin–streptomycin. KB-8-5-11 cells were supplemented with 100 ng/mL colchicine to maintain P-gp expression. All cell lines were maintained at 37 °C, 5% CO2, 85% RH, routinely tested for mycoplasma contamination, and authenticated by short tandem repeat (STR) profiling.
Cell Viability in 2D vs 3D OV-90 Cultures
OV-90 cells grown in monolayers were harvested and dispensed into 384-well, white, TC-treated plates (Corning) at a density of 3000 cells/well in a volume of 40 μL of growth media/well using a Multidrop Combi dispenser (ThermoFisher). Plates were incubated ∼5 h to allow cell attachment. Compound and control solutions (184 nL) were transferred using a Wako pintool. For viability assays in 3D, OV-90 spheroids were harvested and dissociated to a single cell suspension using trypsin and plated and treated as above with the exception that compound solutions were added immediately after plating. Plates were covered with a breathable seal (Diversified Biotech, Dedham, MA) and incubated for 6 days at 37 °C, 5% CO2, 85% RH followed by addition of 30 μL of either CellTiter-Glo or CellTiter-Glo 3D (2D and 3D, respectively; Promega, Madison, WI). After a ∼30 min incubation at rt, samples were analyzed for luminescence intensity using a ViewLux high-throughput CCD imager equipped with clear filters. Compounds were tested as 16-point dilution series, with concentrations ranging from 46 μM to 0.11 μM, in triplicate. Data were normalized to positive control bortezomib (1.5 μM final) and neutral control DMSO.
ALDH1A1 Inhibitor and Paclitaxel Combination Studies in SKOV-3-TR Cells. Cell Viability Assays
Cells were harvested, and an equal volume of first compound (ALDH1A1 inhibitor or paclitaxel (Taxol)) at the indicated concentration or vehicle DMSO (final DMSO concentration was the same in all conditions) was added to the cell suspension before dispensing. Cells were dispensed into 384-well, white, TC-treated plates (Corning) at a density of 3000 cells/well in a volume of 30 μL of growth media/well using a Multidrop Combi dispenser (ThermoFisher). Immediately after dispensing, the second compound (ALDH1A1 inhibitor or paclitaxel) and control solutions (92 nL) were transferred using a Wako pintool. Plates were covered with a breathable seal (Diversified Biotech, Dedham, MA) and incubated for 4 days at 37 °C, 5% CO2, 85% RH followed by addition of 20 μL of CellTiter-Glo (Promega). After a ∼30 min incubation at rt, samples were analyzed for luminescence intensity using a ViewLux high-throughput CCD imager equipped with clear filters. Pinned compounds were tested as 16-point dilution series, with concentrations ranging from 30.7 μM to 70.1 nM for ALDH1A1 inhibitors or 31.7 μM to 0.034 nM for paclitaxel, in triplicate. Data were normalized to positive control bortezomib (1 μM final) and neutral control DMSO.
Mitosis Analysis
Cells were harvested and dispensed into 96-well, black, clear bottom plates (PerkinElmer) at a density of 8000 cells/well in a volume of 90 μL. Plates were incubated at 37 °C for 5 h to allow cell attachment. Cells were subsequently treated with 10 μL of media containing either DMSO or the indicated compounds at a 10× the final concentration (the DMSO concentration was kept constant in all conditions). Each condition was tested in quadruplicate. Plates were incubated overnight at 37 °C, 5% CO2, 85% RH followed by addition of Hoechst 33342 (DAPI) (ThermoFisher) at a final concentration of 2 μg/mL. Cells were imaged on an IN Cell 2200 (GE Healthcare) automated wide-field, high-content imager using a 20×/0.75 NA objective lens. Six fields of view per well were captured using standard DAPI excitation and emission filters with a 0.160 ms exposure time and 1× binning with 100% LED/SSI excitation. An automated image analysis routine was assembled in the Columbus Image Analysis Building Blocks interface (Columbus Image Server Software v2.8, PerkinElmer). Briefly, the analysis routine automatically segmented the individual nuclei using the DAPI channel micrograph and then measured shape and intensity of each nucleus. Manual inspection of histogram data from individual cells set the selection thresholds for phenotypes that correspond closely to the “mitotic plate stage” of cell division: cells exhibiting compact area, high integrated nuclei dye intensity, and oblong nuclear morphology. The percentage of the “mitotic plate stage” cells was output after normalization to the total number of nuclei segmented per well.
Apoptosis Analysis
Cells were harvested and dispensed into 96-well, black, clear bottom plates (PerkinElmer) at a density of 8000 cells/well in a volume of 90 μL. Plates were incubated at 37 °C for 5 h to allow cell attachment. Cells were subsequently treated with 10 μL of media containing either DMSO or 10× of the indicated compounds (the final DMSO concentration was kept constant in all conditions). CellEvent caspase-3/7 Green detection reagent (5 μM final; ThermoFisher) and nuclear violet dye (1 μM final; AAT-Bioquest) were added before imaging on an Opera Phenix automated confocal high-content imager (PerkinElmer) using a 20×/0.4 NA objective lens and 2× camera binning. One field of view per well was captured using standard DAPI and FITC excitation and emission lasers and filters, respectively. DAPI exposure was 0.100 ms with 25% laser power and FITC was 0.05 ms with 25% laser power. Plates were imaged every 2 h for 70 h under constant 37 °C and 5% CO2 conditions. Images were analyzed using PE Harmony software as follows: Nuclei were identified from the DAPI channel, and FITC intensity (the apoptotic marker) within the nuclear region of interest was quantitated. Objects with a FITC intensity greater than 450 RFU were selected as “apoptotic positive”, and percent apoptotic positive was determined by dividing the number of apoptotic positive/total DAPI nuclei at each time point.
ALDH1A1 Inhibitor and P-gp Substrate Combination Studies
P-gp expressing KB-8-5-11 cells and their wild-type counterpart K8-3-5 cells were harvested, and an equal volume of ALDH1A1 inhibitor (3 μM final), P-gp inhibitor Tariquidar (1 μM final), or vehicle DMSO was added (final DMSO concentration was the same in all conditions) to the cell suspension before dispensing. Cells were dispensed into 1536-well, white, TC-treated plates (Corning) at a density of 500 cells/well in a volume of 5 μL of growth media/well using a Multidrop Combi dispenser (ThermoFisher). Immediately after dispensing, 23 nL of P-gp substrate (paclitaxel or vincristine) and control solutions were transferred using a Wako pintool. Pinned compounds were tested as 11-point dilution series, with concentrations ranging from 45.8 μM to 0.77 nM for paclitaxel and from 30.2 μM to 0.50 nM for vincristine, in triplicate. Data were normalized to positive control bortezomib (9 μM final) and neutral control DMSO. Plates were incubated for 72 h at 37 °C, 5% CO2, 85% RH followed by addition of 3 μL/well of CellTiter-Glo. After a ∼30 min incubation at rt, samples were analyzed for luminescence intensity using a ViewLux high-throughput CCD imager equipped with clear filters.
CETSA: OV-90 ALDH1A1 Thermal Melt
The cellular thermal shift assay and the isothermal dose response were run as previously described.28 Briefly, OV-90 cells were dispensed into Eppendorf tubes (1.5 mL) at a density of ∼10 000 000 cells/tube in 1 mL of DMEM (without phenol red, Life Technologies, catalog no. 31053) supplemented with 4.5 g/L of glucose and 100 units/mL penicillin, 100 μg/mL streptomycin. The cell suspension was incubated with DMSO at 0.5% (to simulate compound treatment) for 1 h at 37 °C, 5% CO2, and 85% RH. After incubation, the cell mixture was inverted several times and left to cool to room temperature. Next, a wash step was performed, with tubes centrifuged at 200g for 5 min to form a cell pellet, followed by aspiration of the supernatant, and replaced with ∼1 mL of the above DMEM to resuspend the cells.
OV-90 cells were then transferred to thin-walled PCR tubes (0.2 mL, catalog no. Thermo AB-0266) at a density of ∼1 000 000 cells/tube in 100 μL of DMEM. Cells were subjected to 3 min of heat in 96-well thermal cycler (Veriti, Applied Biosystems) at temperatures of 37, 66, 68, 70, 72, 74, and 76 °C. After heating, cells were left to cool for 3 min and then snap frozen in a CoolSafe Chamber (USA Scientific) surrounded by dry ice. Cells were subjected to 3 rapid freeze thaws with 15 s of vortexing after each thaw. Cell lysates were centrifuged at 20 000g for 10 min to separate the soluble fractions from precipitates and the supernatant was transferred (∼90 μL) to a 96-well plate (Corning catalog no. 3359) and stored at −80 °C until analysis.
Samples were prepared for gel electrophoresis and Western blot analysis by transferring 30 μL of the cell lysate supernatant and mixing with 30 μL of 2× sample loading buffer (NuPAGE LDS sample buffer and sample reducing agent, catalog nos. NP0007 and NP0009, respectively) into 0.2 mL of PCR tubes, heated for 10 min at 90 °C (Veriti, Applied Biosystems), followed by centrifugation at 2000g (4 °C) for 4 min. Samples were separated on a NuPAGE Novex 4–12% Bis-Tris gel with 1× antioxidant (NuPAGE catalog no. NP0005) for 45 min at 150 V and transferred to a nitrocellulose membrane using an iBlot 2 dry blotting system (setting P0; Life Technologies). Membranes were blocked for 1 h with 5% milk in PBST (phosphate-buffered saline, pH 7.4, with 0.5% Tween 20) before being incubated at 4 °C overnight with 1:1000 of mouse monoclonal anti-ALDH1 (BD Biosciences catalog no. 611194) and 1:20 000 of rabbit polyclonal anti-SOD1 (SIGMA catalog no. HPA001401) in 5% milk PBST. Blots were washed three times in 5% milk PBST and incubated with 1:10 000 anti-mouse or anti-rabbit HRP linked IgG (Cell Signaling catalog nos. 7076 and 7074, respectively) for 1 h at room temperature. Blots were imaged after washing three times and incubation with SuperSignal West Dura extended duration substrate (ThermoFisher catalog no. 34076) on a Bio-Rad Universal Hood II. Protein quantification was performed using ImageQuant TL (GE Healthcare) and melting curve analysis was performed using Prism (GraphPad Software).
CETSA: Isothermal Dose Response of ALDH1A1 Inhibitors
OV-90 cells were dispensed (∼90 μL) into thin-walled PCR tubes as described above with the addition of 10 μL of ALDH1A1 inhibitors (prepared as an intermediate mixture at 5% DMSO) for a final 7-point concentration range of 50 μM to 0.686 μM (0.5% DMSO final assay concentration). Samples were incubated at 37 °C, 5% CO2, 85% RH for 1 h, then inverted several times and left to cool to room temperature. Next, a wash step was performed to remove unbound compound from the solution, with tubes centrifuged at 200g for 5 min to from a cell pellet, followed by aspiration of the supernatant, and replaced with ∼90 μL of DMEM (no phenol red) to resuspend the cells. The cell mixtures were then subjected to 3 min of heat in 96-well thermal cycler at a temperature of 70 °C. Samples were lysed, separated, and analyzed as described above.
Use of Animals
All animal experiments performed in the manuscript were conducted in compliance with institutional (NIH) guidelines (Guide for the Care and Use of Laboratory Animals, 8th ed.; National Academies Press (U.S.), 2011). The PK protocols for each study were approved by NIH Division of Veterinary Resources (DVR) ACUC.
Acknowledgments
S.-M.Y., N.J.M., A.Y., C.D., Y.W., B.B., A.Q.W., X.X., P.S., D.C., X.S.W., J.R., M.L.-N., A.S., A.J., and D.J.M. were supported by the intramural research program of the National Center for Advancing Translational Sciences (NCATS). The authors thank Paul Shinn, Danielle van Leer, Crystal McKnight, Zina Itkin, and Misha Itkin for the assistance with compound management; Heather Baker, Elizabeth Fernandez, Yuhong Fang, Christopher Leclair, and William Leister for analytical chemistry and purification support; Dingyin Tao for HRMS determination; Kimloan Nguyen and Katherine Yu for RLM testing; Emma Hughes for preparing PK plasma samples; Hongmao Sun for informatics support; Matthew Hall for supporting P-gp assays; and Juan Marugan for grateful discussions. The authors are grateful to Dr. Hilary Kenny (University of Chicago) for a very kind gift of SKOV-3-paclitaxel resistant (SKOV-3-TR) cell line and to Dr. Michael Gottesman (NCI/NIH) for a very kind gift of KB-8-5-11 and KB-3-1 cell lines. This research was supported in part by National Institutes of Health Grants AA022057 (V.V.) and AA021724 (V.V.). This research was also supported in part by Arthritis Research UK (program grant 20522), Cancer Research UK, and the Rosetrees Foundation (U.O.).
Glossary
Abbreviations Used
- ADME
absorption, distribution, metabolism, and excretion
- ALDH
aldehyde dehydrogenase
- AUC
area under the plasma concentration–time curve
- CETSA
cellular thermal shift assay
- CSC
cancer stem cell
- HP-β-CD
hydroxypropyl β-cyclodextrin
- HPGD
15-hydroxyprostaglandin dehydrogenase
- HSD17β4
type-4 hydroxysteroid dehydrogenase
- OC
ovarian cancer
- PK
pharmacokinetics
- PAMPA
parallel artificial membrane permeability assay
- qHTS
quantitative high throughput screening
- RLM
rat liver microsomal
- SAR
structure–activity relationship
Supporting Information Available
The Supporting Information is available free of charge on the ACS Publications website at DOI: 10.1021/acs.jmedchem.8b00270.
Author Present Address
∥ D.J.M.: Nexus Discovery Advisors, LLC, 7820B Wormans Mill Road, Suite 208, Frederick, MD 21701.
The authors declare no competing financial interest.
Supplementary Material
References
- Black W.; Vasiliou V. The aldehyde dehydrogenase gene superfamily resource center. Hum. Genomics 2009, 4, 136–142. 10.1186/1479-7364-4-2-136. [DOI] [PMC free article] [PubMed] [Google Scholar]
- Marchitti S. A.; Brocker C.; Stagos D.; Vasiliou V. Non-P450 aldehyde oxidizing enzymes: the aldehyde dehydrogenase superfamily. Expert Opin. Drug Metab. Toxicol. 2008, 4, 697–720. 10.1517/17425255.4.6.697. [DOI] [PMC free article] [PubMed] [Google Scholar]
- Rizzo W. B.; Carney G. Sjögren-Larsson syndrome: diversity of mutations and polymorphisms in the fatty aldehyde dehydrogenase gene (ALDH3A2). Hum. Mutat. 2005, 26, 1–10. 10.1002/humu.20181. [DOI] [PubMed] [Google Scholar]
- Marchitti S. A.; Deitrich R. A.; Vasiliou V. Neurotoxicity and metabolism of the catecholamine-derived 3,4-dihydroxyphenylacetaldehyde and 3,4-dihydroxyphenylglycolaldehyde: The dole of aldehyde dehydrogenase. Pharmacol. Rev. 2007, 59, 125–150. 10.1124/pr.59.2.1. [DOI] [PubMed] [Google Scholar]
- Smith C.; Gasparetto M.; Jordan C.; Pollyea D. A.; Vasiliou V. The effects of alcohol and aldehyde dehydrogenases on disorders of hematopoiesis. Adv. Exp. Med. Biol. 2015, 815, 349–360. 10.1007/978-3-319-09614-8_20. [DOI] [PubMed] [Google Scholar]
- Ma I.; Allan A. L. The role of human aldehyde dehydrogenase in normal and cancer stem cells. Stem Cell Rev. Rep. 2011, 7, 292–306. 10.1007/s12015-010-9208-4. [DOI] [PubMed] [Google Scholar]
- Tanei T.; Morimoto K.; Shimazu K.; Kim S. J.; Tanji Y.; Taguchi T.; Tamaki Y.; Noguchi S. Association of breast cancer stem cells identified by aldehyde dehydrogenase 1 expression with resistance to sequential paclitaxel and epirubicin-based chemotherapy for breast cancers. Clin. Cancer Res. 2009, 15, 4234–4241. 10.1158/1078-0432.CCR-08-1479. [DOI] [PubMed] [Google Scholar]
- Luo Y.; Dallaglio K.; Chen Y.; Robinson W. A.; Robinson S. E.; McCarter M. D.; Wang J.; Gonzalez R.; Thompson D. C.; Norris D. A.; Roop D. R.; Vasiliou V.; Fujita M. ALDH1A isozymes are markers of human melanoma stem cells and potential therapeutic targets. Stem Cells 2012, 30, 2100–2113. 10.1002/stem.1193. [DOI] [PMC free article] [PubMed] [Google Scholar]
- Vasiliou V.; Thompson D. C.; Smith C.; Fujita M.; Chen Y. Aldehyde dehydrogenases: From eye crystallins to metabolic disease and cancer stem cells. Chem.-Biol. Interact. 2013, 202, 2–10. and references cited therein 10.1016/j.cbi.2012.10.026. [DOI] [PMC free article] [PubMed] [Google Scholar]
- Yue L.; Huang Z.-M.; Fong S.; Leong S.; Jakowatz J. G.; Charruyer-Reinwald A.; Wei M.; Ghadially R. Targeting ALDH1 to decrease tumorigenicity, growth and metastasis of human melanoma. Melanoma Res. 2015, 25, 138–148. 10.1097/CMR.0000000000000144. [DOI] [PubMed] [Google Scholar]
- Kiefer F. W.; Orasanu G.; Nallamshetty S.; Brown J. D.; Wang H.; Luger P.; Qi N. R.; Burant C. F.; Duester G.; Plutzky J. Retinaldehyde dehydrogenase 1 coordinates hepatic gluconeogenesis and lipid metabolism. Endocrinology 2012, 153, 3089–3099. 10.1210/en.2011-2104. [DOI] [PMC free article] [PubMed] [Google Scholar]
- Kiefer F. W.; Vernochet C.; O’Brien P.; Spoerl S.; Brown J. D.; Nallamshetty S.; Zeyda M.; Stulnig T. M.; Cohen D. E.; Kahn C. R.; Plutzky J. Retinaldehyde dehydrogenase 1 regulates a thermogenic program in white adipose tissue. Nat. Med. 2012, 18, 918–925. 10.1038/nm.2757. [DOI] [PMC free article] [PubMed] [Google Scholar]
- Sanders T. J.; McCarthy N. E.; Giles E. M.; Davidson K. L.; Haltalli M. L.; Hazell S.; Lindsay J. O.; Stagg A. J. Increased production of retinoic acid by intestinal macrophages contributes to their inflammatory phenotype in patients with Crohn’s disease. Gastroenterology 2014, 146, 1278–1288. 10.1053/j.gastro.2014.01.057. [DOI] [PubMed] [Google Scholar]
- Haenisch M.; Treuting P. M.; Brabb T.; Goldstein A. S.; Berkseth K.; Amory J. K.; Paik J. Pharmacological inhibition of ALDH1A enzyme suppresses weight gain in a mouse model of diet-induced obesity. Obes. Res. Clin. Pract. 2018, 12, 93–101. 10.1016/j.orcp.2017.08.003. [DOI] [PMC free article] [PubMed] [Google Scholar]
- Moreb J. S. Aldehyde dehydrogenase as a marker for stem cells. Curr. Stem Cell Res. Ther. 2008, 3, 237–246. 10.2174/157488808786734006. [DOI] [PubMed] [Google Scholar]
- Marcato P.; Dean C. A.; Giacomantonio C. A.; Lee P. W. K. Aldehyde dehydrogenase: Its role as a cancer stem cell marker comes down to the specific isoform. Cell Cycle 2011, 10, 1378–1384. 10.4161/cc.10.9.15486. [DOI] [PubMed] [Google Scholar]
- For a review with early ALDH inhibitors, see the following:Koppaka V.; Thompson D. C.; Chen Y.; Ellermann M.; Nicolaou K. C.; Juvonen R. O.; Petersen D.; Deitrich R. A.; Hurley T. D.; Vasiliou V. Aldehyde dehydrogenase inhibitors: a comprehensive review of the pharmacology, mechanism of action, substrate specificity, and clinical application. Pharmacol. Rev. 2012, 64, 520–539. 10.1124/pr.111.005538. [DOI] [PMC free article] [PubMed] [Google Scholar]
- Kimble-Hill A. C.; Parajuli B.; Chen C.-H.; Mochly-Rosen D.; Hurley T. D. Development of selective inhibitors for aldehyde dehydrogenases based on substituted indole-2,3-diones. J. Med. Chem. 2014, 57, 714–722. 10.1021/jm401377v. [DOI] [PMC free article] [PubMed] [Google Scholar]
- Morgan C. A.; Hurley T. D. Development of a high-throughput in vitro assay to identify selective inhibitors for human ALDH1A1. Chem.-Biol. Interact. 2015, 234, 29–37. 10.1016/j.cbi.2014.10.028. [DOI] [PMC free article] [PubMed] [Google Scholar]
- Morgan C. A.; Hurley T. D. Characterization of two distinct structural classes of selective aldehyde dehydrogenase 1A1 inhibitors. J. Med. Chem. 2015, 58, 1964–1975. 10.1021/jm501900s. [DOI] [PMC free article] [PubMed] [Google Scholar]
- Condello S.; Morgan C. A.; Nagdas S.; Cao L.; Turek J.; Hurley T. D.; Matei D. β-Catenin-regulated ALDH1A1 is a target in ovarian cancer spheroids. Oncogene 2015, 34, 2297–2308. 10.1038/onc.2014.178. [DOI] [PMC free article] [PubMed] [Google Scholar]
- Chen C.-H.; Yang W.; Mochly-Rosen D.. Aldehyde Dehydrogenase-1 Modulators and Methods of Use Thereof. PCT Patent WO 2014160034, 2014.
- Yang S.-M.; Yasgar A.; Miller B.; Lal-Nag M.; Brimacombe K.; Hu X.; Sun H.; Wang A.; Xu X.; Nguyen K.; Oppermann U.; Ferrer M.; Vasiliou V.; Simeonov A.; Jadhav A.; Maloney D. J. Discovery of NCT-501, a potent and selective theophyllne-based inhibitor of aldehyde dehydrogenase 1A1 (ALDH1A1). J. Med. Chem. 2015, 58, 5967–5978. 10.1021/acs.jmedchem.5b00577. [DOI] [PMC free article] [PubMed] [Google Scholar]
- Kulsum S.; Sudheendra H. V.; Pandian R.; Ravindra D. R.; Siddappa G.; R N.; Chevour P.; Ramachandran B.; Sagar M.; Jayaprakash A.; Mehta A.; Kekatpure V.; Hedne N.; Kuriakose M. A.; Suresh A. Cancer stem cell mediated acquired chemoresistance in head and neck cancer can be abrogated by aldehyde dehydrogenase 1 A1 inhibition. Mol. Carcinog. 2017, 56, 694–711. 10.1002/mc.22526. [DOI] [PubMed] [Google Scholar]
- Yasgar A.; Titus S. A.; Wang Y.; Danchik C.; Yang S.-M.; Vasiliou V.; Jadhav A.; Maloney D. J.; Simeonov A.; Martinez N. J. A high-content assay enables the automated screening and identification of small molecules with specific ALDH1A1-inhibitory activity. PLoS One 2017, 12, e0170937. 10.1371/journal.pone.0170937. [DOI] [PMC free article] [PubMed] [Google Scholar]
- Duveau D. Y.; Yasgar A.; Wang Y.; Hu X.; Kouznetsova J.; Brimacombe K. R.; Jadhav A.; Simeonov A.; Thomas C. J.; Maloney D. J. Structure-activity relationship studies and biological characterization of human NAD+-dependent 15-hydroxyprostaglandin dehydrogenase inhibitors. Bioorg. Med. Chem. Lett. 2014, 24, 630–635. 10.1016/j.bmcl.2013.11.081. [DOI] [PMC free article] [PubMed] [Google Scholar]
- Molina D. M.; Jafari R.; Ignatushchenko M.; Seki T.; Larsson E. A.; Dan C.; Sreekumar L.; Cao Y.; Nordlund P. Monitoring drug target engagement in cells and tissues using the cellular thermal shift assay. Science 2013, 341, 84–87. 10.1126/science.1233606. [DOI] [PubMed] [Google Scholar]
- Jafari R.; Almqvist H.; Axelsson H.; Ignatushchenko M.; Lundbäck T.; Nordlund P.; Molina D. M. The cellular thermal shift assay for evaluating drug target interactions in cells. Nat. Protoc. 2014, 9, 2100–2122. 10.1038/nprot.2014.138. [DOI] [PubMed] [Google Scholar]
- Puiffe M.-L.; Le Page C.; Filali-Mouhim A.; Zietarska M.; Ouellet V.; Tonin P. N.; Chevrette M.; Provencher D. M.; Mes-Masson A.-M. Characterization of ovarian cancer ascites on cell invasion, proliferation, spheroid formation, and gene expression in an in vitro model of epithelial ovarian cancer. Neoplasia 2007, 9, 820–829. 10.1593/neo.07472. [DOI] [PMC free article] [PubMed] [Google Scholar]
- Singh S.; Arcaroli J.; Chen Y.; Thompson D. C.; Messersmith W.; Jimeno A.; Vasiliou V. ALDH1B1 is crucial for colon tumorigenesis by modulating Wnt/β-catenin, Notch and PI3K/Akt signaling pathways. PLoS One 2015, 10, e0121648. 10.1371/journal.pone.0121648. [DOI] [PMC free article] [PubMed] [Google Scholar]
- Zietarska M.; Maugard C. M.; Filali-Mouhim A.; Alam-Fahmy M.; Tonin P. N.; Provencher D. M.; Mes-Masson A.-M. Molecular description of a 3D in vitro model for the study of epithelial ovarian cancer (EOC). Mol. Carcinog. 2007, 46, 872–885. 10.1002/mc.20315. [DOI] [PubMed] [Google Scholar]
- Rasper M.; Schäfer A.; Piontek G.; Teufel J.; Brockhoff G.; Ringel F.; Heindl S.; Zimmer C.; Schlegel J. Aldehyde dehydrogenase 1 positive glioblastoma cells show brain tumor stem cell capacity. Neuro-Oncology 2010, 12, 1024–1033. 10.1093/neuonc/noq070. [DOI] [PMC free article] [PubMed] [Google Scholar]
- Sun Q.-L.; Sha H.-F.; Yang X.-H.; Bao G.-L.; Lu J.; Xie Y.-Y. Comparative proteomic analysis of paclitaxel sensitive A549 lung adenocarcinoma cell line and its resistant counterpart A549-Taxol. J. Cancer Res. Clin. Oncol. 2011, 137, 521–532. 10.1007/s00432-010-0913-9. [DOI] [PMC free article] [PubMed] [Google Scholar]
- Landen C. N. Jr.; Goodman B.; Katre A. A.; Steg A. D.; Nick A. M.; Stone R. L.; Miller L. D.; Mejia P. V.; Jennings N. B.; Gershenson D. M.; Bast R. C. Jr.; Coleman R. L.; Lopez-Berestein G.; Sood A. K. Targeting aldehyde dehydrogenase cancer stem cells in ovarian cancer. Mol. Cancer Ther. 2010, 9, 3186–3199. 10.1158/1535-7163.MCT-10-0563. [DOI] [PMC free article] [PubMed] [Google Scholar]
- Silva I. A.; Bai S.; McLean K.; Yang K.; Griffith K.; Thomas D.; Ginestier C.; Johnston C.; Kueck A.; Reynolds R. K.; Wicha M. S.; Buckanovich R. J. Aldehyde dehydrogenase in combination with CD133 defines angiogenic ovarian cancer stem cells that portend poor patient survival. Cancer Res. 2011, 71, 3991–4001. 10.1158/0008-5472.CAN-10-3175. [DOI] [PMC free article] [PubMed] [Google Scholar]
- Wang Y.-C.; Yo Y.-T.; Lee H.-Y.; Liao Y.-P.; Chao T.-K.; Su P.-H.; Lai H.-C. ALDH1-rright epithelial ovarian cancer cells are associated with CD44 expression, drug resistance, and poor clinical outcome. Am. J. Pathol. 2012, 180, 1159–1169. 10.1016/j.ajpath.2011.11.015. [DOI] [PubMed] [Google Scholar]
- Januchowski R.; Wojtowicz K.; Sterzyńska K.; Sosińska P.; Andrzejewska M.; Zawierucha P.; Nowicki M.; Zabel M. Inhibition of ALDH1A1 activity decreases expression of drug transporters and reduces chemotherapy resistance in ovarian cancer cell lines. Int. J. Biochem. Cell Biol. 2016, 78, 248–259. 10.1016/j.biocel.2016.07.017. [DOI] [PubMed] [Google Scholar]
- Croker A. K.; Rodriguez-Torres M.; Xia Y.; Pardhan S.; Leong H. S.; Lewis J. D.; Allan A. L. Differential functional roles of ALDH1A1 and ALDH1A3 in mediating metastatic behavior and therapy resistance of human breast cancer cells. Int. J. Mol. Sci. 2017, 18, 2039. 10.3390/ijms18102039. [DOI] [PMC free article] [PubMed] [Google Scholar]
- Wei Y.; Wu S.; Xu W.; Liang Y.; Li Y.; Zhao W.; Wu J. Depleted aldehyde dehydrogenase 1A1 (ALDH1A1) reverses cisplatin resistance of human lung adenocarcinoma cell A549/DDP. Thorac. Cancer 2017, 8, 26–32. 10.1111/1759-7714.12400. [DOI] [PMC free article] [PubMed] [Google Scholar]
- Kavallaris M. Microtubules and resistance to tubulin-binding agents. Nat. Rev. Cancer 2010, 10, 194–204. 10.1038/nrc2803. [DOI] [PubMed] [Google Scholar]
- Shen D.-W.; Fojo A.; Chin J. E.; Roninson I. B.; Richert N.; Pastan I.; Gottesman M. M. Human multidrug-resistant cell lines: increased mdrl expression can precede gene amplification. Science 1986, 232, 643–645. 10.1126/science.3457471. [DOI] [PubMed] [Google Scholar]
- In-house data indicate that 91 is not a substrate of aldehyde oxidase as the half-lives of stabilities in the presence of mouse or human liver cytosol at 37 °C were >120 min.
- In-house data indicate that 91 is stable in mouse, rat, and human liver microsomes with t1/2 > 120 min. 91 also exhibited excellent mouse plasma stability with >95% remaining after 2 h incubation.
- The enzymatic activity for representative compounds (e.g., 86 and 91) was measured using all-trans-retinal as the substrate under same assay condition. The IC50 was 19.6 and 48.5 nM (average of duplicate) for compounds 86 and 91, respectively. It was comparable to the results using propionaldehyde as the substrate. In addition, the Ki of compounds 86 and 91 was also determined and calculated using a nonlinear regression, mixed mode inhibition fitting in GraphPad Prism 7. The Ki was 26.1 nM and 23.3 nM (against varied propionaldehyde), as well as 5.5 nM and 7.2 nM (against varied NAD+) for compounds 86 and 91, respectively.
- Xiao T.; Shoeb M.; Siddiqui M. S.; Zhang M.; Ramana K. V.; Srivastava S. K.; Vasiliou V.; Ansari N. H. Molecular cloning and oxidative modification of human lens ALDH1A1: implication in impaired detoxification of lipid aldehydes. J. Toxicol. Environ. Health, Part A 2009, 72, 577–584. 10.1080/15287390802706371. [DOI] [PMC free article] [PubMed] [Google Scholar]
- Pappa A.; Estey T.; Manzer R.; Brown D.; Vasiliou V. Human aldehyde dehydrogenase 3A1 (ALDH3A1): biochemical characterization and immunohistochemical localization in the cornea. Biochem. J. 2003, 376, 615–623. 10.1042/bj20030810. [DOI] [PMC free article] [PubMed] [Google Scholar]
Associated Data
This section collects any data citations, data availability statements, or supplementary materials included in this article.


