

Abstract
Background
This study examines the accuracy of self-reported periodontal disease in a cohort of older females.
Methods
The study comprised 972 postmenopausal females aged 53 to 83 years who completed baseline (1997 to 2001) and follow-up (2002 to 2006) whole-mouth oral examinations. Examinations included: 1) probing depth, 2) clinical attachment level, and 3) oral radiographs for alveolar crestal height in a study ancillary to the Women’s Health Initiative Observational Study (WHI-OS) conducted in Buffalo, New York, called the OsteoPerio study. Participants also self-reported any history of diagnosis of periodontal/gum disease on a WHI-OS study-wide questionnaire administered during the time interval between the two OsteoPerio examinations.
Results
Participants reporting diagnosis of periodontal/gum disease on the WHI-OS questionnaire (n = 259; 26.6%) had worse oral hygiene habits, periodontal disease risk factors, and clinical periodontal measures compared with those not reporting periodontal/gum disease. Frequency of reported periodontal/gum disease was 13.5%, 24.7%, and 56.2% across OsteoPerio baseline examination categories of none/mild, moderate, and severe periodontal disease, respectively (trend: P <0.001), defined by criteria of the Centers for Disease Control and Prevention/American Academy of Periodontology (CDC/AAP). Sensitivity, specificity, and positive and negative predictive values for reported periodontal disease status were 56.2%, 78.8%, 32.8%, and 90.7%, respectively, when CDC/AAP-defined severe periodontal disease at baseline was the criterion measure (prevalence of 15%) and were 76.0%, 77.4%, 22.0%, and 97.4%, respectively, when tooth loss to periodontitis (prevalence of 7%) was the criterion.
Conclusion
A simple question for self-reported periodontal disease characterizes periodontal disease prevalence with moderate accuracy in postmenopausal females who regularly visit their dentist, particularly in those with more severe disease.
Keywords: Epidemiologic measurements, periodontal diseases, prevalence, self report, reproducibility of results, women
Prevalence of periodontal disease and endentulism is high among U.S. females and increases with age.1,2 Growing evidence suggests that periodontal disease is associated with major forms of morbidity and mortality among older adults, including: 1) coronary heart disease, 2) type 2 diabetes mellitus, 3) respiratory infections, and 4) osteoporosis.3–5 The U.S. adult population aged ≥65 years is expected to double in coming decades,6 and the burden of periodontal disease and its complications likely will be substantial. Further understanding the extent that periodontal disease contributes to systemic diseases in older females has important clinical and public health implications.
The Women’s Health Initiative Observational Study (WHI-OS)7 is an existing cohort of 93,676 postmenopausal females in which associations between periodontal disease and a number of chronic diseases can be further explored on a large scale in a cost-efficient manner. Females in the WHI-OS cohort completed extensive baseline assessments and have ongoing annual assessment of major disease outcomes. A clinical oral examination was not feasible in the WHI-OS cohort; instead, periodontal disease was assessed by questionnaire as done in other epidemiologic studies.8,9 Although the validity of self-reported periodontal disease has been examined,8 few studies have reported findings in older females. The present study examined the validity of self-reported periodontal disease status in a subsample of WHI-OS females who completed questionnaires on periodontal disease and a clinical oral examination as part of the Osteoporosis and Periodontal Disease (OsteoPerio) Study, an ancillary study to the WHI-OS conducted in the clinical center at the University at Buffalo, Buffalo, New York.
MATERIALS AND METHODS
The procedures in the OsteoPerio study have been described previously.10–13 Briefly, female participants aged 53 to 82 years were recruited and enrolled in the parent WHI-OS baseline study (1993 to 1998) at the Buffalo, New York, clinical center. The Buffalo cohort is similar to females in the larger national WHI-OS7 on enrollment characteristics, including the following: 1) age (mean: OsteoPerio, 63.4; WHI-OS, 63.6 years); 2) BMI (26.9; 27.3 kg/m2); 3) college graduate (43.3%; 42.0%); 4) history of diagnosed treated diabetes (3.3%; 4.2%) and hypertension (24.1%; 25.5%); and 5) current smoking (6.1%; 6.3%). The proportion of white females was somewhat higher in the Buffalo cohort (95.8%) than in the national WHI-OS (83.3%), but the race/ethnic representation in the Buffalo cohort reflects the relative distribution within the Greater Buffalo metropolitan area from which participants were recruited. Eligibility to enroll into the OsteoPerio baseline assessment (1997 to 2001), coinciding with year 3 in the WHI-OS, required the following: 1) having at least six teeth present; 2) no bilateral hip replacement; 3) no history of bone disease other than osteoporosis; 4) no history of cancer in the past 10 years; and 5) no other serious illness. Females with complete OsteoPerio baseline data (n = 1,341) were invited to participate in a 5-year follow-up study. Eligibility for the post-baseline follow-up study (2002 to 2006), coinciding with year 8 in the overall WHI-OS, required that, during the follow-up interval, participants did not develop cancer or immunosuppressive disorders and did not have long-term use of antibiotics or exposure to dental x-rays in the previous year. Of those eligible, 88% (n = 1,025) participated in the follow-up study. Written consent was provided for all aspects of the WHI-OS and the ancillary OsteoPerio studies, which were approved by the University at Buffalo Institutional Review Board.
Self-Reported Periodontal Disease in the WHI-OS
WHI-OS participants completed baseline questionnaires on medical and lifestyle histories and an annual questionnaire on major health outcomes. As part of the questionnaires completed at WHI-OS year 5, participants responded (yes or no) to a question on diagnosis of periodontal or gum disease as follows: “Has a dentist or dental hygienist ever told you that you had periodontal or gum disease?” The wording of this question is quite similar to case finding questions used in other epidemiologic studies,8,9 including the Veterans Affairs Dental Longitudinal Study,14 the Health Professionals Follow-Up Study,15 and the Erie County Study.16 Of the 93,676 females in the WHI-OS, 82,414 (87.9%) completed the question on periodontal disease.
Oral Examinations in the OsteoPerio Study
Trained clinicians performed oral examinations at OsteoPerio baseline and follow-up10–13 using procedures guided by National Institute of Dental and Craniofacial Research standards.17 Detailed histories were obtained on the number and reason for tooth loss, oral hygiene habits, use of dental services, and previous dental procedures and surgeries. Probing depth (PD) was measured as the distance in millimeters from the gingival margin (GM) to the base of the gingival sulcus measured using a constant-force (20 g) electronic probe18 on six surfaces per tooth in all the teeth present except for third molars. In a subset of 724 OsteoPerio females, within-examiner difference in mean ± SD PD was 0.01 ± 0.02 mm, and within-examiner coefficient of variation and intraclass correlation was 6% and 0.91, respectively, for replicate measures. A manual periodontal probe was used to measure the distance from the cemento-enamel junction (CEJ) to the GM at the same six sites per tooth, and clinical attachment level (CAL) was calculated by subtracting this distance from PD. Values for interproximal surfaces were used to calculate worst site and composite whole-mouth mean PD and CAL for analysis. Gingival bleeding on probing (absent or present) was assessed at three sites per tooth, using the manual probe inserted 2 mm into the gingival sulcus parallel to the long axis of tooth and moved in a horizontal direction, and is expressed as the percentage of sites bleeding in the whole mouth. Presence or absence of supragingival plaque was assessed at the same three sites per tooth and is expressed as the percentage of sites with supragingival plaque.
Alveolar crestal height (ACH) was measured in seven anterior periapical and four posterior vertical bitewing radiographs using a single radiographic unit according to standardized procedures developed by Hausmann et al.19,20 to enhance accuracy and resolution of ACH measures.12,13 Measurements were conducted in all teeth present except for third molars and canines (up to 24 teeth), with two sites measured per tooth. Using the digitized images, ACH was measured as the distance in millimeters from the CEJ to the most coronal part of the alveolar crest in a plane parallel to the long axis of the tooth. In a subset of 885 female OsteoPerio participants, within-examiner difference in mean ± SD ACH was 0.04 ± 0.01 mm, and within-examiner coefficient of variation and intraclass correlation was 5% and 0.98, respectively, for replicate measures. Worst site and a composite whole-mouth mean value for ACH were computed for analysis.
Periodontal disease status at baseline and follow-up was defined using a standard clinical definition based on PD and CAL criteria of the Centers for Disease Control and Prevention/American Academy of Periodontology (CDC/AAP)21 as follows: 1) none/mild: neither “moderate” nor “severe” periodontal disease; 2) moderate: ≥2 interproximal sites with CAL ≥4 mm (not on same tooth) or ≥2 interproximal sites with PD ≥5 mm (not on same tooth); 3) severe: ≥2 interproximal sites with CAL ≥6 mm (not on same tooth) and ≥1 interproximal site with PD ≥5 mm.
OsteoPerio Study Sample for Validation Analyses
Administration of the periodontal disease question within the WHI-OS occurred at year 5, which falls between the OsteoPerio baseline (WHI-OS year 3) and follow-up (WHI-OS year 8) oral examinations that include the criterion periodontal measures against which self-reported periodontal disease status will be compared. Because completion of the self-reported periodontal disease assessment does not align with either of the OsteoPerio clinical examinations, criterion periodontal measures from both OsteoPerio time points was used to obtain the broadest sense of self-report validity. As such, the present analysis includes 972 OsteoPerio participants who responded to the year 5 WHI-OS periodontal disease question and also had complete clinical periodontal measures at OsteoPerio baseline and follow-up. Figure 1 is an overview flowchart of the time sequence and numbers of participants included in the present study. A subset of 945 females also provided responses (yes or no) at their OsteoPerio baseline visit (concurrent with their oral examination) to a question on history of gum surgery or tooth extraction because of gum disease. The accuracy of responses to this question was examined to further understand the validity of self-reported periodontal disease status in the present cohort.
Figure 1.
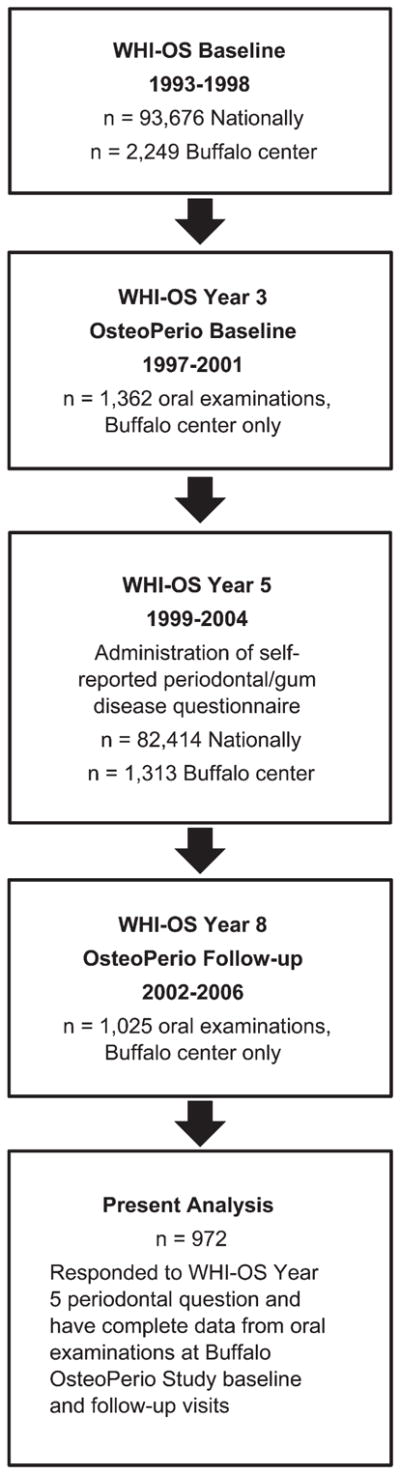
Temporal sequence of participant enrollment and measures for the present study examining accuracy of self-reported periodontal disease in the WHI-OS.
Statistical Analyses
Differences in participant characteristics and clinical periodontal measures according to self-reported periodontal disease were examined using χ2 tests for proportions and independent t tests or Mann–Whitney U tests of mean differences for continuous variables. Sensitivity, specificity, predictive values, κ coefficients, and their 95% confidence intervals (CIs) were computed for self-reported history of periodontal disease (yes or no) and for self-reported history of surgery/tooth extraction attributable to gum disease (yes or no) cross-tabulated with criterion periodontal disease status defined discretely using threshold values for several of the available oral examination measures. Likelihood ratio positive (LR+) and negative (LR−) values, which are not as sensitive to disease prevalence, were also evaluated. Stratified analysis of the primary results was performed to determine consistency of findings according to cohort subgroups (age, education level, smoking status) in which opportunity for, or recall of, periodontal disease diagnosis could differ. Analyses were completed using statistical software,§ and P values are two-sided at α = 0.05.
RESULTS
The majority of participants are white with college education, and greater than half the study group was aged ≥65 years at both examinations (Table 1). Overweight or obesity (BMI ≥25) was quite prevalent, whereas the proportion of current smokers and of diagnosed diabetes was relatively low at each study time point.
Table 1.
Participant Characteristics at OsteoPerio Study Baseline and Follow-Up Examinations (n = 972)
| Characteristic | Baseline OsteoPerio (1997 to 2001) | Follow-Up OsteoPerio (2002 to 2006) |
|---|---|---|
| Age (years), mean ± SD | 65.7 ± 6.6 | 70.2 ± 6.7 |
| <65 | 479 (49.3) | 212 (21.8) |
| ≥65 | 493 (50.7) | 760 (78.2) |
|
| ||
| BMI (kg/m2), mean ± SD | 26.5 ± 5.0 | 26.6 ± 5.2 |
| <25 | 427 (43.9) | 414 (42.6) |
| ≥25 | 545 (56.1) | 558 (57.4) |
|
| ||
| Cigarette smoking | ||
| Never | 526 (54.1) | 526 (54.2) |
| Former | 419 (43.1) | 427 (43.9) |
| Current | 27 (2.8) | 19 (2.0) |
|
| ||
| Hormone therapy use | ||
| Never | 299 (30.8) | 284 (29.2) |
| Former | 191 (19.7) | 524 (53.9) |
| Current | 482 (49.5) | 164 (16.9) |
|
| ||
| History of diagnosed diabetes | ||
| No | 934 (96.1) | 901 (92.7) |
| Yes | 38 (3.9) | 71 (7.3) |
|
| ||
| Race/ethnicity | N/A | |
| White | 954 (98.1) | |
| Other | 18 (1.9) | |
|
| ||
| Education (n = 954)* | N/A | |
| High school | 203 (21.3) | |
| College | 413 (43.3) | |
| Graduate school | 338 (35.4) | |
NA = not applicable.
Data are presented as n (%) unless otherwise noted.
Not all participants answered question.
Clinical periodontal measures according to self-reported periodontal disease are shown in Table 2. Of the 972 females in the present study, 259 (26.6%) self-reported a history of diagnosed periodontal or gum disease. Females reporting periodontal/gum disease tended to have significantly worse oral hygiene habits and clinical periodontal measures at baseline and at follow-up compared with females who did not report having periodontal/gum disease. Likewise, females reporting periodontal/gum disease also had significantly greater tooth loss to periodontitis and higher frequency of oral surgery or tooth extraction because of gum disease. The proportion of females reporting periodontal/gum disease across clinical categories of none/mild, moderate, and severe periodontal disease was 13.5%, 24.7%, and 56.2% at baseline and was 14.4%, 27.4%, and 60.6% at follow-up (trend, P <0.001 each). Using severe periodontal disease at baseline as the criterion, moderate agreement was seen with self-reported periodontal disease (κ = 0.27; 95% CI = 0.20 to 0.33). Results were similar when based on clinical periodontal disease status at follow-up. Major periodontal disease risk factors were compared at baseline between females with and without self-reported history of diagnosed periodontal/gum disease. The proportion of ever smokers, overweight/obesity (BMI ≥25), and diagnosed treated diabetes was significantly greater in females who reported (53.3%, 60.6%, and 6.9%) than those who did not report (43.2%, 54.4%, and 2.8%; P <0.05, each) a history of periodontal/gum disease. There were no significant differences in age (mean: 65.3 versus 65.9; P = 0.16) or hormone therapy use (never, former, current: 26.3%, 21.2%, 53.5% versus 32.4%, 19.1%, 48.5%; P = 0.17) between females reporting and not reporting diagnosis of periodontal/gum disease, respectively.
Table 2.
Clinical Periodontal Measures at OsteoPerio Baseline and Follow-Up According to Response to the WHI-OS Periodontal Disease Question, “Has a Dentist or Dental Hygienist Ever Told You That You Had Periodontal or Gum Disease?”
| Parameter | WHI-OS Periodontal Disease Response
|
|||||
|---|---|---|---|---|---|---|
| Baseline Periodontal Measures | Follow-Up Periodontal Measures | |||||
|
| ||||||
| No (n = 713) | Yes (n = 259) | P value | No (n = 713) | Yes (n = 259) | P value | |
| Characteristic, mean ± SD (95% CI) | ||||||
| Number of teeth present at visit | 23.7 ± 4.9 (23.4 to 24.1) | 23.6 ± 4.7 (23.0 to 24.2) | 0.19‡ | 23.4 ± 5.1 (23.0 to 23.7) | 22.9 ± 4.9 (22.3 to 23.5) | 0.04‡ |
| Number of teeth lost to periodontitis | 0.14 ± 1.2 (0.05 to 0.22) | 1.26 ± 3.5 (0.83 to 1.68) | <0.05‡ | 0.15 ± 1.2 (0.06 to 0.23) | 1.6 ± 4.2 (1.08 to 2.11) | <0.05‡ |
| ACH (mm) | ||||||
| Whole-mouth mean | 2.32 ± 0.6 (2.26 to 2.37) | 2.75 ± 0.7 (2.66 to 2.85) | <0.001‡ | 2.52 ± 0.8 (2.46 to 2.58) | 2.92 ± 0.9 (2.81 to 3.04) | <0.001‡ |
| Worst site | 4.29 ± 1.2 (4.19 to 4.38) | 5.42 ± 1.8 (5.19 to 5.64) | <0.001‡ | 4.36 ± 1.56 (4.24 to 4.47) | 5.17 ± 1.86 (4.94 to 5.39) | <0.001‡ |
| CAL (mm) | ||||||
| Whole-mouth mean | 2.27 ± 0.6 (2.23 to 2.32) | 2.60 ± 0.6 (2.52 to 2.69) | <0.001‡ | 2.21 ± 0.6 (2.16 to 2.25) | 2.56 ± 0.6 (2.48 to 2.64) | <0.001‡ |
| Worst site | 5.28 ± 1.5 (5.16 to 5.40) | 6.59 ± 0.6 (6.34 to 6.84) | <0.001‡ | 5.18 ± 1.8 (5.04 to 5.32) | 6.47 ± 2.2 (6.19 to 6.76) | <0.001‡ |
| PD (mm) | ||||||
| Whole-mouth mean | 2.14 ± 0.3 (2.11 to 2.16) | 2.32 ± 0.4 (2.27 to 2.37) | <0.001† | 2.04 ± 0.3 (2.01 to 2.07) | 2.20 ± 0.3 (2.15 to 2.24) | <0.001† |
| Worst site | 4.67 ± 1.1 (4.58 to 4.75) | 5.50 ± 1.4 (5.32 to 5.68) | <0.001† | 4.54 ± 1.7 (4.42 to 4.67) | 5.29 ± 1.8 (5.06 to 5.52) | <0.001‡ |
| Gingival bleeding sites, % | 32.9 ± 21.6 (31.3 to 34.5) | 34.0 ± 24.6 (31.0 to 37.1) | 0.94‡ | 18.5 ± 19.2 (17.1 to 19.9) | 18.8 ± 18.5 (16.6 to 21.1) | 0.75‡ |
|
| ||||||
| Oral surgery or tooth extraction because of gum disease, n (%) | ||||||
| Never | 624 (90.1) | 95 (37.5) | <0.001* | 610 (88.2) | 87 (34.5) | <0.001* |
| Ever | 68 (9.9) | 158 (62.4) | 81 (11.8) | 165 (65.5) | ||
|
| ||||||
| Toothbrushing | ||||||
| ≤1 time per day | 160 (22.4) | 63 (24.3) | 0.53* | 144 (20.2) | 64 (24.7) | 0.13* |
| ≥2 times per day | 553 (77.6) | 196 (75.7) | 568 (79.8) | 195 (75.3) | ||
|
| ||||||
| Flossing | ||||||
| ≤1 time per week | 207 (29.2) | 49 (18.9) | 0.005* | 191 (26.8) | 51 (19.6) | 0.06* |
| >1 time per week | 196 (27.6) | 79 (30.6) | 192 (26.9) | 73 (28.1) | ||
| Every day | 305 (43.2) | 130 (50.5) | 329 (46.3) | 135 (52.3) | ||
|
| ||||||
| Visit dentist | ||||||
| Never | 2 (0.2) | 3 (1.1) | 0.20* | 10 (1.4) | 3 (1.1) | 0.73* |
| Only with a problem or <1 time/year | 52 (7.4) | 16 (6.3) | 26 (3.7) | 7 (2.8) | ||
| ≥1 time per year | 659 (92.4) | 240 (92.6) | 676 (94.9) | 249 (96.1) | ||
|
| ||||||
| Periodontal disease status | ||||||
| None/mild | 224 (86.4) | 35 (13.5) | <0.001* | 307 (85.5) | 52 (14.4) | <0.001* |
| Moderate | 423 (75.2) | 139 (24.7) | 360 (72.5) | 136 (27.4) | ||
| Severe | 66 (43.7) | 85 (56.2) | 46 (39.3) | 71 (60.6) | ||
χ2 test.
Independent t test.
Mann–Whitney U test.
Of the 945 females in the present study who responded to the OsteoPerio study question on surgery/tooth extraction attributable to gum disease, 226 (23.9%) self-reported a positive history. The proportion of females at baseline reporting surgery/tooth extraction attributable to gum disease across CDC/AAP clinical categories of none/mild, moderate, and severe periodontal disease was 8.3%, 24.3%, and 49.6% (trend, P <0.001). Moderate agreement was seen between self-reported surgery/tooth extraction and severe periodontal disease (κ = 0.25; 95% CI = 0.17 to 0.31). When the WHI-OS question on history of periodontal/gum disease was cross-classified with the OsteoPerio Study question on history of surgery/tooth extraction attributable to gum disease, overall agreement was 82.7% (P <0.001), and κ was 0.55 (95% CI = 0.48 to 0.60).
To further evaluate the accuracy of self-reported periodontal disease, the sensitivity, specificity, predictive values, κ coefficients, and LR+ and LR− were compared with criterion periodontal measures defined as binary variables (Table 3). Findings were similar when using OsteoPerio baseline or follow-up criterion measures, so only results using baseline measures are reported. Accuracy was highest when comparing self-reported periodontal disease with more severe criterion measures. Compared with tooth loss to periodontitis, values were 76%, 77%, 22%, 97%, and 0.25, respectively, and, when compared with the PD composite criterion, values were 52%, 83%, 53%, 82%, and 0.35, respectively. LR+ values across criterion measures indicated that the proportion of true positives generally was at least twice that of false positives (LR+ >2.0), whereas LR− values indicated the proportion of false negatives was 20% to 70% lower than the proportion of true negatives. The pattern of findings was comparable for accuracy of the OsteoPerio question on self-reported history of surgery/tooth extraction attributable to gum disease (Table 4).
Table 3.
Accuracy of WHI-OS Question on Self-Reported History of Periodontal Disease Compared With Criterion Clinical Periodontal Measures at Baseline in the OsteoPerio Study (n = 972)
| Criterion Periodontal Measure (Prevalence) | Sensitivity* | Specificity* | Positive Predictive Value* | Negative Predictive Value* | LR + | LR − | κ Coefficients† |
|---|---|---|---|---|---|---|---|
| Tooth loss to periodontitis (7%) | 76.0 (66.3 to 85.6) | 77.4 (74.7 to 80.2) | 22.0 (16.9 to 27.0) | 97.4 (96.3 to 98.6) | 3.36 | 0.31 | 0.25 (0.18 to 0.31) |
|
| |||||||
| ≥1 tooth with ≥4 mm | |||||||
| ACH‡ (57%) | 35.5 (31.5 to 39.4) | 85.5 (82.1 to 88.9) | 77.2 (72.1 to 82.3) | 49.0 (45.4 to 52.7) | 2.46 | 0.75 | 0.19 (0.14 to 0.24) |
| CAL‡ (86%) | 28.8 (25.8 to 31.9) | 87.7 (82.1 to 93.3) | 93.8 (90.8 to 96.7) | 16.1 (13.4 to 18.8) | 2.37 | 0.81 | 0.06 (0.03 to 0.08) |
| PD‡ (75%) | 30.2 (26.9 to 33.5) | 84.4 (79.8 to 89.0) | 85.7 (81.4 to 89.9) | 28.1 (24.8 to 31.4) | 1.94 | 0.83 | 0.09 (0.05 to 0.12) |
|
| |||||||
| ≥1 tooth with ≥4 mm, or tooth loss to periodontitis | |||||||
| ACH‡ (58%) | 35.5 (31.6 to 39.5) | 85.7 (82.3 to 89.1) | 77.6 (72.5 to 82.6) | 48.9 (45.2 to 52.6) | 2.50 | 0.75 | 0.19 (0.14 to 0.24) |
| CAL‡ (87%) | 28.9 (25.8 to 32.0) | 88.3 (82.8 to 93.9) | 94.2 (91.3 to 97.0) | 15.9 (13.3 to 18.6) | 2.49 | 0.81 | 0.06 (0.03 to 0.08) |
| PD‡ (77%) | 30.7 (27.4 to 34.1) | 86.8 (82.4 to 91.2) | 88.4 (84.5 to 92.3) | 27.7 (24.4 to 31.0) | 2.34 | 0.80 | 0.10 (0.06 to 0.13) |
|
| |||||||
| ≥1 tooth with ≥6 mm | |||||||
| ACH‡ (15%) | 56.1 (48.1 to 64.2) | 78.5 (75.7 to 81.3) | 31.6 (26.0 to 37.3) | 91.0 (88.9 to 93.1) | 2.62 | 0.56 | 0.26 (0.19 to 0.33) |
| CAL‡ (36%) | 44.2 (39.0 to 49.3) | 83.4 (80.5 to 86.4) | 60.6 (54.6 to 66.5) | 72.2 (68.9 to 75.5) | 2.68 | 0.67 | 0.29 (0.23 to 0.35) |
| PD‡ (19%) | 49.2 (42.0 to 56.3) | 78.7 (75.8 to 81.5) | 35.5 (29.6 to 41.3) | 86.6 (84.1 to 89.1) | 2.31 | 0.65 | 0.24 (0.17 to 0.31) |
|
| |||||||
| ≥1 tooth with ≥6 mm, or tooth loss to periodontitis | |||||||
| ACH‡ (19%) | 58.0 (50.8 to 65.2) | 80.5 (77.7 to 83.2) | 40.5 (34.5 to 46.5) | 89.3 (87.0 to 91.6) | 2.98 | 0.52 | 0.33 (0.26 to 0.39) |
| CAL‡ (38%) | 44.6 (39.6 to 49.6) | 84.6 (81.7 to 87.5) | 64.4 (58.6 to 70.3) | 70.9 (67.6 to 74.3) | 2.90 | 0.65 | 0.31 (0.25 to 0.37) |
| PD‡ (24%) | 53.0 (46.5 to 59.4) | 81.6 (78.8 to 84.4) | 47.4 (41.4 to 53.5) | 84.7 (82.0 to 87.3) | 2.88 | 0.58 | 0.33 (0.26 to 0.39) |
|
| |||||||
| Periodontal disease status | |||||||
| Moderate or severe (73%) | 31.4 (28.0 to 34.8) | 86.4 (82.3 to 90.6) | 86.4 (82.3 to 90.6) | 31.4 (28.0 to 34.8) | 2.31 | 0.79 | 0.11 (0.07 to 0.15) |
| Severe (15%) | 56.2 (48.3 to 64.2) | 78.8 (76.0 to 81.6) | 32.8 (27.1 to 38.5) | 90.7 (88.6 to 92.8) | 2.65 | 0.56 | 0.27 (0.20 to 0.33) |
|
| |||||||
| Composite criterion measure§ | |||||||
| ACH‡ (27%) | 50.7 (44.6 to 56.8) | 82.0 (79.2 to 84.8) | 50.5 (44.4 to 56.6) | 82.1 (79.3 to 85.0) | 2.83 | 0.60 | 0.32 (0.26 to 0.39) |
| CAL‡ (38%) | 44.6 (39.6 to 49.6) | 84.6 (81.7 to 87.5) | 64.4 (58.6 to 70.3) | 70.9 (67.6 to 74.3) | 2.90 | 0.65 | 0.31 (0.25 to 0.37) |
| PD‡ (27%) | 52.4 (46.4 to 58.4) | 83.0 (80.2 to 85.7) | 53.6 (47.5 to 59.7) | 82.3 (79.5 to 85.1) | 3.09 | 0.57 | 0.35 (0.29 to 0.42) |
Of the 972 females in the present analysis, 259 (26.6%) self-reported having been told that they had periodontal/gum disease. Sensitivity = percentage of females above criterion threshold who reported having periodontal disease; Specificity = percentage of females below criterion threshold who did not report having periodontal disease; Positive Predictive Value = percentage of females reporting periodontal disease who were above criterion threshold; Negative Predictive Value = percentage of females not reporting periodontal disease who were below criterion threshold; LR+ = ratio of proportion of true positives (sensitivity) to proportion of false positives (1-specificity); LR− = ratio of proportion of false negatives (1-sensitivity) to proportion of true negatives (specificity).
Percent (95% CI).
κ coefficient (95% CI).
Based on worst-site measure of ACH, CAL, and PD.
Composite criterion measure defined as ≥1 tooth with ≥6 mm at worst site for the periodontal measure, tooth loss attributable to periodontal disease, or severe periodontal disease status by CDC/AAP criteria.
Table 4.
Accuracy of OsteoPerio Study Question on Self-Reported History of Surgery or Tooth Extraction Attributable to Gum Disease Compared With Criterion Clinical Periodontal Measures at Baseline in the OsteoPerio Study (n = 945)
| Criterion Periodontal Measure (Prevalence) | Sensitivity* | Specificity* | Positive Predictive Value* | Negative Predictive Value* | LR+ | LR− | κ Coefficients† |
|---|---|---|---|---|---|---|---|
| Tooth loss to periodontitis (8%) | 83.7 (75.3 to 92.1) | 81.1 (78.5 to 83.7) | 27.4 (21.6 to 33.2) | 98.3 (97.3 to 99.2) | 4.43 | 0.20 | 0.34 (0.26 to 0.40) |
|
| |||||||
| ≥1 tooth with ≥4 mm | |||||||
| ACH‡ (57%) | 34.5 (30.5 to 38.4) | 90.5 (87.6 to 93.3) | 83.1 (78.3 to 88.0) | 50.3 (46.6 to 54.0) | 3.63 | 0.72 | 0.23 (0.17 to 0.27) |
| CAL‡ (86%) | 26.4 (23.3 to 29.4) | 92.1 (87.4 to 96.8) | 95.5 (92.8 to 98.2) | 16.2 (13.5 to 18.9) | 3.34 | 0.80 | 0.06 (0.04 to 0.08) |
| PD‡ (75%) | 28.2 (24.9 to 31.6) | 89.6 (85.6 to 93.5) | 89.3 (85.3 to 93.4) | 28.7 (25.4 to 32.1) | 2.72 | 0.80 | 0.10 (0.07 to 0.13) |
|
| |||||||
| ≥1 tooth with ≥4 mm, or tooth loss to periodontitis | |||||||
| ACH‡ (58%) | 34.5 (30.5 to 38.5) | 90.7 (87.8 to 93.5) | 83.6 (78.8 to 88.4) | 50.2 (46.5 to 53.8) | 3.72 | 0.72 | 0.23 (0.18 to 0.27) |
| CAL‡ (87%) | 26.5 (23.5 to 29.6) | 93.6 (89.3 to 97.8) | 96.4 (94.0 to 98.8) | 16.2 (13.5 to 18.9) | 4.15 | 0.78 | 0.06 (0.04 to 0.08) |
| PD‡ (77%) | 28.5 (25.3 to 31.8) | 91.4 (87.7 to 95.1) | 91.5 (87.9 to 95.2) | 28.0 (24.8 to 31.3) | 3.33 | 0.78 | 0.11 (0.08 to 0.14) |
|
| |||||||
| ≥1 tooth with ≥6 mm | |||||||
| ACH‡ (15%) | 53.5 (45.3 to 61.8) | 81.2 (78.5 to 83.9) | 33.1 (27.0 to 39.3) | 90.9 (88.8 to 93.0) | 2.86 | 0.57 | 0.28 (0.20 to 0.34) |
| CAL‡ (36%) | 40.2 (35.1 to 45.4) | 85.5 (82.6 to 88.3) | 61.5 (55.1 to 67.8) | 71.3 (68.0 to 74.6) | 2.78 | 0.70 | 0.28 (0.21 to 0.34) |
| PD‡ (19%) | 42.6 (35.4 to 49.7) | 80.5 (77.7 to 83.3) | 34.5 (28.3 to 40.7) | 85.4 (82.8 to 87.9) | 2.19 | 0.71 | 0.21 (0.14 to 0.28) |
|
| |||||||
| ≥1 tooth with ≥6 mm, or tooth loss to periodontitis | |||||||
| ACH‡ (19%) | 59.2 (51.8 to 66.5) | 84.0 (81.4 to 86.6) | 45.5 (39.0 to 52.0) | 90.1 (87.9 to 92.3) | 3.71 | 0.49 | 0.39 (0.31 to 0.45) |
| CAL‡ (38%) | 41.8 (36.8 to 46.9) | 87.2 (84.5 to 89.9) | 67.2 (61.1 to 73.3) | 70.6 (67.3 to 73.9) | 3.29 | 0.67 | 0.31 (0.25 to 0.37) |
| PD‡ (24%) | 49.3 (42.8 to 55.8) | 84.1 (81.4 to 86.8) | 49.5 (43.0 to 56.0) | 84.0 (81.3 to 86.6) | 3.10 | 0.60 | 0.34 (0.26 to 0.40) |
|
| |||||||
| Periodontal disease status | |||||||
| Moderate or severe (73%) | 29.6 (26.2 to 33.0) | 91.7 (88.3 to 95.1) | 90.7 (86.9 to 94.4) | 32.2 (28.8 to 35.6) | 3.57 | 0.77 | 0.13 (0.10 to 0.16) |
| Severe (15%) | 49.6 (41.5 to 57.7) | 80.7 (78.0 to 83.4) | 31.8 (25.7 to 37.9) | 89.8 (87.6 to 92.0) | 2.58 | 0.62 | 0.25 (0.17 to 0.31) |
|
| |||||||
| Composite criterion measure§ | |||||||
| ACH‡ (26%) | 51.2 (44.9 to 57.4) | 85.6 (83.1 to 88.2) | 55.7 (49.2 to 62.2) | 83.3 (80.5 to 86.0) | 3.58 | 0.57 | 0.38 (0.31 to 0.44) |
| CAL‡ (38%) | 41.8 (36.8 to 46.9) | 87.2 (84.5 to 89.9) | 67.2 (61.1 to 73.3) | 70.6 (67.3 to 73.9) | 3.29 | 0.67 | 0.31 (0.25 to 0.37) |
| PD‡ (27%) | 47.4 (41.3 to 53.5) | 84.8 (82.2 to 87.5) | 53.9 (47.4 to 60.4) | 81.2 (78.3 to 84.0) | 3.14 | 0.62 | 0.33 (0.26 to 0.40) |
Of the 945 females in the present analysis, 226 (23.9%) self-reported having had surgery or tooth extraction for gum disease. Sensitivity = percentage of females above criterion threshold who reported having periodontal disease; Specificity = percentage of females below criterion threshold who did not report having periodontal disease; Positive Predictive Value = percentage of females reporting periodontal disease who were above criterion threshold; Negative Predictive Value = percentage of females not reporting periodontal disease who were below criterion threshold; LR+ = ratio of proportion of true positives (sensitivity) to proportion of false positives (1-specificity); LR− = ratio of proportion of false negatives (1-sensitivity) to proportion of true negatives (specificity).
Data are percentage (95% CI).
κ coefficient (95% CI).
Based on worst-site measure of ACH, CAL, and PD.
Composite criterion measure defined as ≥1 tooth with ≥6 mm at worst site for the periodontal measure, tooth loss attributable to periodontal disease, or severe periodontal disease status by CDC/AAP criteria.
To evaluate performance of the WHI-OS periodontal disease question in cohort subgroups, the main results were stratified by selected OsteoPerio baseline characteristics (age, education, and smoking) that potentially could influence response accuracy. For efficiency, this analysis was restricted to three criterion measures that characterize different aspects of severe periodontal disease: 1) tooth loss to periodontitis; 2) severe periodontitis defined by CDC/AAP criteria; and 3) the ACH composite criterion. As shown in Table 5, accuracy of self-reported periodontal/gum disease was comparable in younger and older females, in those with high school and college education, and in never and ever smokers.
Table 5.
Accuracy of WHI-OS Question on Self-Reported History of Periodontal Disease Compared With Selected OsteoPerio Baseline Criterion Measures According to Age, Education, and Smoking Status (n = 972)
| Criterion Periodontal Measure (Prevalence) | Sensitivity* | Specificity* | Positive Predictive Value* | Negative Predictive Value* | LR+ | LR− | κ Coefficients† |
|---|---|---|---|---|---|---|---|
| Aged <65 years (n = 479) | |||||||
| Tooth loss‡ (5%) | 80.8 (65.6 to 95.9) | 75.5 (71.5 to 79.5) | 15.9 (9.7 to 22.1) | 98.6 (97.3 to 99.8) | 3.30 | 0.25 | 0.19 (0.11 to 0.27) |
| Severe periodontitis§ (15%) | 60.8 (49.7 to 71.9) | 78.5 (74.5 to 82.5) | 34.1 (26.0 to 42.2) | 91.6 (88.7 to 94.6) | 2.48 | 0.52 | 0.29 (0.20 to 0.39) |
| ACH composite|| (20%) | 59.6 (49.9 to 69.3) | 80.8 (76.8 to 84.8) | 44.7 (36.2 to 53.2) | 88.5 (85.1 to 91.8) | 3.10 | 0.50 | 0.36 (0.26 to 0.45) |
|
| |||||||
| Aged ≥65 years (n = 493) | |||||||
| Tooth loss‡ (9%) | 73.5 (61.1 to 85.8) | 79.5 (75.7 to 83.3) | 28.3 (20.5 to 36.2) | 96.4 (94.6 to 98.3) | 3.59 | 0.33 | 0.31 (0.21 to 0.40) |
| Severe periodontitis§ (15%) | 51.9 (40.8 to 63.1) | 79.1 (75.2 to 83.0) | 31.5 (23.4 to 39.6) | 89.9 (86.8 to 93.0) | 2.48 | 0.61 | 0.24 (0.14 to 0.34) |
| ACH composite|| (32%) | 45.3 (37.5 to 53.0) | 83.5 (79.6 to 87.5) | 56.7 (48.1 to 65.3) | 76.2 (71.9 to 80.6) | 2.75 | 0.66 | 0.30 (0.21 to 0.39) |
|
| |||||||
| Highest education | |||||||
| High school (n = 203) | |||||||
| Tooth loss‡ (9%) | 78.9 (60.6 to 97.3) | 76.1 (69.9 to 82.3) | 25.4 (14.3 to 36.5) | 97.2 (94.5 to 99.9) | 3.30 | 0.28 | 0.28 (0.14 to 0.41) |
| Severe periodontitis§ (20%) | 51.2 (35.9 to 66.5) | 76.5 (70.0 to 83.1) | 35.6 (23.4 to 47.8) | 86.1 (80.5 to 91.8) | 2.18 | 0.64 | 0.24 (0.09 to 0.38) |
| ACH composite|| (28%) | 47.4 (34.4 to 60.3) | 78.1 (71.4 to 84.8) | 45.8 (33.1 to 58.5) | 79.2 (72.5 to 85.8) | 2.16 | 0.67 | 0.25 (0.10 to 0.39) |
| College (n = 413) | |||||||
| Tooth loss‡ (9%) | 76.3 (62.8 to 89.8) | 79.7 (75.7 to 83.8) | 27.6 (19.1 to 36.2) | 97.1 (95.2 to 99.0) | 3.76 | 0.30 | 0.31 (0.21 to 0.41) |
| Severe periodontitis§ (15%) | 52.3 (40.2 to 64.4) | 79.6 (75.4 to 83.8) | 32.4 (23.4 to 41.3) | 89.9 (86.6 to 93.3) | 2.56 | 0.60 | 0.26 (0.14 to 0.36) |
| ACH composite|| (29%) | 48.3 (39.4 to 57.3) | 84.0 (79.8 to 88.2) | 55.2 (45.7 to 64.7) | 79.9 (75.4 to 84.3) | 3.02 | 0.62 | 0.34 (0.23 to 0.43) |
| Graduate school (n = 338) | |||||||
| Tooth loss‡ (5%) | 70.6 (48.9 to 92.2) | 75.7 (71.0 to 80.4) | 13.3 (6.3 to 20.4) | 98.0 (96.2 to 99.7) | 2.91 | 0.39 | 0.15 (0.05 to 0.24) |
| Severe periodontitis§ (12%) | 65.9 (51.3 to 80.4) | 78.8 (74.1 to 83.4) | 30.0 (20.5 to 39.5) | 94.4 (91.5 to 97.2) | 3.11 | 0.43 | 0.29 (0.18 to 0.40) |
| ACH composite (22%) | 57.1 (46.1 to 68.2) | 82.4 (77.8 to 87.0) | 48.9 (38.6 to 59.2) | 86.7 (82.5 to 90.9) | 3.24 | 0.52 | 0.37 (0.26 to 0.48) |
|
| |||||||
| Never smokers (n = 526) | |||||||
| Tooth loss‡ (5%) | 74.1 (57.5 to 90.6) | 79.8 (76.2 to 83.3) | 16.5 (9.9 to 23.1) | 98.3 (97.0 to 99.5) | 3.67 | 0.32 | 0.20 (0.11 to 0.29) |
| Severe periodontitis§ (12%) | 46.2 (34.0 to 58.3) | 80.3 (76.6 to 83.9) | 24.8 (17.1 to 32.5) | 91.4 (88.6 to 94.1) | 2.35 | 0.67 | 0.19 (0.09 to 0.28) |
| ACH composite|| (20%) | 48.2 (38.8 to 57.5) | 83.7 (80.1 to 87.2) | 43.8 (35.0 to 52.6) | 85.9 (82.5 to 89.3) | 2.96 | 0.62 | 0.31 (0.21 to 0.40) |
|
| |||||||
| Ever smokers (n = 446) | |||||||
| Tooth loss‡ (10%) | 77.1 (65.2 to 89.0) | 74.6 (70.3 to 78.9) | 26.8 (19.4 to 34.2) | 96.4 (94.4 to 98.5) | 3.04 | 0.31 | 0.28 (0.19 to 0.37) |
| Severe periodontitis§ (19%) | 64.0 (53.8 to 74.1) | 76.9 (72.6 to 81.3) | 39.9 (31.7 to 48.0) | 89.9 (86.6 to 93.3) | 2.77 | 0.47 | 0.33 (0.23 to 0.42) |
| ACH composite|| (33%) | 52.7 (44.7 to 60.7) | 79.9 (75.3 to 84.4) | 56.5 (48.3 to 64.8) | 77.3 (72.6 to 82.0) | 2.62 | 0.59 | 0.33 (0.23 to 0.42) |
Of the 972 females in the present analysis, 259 (26.6%) self-reported having been told that they had periodontal/gum disease. Sensitivity = percentage of females above criterion threshold who reported having periodontal disease; Specificity = percentage of females below criterion threshold who did not report having periodontal disease; Positive Predictive Value = percentage of females reporting periodontal disease who were above criterion threshold; Negative Predictive Value = percentage of females not reporting periodontal disease who were below criterion threshold; LR+ = ratio of proportion of true positives (sensitivity) to proportion of false positives (1-specificity); LR− = ratio of proportion of false negatives (1-sensitivity) to proportion of true negatives (specificity).
Data are percentage (95% CI).
κ coefficient (95% CI).
Tooth loss to periodontitis.
Severe periodontitis by CDC/AAP criteria.
Composite criterion measure defined as ≥1 tooth with worst-site ACH ≥6 mm, tooth loss attributable to periodontal disease, or severe periodontal disease status by CDC/AAP criteria.
Because females who have more frequent dental visits could have higher likelihood of being told they have periodontal disease and thus more accurately report a history of diagnosis compared with females who visit the dentist less often, the analysis was repeated in Table 3 after excluding females who reported visiting a dentist only for a problem or never (n = 73, 7.5% of the overall cohort). Results on sensitivity, specificity, predictive values, and κ coefficients were materially the same as in Table 3 for the overall cohort (data not shown).
DISCUSSION
The results of this study conducted in a subset of WHI-OS females who completed clinical oral examinations in the ancillary Buffalo OsteoPerio study indicate that history of diagnosis of periodontal or gum disease and history of surgery or tooth extraction attributable to gum disease is reported with moderate accuracy in older females who regularly see their dentist, particularly among those with more severe disease. Periodontal disease risk factors and clinical measures were, on average, worse in females reporting diagnosis of periodontal/gum disease. The frequency of reported periodontal/gum disease and reported surgery/tooth extraction attributable to gum disease was incrementally higher across categories of clinical periodontal disease severity based on CDC/AAP criteria. When compared against more severe criterion measures, self-reported periodontal disease status demonstrated moderate accuracy and predictive value similar to that reported in other epidemiologic studies on periodontal disease. Results were comparable between cohort subgroups for which differences in response accuracy might be expected. Although beyond the scope of the present study, findings on sensitivity and specificity reported herein, together with established statistical methods,22 potentially could be used to evaluate and correct for the effect of misclassification in studies relating periodontal disease with risk of disease occurrence. The WHI-OS large cohort size and extensive scope of follow-up offers opportunity to examine associations between self-reported periodontal disease and relevant diseases of aging that could, in turn, focus additional research at improving control of periodontal disease and its complications among older adults.
Comparing findings of validation studies is difficult because of differences in clinical periodontal status across populations, in the wording of questions used to assess periodontal disease by self-report, and in the criterion periodontal measures used to examine questionnaire accuracy.8 The present findings generally agree with previous results, particularly from cohorts with advanced education and frequent use of dental services. Among 212 older white male non-dentist health professionals, mean alveolar bone height obtained from oral radiographs was significantly worse in males who self-reported having periodontal disease compared with those who did not.15 LR+ and LR− predictive values for self-reported periodontal disease were ≈70% when the criterion measure was defined as the median percentage of sites >4 mm ACH. In the present study, a similar positive predictive value (77%) but lower negative predictive value (49%) was observed when the criterion measure was defined as ≥1 tooth with ≥4 mm ACH. In another study on 155 older white males, significantly worse ACH was seen in those with than without self-reported periodontal disease.14 When compared with criterion ACH measures of varying severity, the sensitivity ranged from 17% to 50% and the specificity from 77% to 90% for case finding questions worded similarly to the WHI-OS question on periodontal/gum disease. In the present analysis, similar values for sensitivity and specificity, and in some instances better sensitivity (56% to 58%), are observed when ACH of varying severity was the criterion measure. In two smaller studies on females that included a nearly identical periodontal question as in the WHI-OS, sensitivity and specificity, respectively, was 32% and 94% in younger participants23 and was 54% and 89% in older participants24 when compared with the criterion periodontal pockets ≥4 mm. In the present study, a sensitivity of 30% and specificity of 84% were observed when PD ≥4 mm was the criterion. κ coefficients and likelihood ratio measures further confirmed the accuracy of self-reported periodontal/gum disease suggested by the above discussed sensitivity, specificity, and predictive values, but comparison with findings in other studies is limited because κ and likelihood ratios typically have not been reported.8
Published findings also are limited regarding to the accuracy of reported periodontal disease surgery. 8 Among older non-dentist white males, positive and negative predictive values were 69% and 74%, respectively, when compared with the criterion of greater than the median percentage of sites with ≥3 mm ACH.15 In the present cohort of older females, positive and negative predictive values of 83% and 50%, respectively, were seen for reported history of surgery/tooth extraction attributable to gum disease against the criterion of at least one tooth with ≥4 mm ACH loss. Moreover, relatively higher values were observed for sensitivity, specificity, and κ coefficients when compared with more severe criterion measures and strong agreement between OsteoPerio self-reported history of surgery/tooth extraction attributable to gum disease and WHI-OS self-reported history of diagnosed periodontal disease.
The several criterion periodontal measures used in this study are defined practically to reflect levels of periodontal disease that, if observed clinically, likely would elicit dentists telling their patients they have disease. The lower sensitivity in previous studies and in the present study suggests that a proportion of individuals have periodontal disease, by selected definitions, but either have not been advised of this by their dentist or do not recall well having been advised. Specificity in this study is high, suggesting that the WHI-OS question on periodontal disease and the OsteoPerio Study question on surgery/tooth extraction attributable to gum disease correctly identifies a large proportion of adults who are without a history of diagnosed periodontal or gum disease. Predictive values, particularly positive predictive values, tend to track with prevalence of the criterion measure.25 In this study, predictive values expectedly are highest when prevalence of the criterion measure was high. Higher sensitivity and specificity were observed when criterion measures were more severe and thus less prevalent. When criterion prevalence is low, a higher proportion of females self-reporting periodontal disease will be false positives and, thus, moderate predictive values. The tradeoff in sensitivity, specificity, and predictive value with respect to the choice and prevalence of criterion measure need be considered when interpreting the present findings and when comparing results among published studies.
It is possible that findings from the present cohort of mostly college-educated females with frequent dental visits may not generalize to other groups who are less educated, have less frequent dental visits, or have substantially different underlying prevalence and severity of periodontitis. Stratified analyses were used to examine consistency of the present primary results for the WHI-OS periodontal disease question according to cohort subgroups defined by age, education level, and smoking status. It is possible that smokers or older adults would more likely have and thus be advised of clinically severe periodontal disease. Likewise, younger and more educated females might recall history of diagnosis with greater accuracy. No appreciable differences were found in the accuracy of self-reported periodontal disease between study subgroups. Because the majority of participants reported frequent dental visits, there was limited ability to examine this issue, although the primary results were unchanged when females with infrequent dental visits were excluded. Additional studies on older adults with greater sociodemographic and clinical diversity would help clarify the generalizability of the findings of the present study.
Strengths of the current investigation include the following: 1) the large, well-characterized study group; 2) the several objective periodontal measures with demonstrated reliability obtained from standardized oral examinations; and 3) the relative consistency of findings according to cohort subgroups in which opportunity for, or recall of, periodontal disease diagnosis could differ. The accuracy of self-report has been demonstrated in the WHI for other clinical diagnoses common at older ages, including diabetes,26 cardiovascular events,27 and fractures,28 which strengthens confidence in the present findings. Limitations of this study also should be considered. When evaluating accuracy of self-reported disease, criterion periodontal measures and questionnaire responses on history of periodontal disease ideally should be obtained at the same time point. Administration of the WHI-OS periodontal disease questionnaire did not align with the OsteoPerio periodontal examinations. However, findings were similar when based on criterion measures at baseline (preceding questionnaire administration) or at follow-up (subsequent to questionnaire administration) examinations. Moreover, comparable accuracy was seen for the OsteoPerio study question on history of surgery/tooth extraction attributable to gum disease, which was administered concurrent with collection of baseline periodontal measures. Responses to both questions were strongly and positively associated with clinical periodontal disease defined by CDC/AAP criteria and were strongly correlated with each other. The concordant findings for the two self-reported assessments of periodontal disease enhances confidence that accuracy of the WHI-OS question is not spuriously affected by participation in the preceding clinical examination. The extent that OsteoPerio females represent the larger WHI-OS is an important consideration. Recruitment strategies, enrollment criteria, and procedures for the Buffalo WHI center were identical to those used in the larger WHI-OS. Baseline characteristics of females enrolled into the WHI-OS at the Buffalo center are comparable with baseline characteristics in the national WHI-OS cohort. Although participation in the OsteoPerio studies was elective, there is no known selection force underpinning the subset of females enrolled in the OsteoPerio study that would systematically affect the accuracy of self-reporting periodontal disease diagnosis. The periodontal disease question was asked only once in the WHI-OS, so it was not possible to examine reliability of self-reported periodontal disease diagnosis. Reliability of self-reported sociodemographic information, lifestyle factors, and clinical conditions has been demonstrated in the overall WHI-OS,7 and there is no obvious reason to believe responses to the periodontal disease question would conversely lack reliability in this study group. Multi-item questionnaires likely provide more complete characterization of periodontal disease status than does a single-item assessment.29 However, single-item questions such as in the WHI-OS and the Osteo-Perio Study have been used in other epidemiologic studies that have contributed extensively to understanding the etiology and health consequences of periodontal disease.30,31 Additional epidemiologic findings from the WHI-OS could further distinguish the role periodontal disease has in determining health status among the growing population of older females in the United States.
CONCLUSIONS
A simple question for self-reported periodontal disease can be used to characterize periodontal disease prevalence with moderate accuracy among postmenopausal females who regularly see their dentist, particularly in those with more severe disease. Use of objective periodontal measures could enhance disease classification, although such measures may not be feasible in large epidemiologic studies. Findings from the present study potentially could be used to correct for misclassification when relating self-reported periodontal disease with risk of other diseases in the WHI-OS. Further defining the link between oral and systemic health could lead to improved primary and secondary prevention strategies in older females. The WHI-OS is an existing resource in which these associations can be explored on a large scale in a cost-efficient manner.
Acknowledgments
This study was supported by National Heart, Lung, and Blood Institute Contract N01WH32122, National Institute for Dental and Craniofacial Research Grants DE13505 and DE04898, and U.S. Army Reserve Medical Corps Grant DAMD17-96-1-6319. The authors report no conflicts of interest related to this study.
Footnotes
SAS v.9.2, SAS Institute, Cary, NC.
References
- 1.Albandar JM, Brunelle JA, Kingman A. Destructive periodontal disease in adults 30 years of age and older in the United States, 1988–1994. J Periodontol. 1999;70:13–29. doi: 10.1902/jop.1999.70.1.13. [DOI] [PubMed] [Google Scholar]
- 2.Beltrán-Aguilar ED, Barker LK, Canto MT, et al. Centers for Disease Control and Prevention (CDC) Surveillance for dental caries, dental sealants, tooth retention, edentulism, and enamel fluorosis — United States, 1988–1994 and 1999–2002. MMWR Surveill Summ. 2005;54:1–43. [PubMed] [Google Scholar]
- 3.Page RC. The pathobiology of periodontal diseases may affect systemic diseases: Inversion of a paradigm. Ann Periodontol. 1998;3:108–120. doi: 10.1902/annals.1998.3.1.108. [DOI] [PubMed] [Google Scholar]
- 4.Scannapieco FA. Position paper of The American Academy of Periodontology: Periodontal disease as a potential risk factor for systemic diseases. J Periodontol. 1998;69:841–850. [PubMed] [Google Scholar]
- 5.Wactawski-Wende J. Periodontal diseases and osteoporosis: Association and mechanisms. Ann Periodontol. 2001;6:197–208. doi: 10.1902/annals.2001.6.1.197. [DOI] [PubMed] [Google Scholar]
- 6.Vincent GK, Velkoff VA. Current Population Reports, P25–1138. Washington, DC: U.S. Census Bureau; 2010. The next four decades: The older population in the United States: 2010 to 2050; pp. 1–14. [Google Scholar]
- 7.Langer RD, White E, Lewis CE, Kotchen JM, Hendrix SL, Trevisan M. The Women’s Health Initiative Observational Study: Baseline characteristics of participants and reliability of baseline measures. Ann Epidemiol. 2003;13(Suppl 9):S107–S121. doi: 10.1016/s1047-2797(03)00047-4. [DOI] [PubMed] [Google Scholar]
- 8.Blicher B, Joshipura K, Eke P. Validation of self-reported periodontal disease: A systematic review. J Dent Res. 2005;84:881–890. doi: 10.1177/154405910508401003. [DOI] [PubMed] [Google Scholar]
- 9.Merchant AT, Pitiphat W. Researching periodontitis: Challenges and opportunities. J Clin Periodontol. 2007;34:1007–1015. doi: 10.1111/j.1600-051X.2007.01148.x. [DOI] [PubMed] [Google Scholar]
- 10.Bole C, Wactawski-Wende J, Hovey KM, Genco RJ, Hausmann E. Clinical and community risk models of incident tooth loss in postmenopausal women from the Buffalo Osteo Perio Study. Community Dent Oral Epidemiol. 2010;38:487–497. doi: 10.1111/j.1600-0528.2010.00555.x. [DOI] [PMC free article] [PubMed] [Google Scholar]
- 11.Brennan-Calanan RM, Genco RJ, Wilding GE, Hovey KM, Trevisan M, Wactawski-Wende J. Osteoporosis and oral infection: Independent risk factors for oral bone loss. J Dent Res. 2008;87:323–327. doi: 10.1177/154405910808700403. [DOI] [PubMed] [Google Scholar]
- 12.LaMonte MJ, Hovey KM, Genco RJ, Millen AE, Trevisan M, Wactawski-Wende J. Five-year changes in periodontal disease measures among postmenopausal females: The Buffalo OsteoPerio study. J Periodontol. 2013;84:572–584. doi: 10.1902/jop.2012.120137. [DOI] [PubMed] [Google Scholar]
- 13.Wactawski-Wende J, Hausmann E, Hovey K, Trevisan M, Grossi S, Genco RJ. The association between osteoporosis and alveolar crestal height in postmenopausal women. J Periodontol. 2005;76(Suppl 11):2116–2124. doi: 10.1902/jop.2005.76.11-S.2116. [DOI] [PubMed] [Google Scholar]
- 14.Pitiphat W, Garcia RI, Douglass CW, Joshipura KJ. Validation of self-reported oral health measures. J Public Health Dent. 2002;62:122–128. doi: 10.1111/j.1752-7325.2002.tb03432.x. [DOI] [PubMed] [Google Scholar]
- 15.Joshipura KJ, Pitiphat W, Douglass CW. Validation of self-reported periodontal measures among health professionals. J Public Health Dent. 2002;62:115–121. doi: 10.1111/j.1752-7325.2002.tb03431.x. [DOI] [PubMed] [Google Scholar]
- 16.Genco RJ, Falkner KL, Grossi S, Dunford R, Trevisan M. Validity of self-reported measures for surveillance of periodontal disease in two western New York population-based studies. J Periodontol. 2007;78(Suppl 7):1439–1454. doi: 10.1902/jop.2007.060435. [DOI] [PubMed] [Google Scholar]
- 17.National Institute of Dental Research. Oral Health of United States Adults. Epidemiology and Oral Disease Prevention Program. Bethesda, MD: National Institutes of Health; 1987. Diagnostic criteria for dental examinations; pp. 1–115. NIH publication 87-2868. [Google Scholar]
- 18.Gibbs CH, Hirschfeld JW, Lee JG, et al. Description and clinical evaluation of a new computerized periodontal probe — The Florida probe. J Clin Periodontol. 1988;15:137–144. doi: 10.1111/j.1600-051x.1988.tb01008.x. [DOI] [PubMed] [Google Scholar]
- 19.Hausmann E, Allen K, Christersson L, Genco RJ. Effect of x-ray beam vertical angulation on radiographic alveolar crest level measurement. J Periodontal Res. 1989;24:8–19. doi: 10.1111/j.1600-0765.1989.tb00852.x. [DOI] [PubMed] [Google Scholar]
- 20.Hausmann E, Allen K, Dunford R, Christersson L. A reliable computerized method to determine the level of the radiographic alveolar crest. J Periodontal Res. 1989;24:368–369. doi: 10.1111/j.1600-0765.1989.tb00884.x. [DOI] [PubMed] [Google Scholar]
- 21.Page RC, Eke PI. Case definitions for use in population-based surveillance of periodontitis. J Periodontol. 2007;78(Suppl 7):1387–1399. doi: 10.1902/jop.2007.060264. [DOI] [PubMed] [Google Scholar]
- 22.Flegal KM, Brownie C, Haas JD. The effects of exposure misclassification on estimates of relative risk. Am J Epidemiol. 1986;123:736–751. doi: 10.1093/oxfordjournals.aje.a114294. [DOI] [PubMed] [Google Scholar]
- 23.Gilbert AD, Nuttall NM. Self-reporting of periodontal health status. Br Dent J. 1999;186:241–244. doi: 10.1038/sj.bdj.4800075. [DOI] [PubMed] [Google Scholar]
- 24.Buhlin K, Gustafsson A, Andersson K, Håkansson J, Klinge B. Validity and limitations of self-reported periodontal health. Community Dent Oral Epidemiol. 2002;30:431–437. doi: 10.1034/j.1600-0528.2002.00014.x. [DOI] [PubMed] [Google Scholar]
- 25.Griner PF, Mayewski RJ, Mushlin AI, Greenland P. Selection and interpretation of diagnostic tests and procedures. Principles and applications. Ann Intern Med. 1981;94:557–592. [PubMed] [Google Scholar]
- 26.Margolis KL, Lihong Qi, Brzyski R, et al. Women Health Initiative Investigators. Validity of diabetes self-reports in the Women’s Health Initiative: Comparison with medication inventories and fasting glucose measurements. Clin Trials. 2008;5:240–247. doi: 10.1177/1740774508091749. [DOI] [PMC free article] [PubMed] [Google Scholar]
- 27.Heckbert SR, Kooperberg C, Safford MM, et al. Comparison of self-report, hospital discharge codes, and adjudication of cardiovascular events in the Women’s Health Initiative. Am J Epidemiol. 2004;160:1152–1158. doi: 10.1093/aje/kwh314. [DOI] [PubMed] [Google Scholar]
- 28.Chen Z, Kooperberg C, Pettinger MB, et al. Validity of self-report for fractures among a multiethnic cohort of postmenopausal women: Results from the Women’s Health Initiative observational study and clinical trials. Menopause. 2004;11:264–274. doi: 10.1097/01.gme.0000094210.15096.fd. [DOI] [PubMed] [Google Scholar]
- 29.Eke PI, Genco RJ. CDC Periodontal Disease Surveillance Project: Background, objectives, and progress report. J Periodontol. 2007;78(Suppl 7):1366–1371. doi: 10.1902/jop.2007.070134. [DOI] [PubMed] [Google Scholar]
- 30.Merchant AT, Pitiphat W, Rimm EB, Joshipura K. Increased physical activity decreases periodontitis risk in men. Eur J Epidemiol. 2003;18:891–898. doi: 10.1023/a:1025622815579. [DOI] [PubMed] [Google Scholar]
- 31.Michaud DS, Liu Y, Meyer M, Giovannucci E, Joshipura K. Periodontal disease, tooth loss, and cancer risk in male health professionals: A prospective cohort study. Lancet Oncol. 2008;9:550–558. doi: 10.1016/S1470-2045(08)70106-2. [DOI] [PMC free article] [PubMed] [Google Scholar]