

Abstract
Aim: To verify the superiority of pemafibrate over placebo and the non-inferiority of pemafibrate to the maximum dose of fenofibrate for determining the percent change in fasting serum triglyceride (TG) levels and to investigate safety by assessing the incidence of adverse events (AEs) and adverse drug reactions (ADRs).
Methods: This phase III, placebo/active drug-controlled, randomized, double-blind, parallel group comparison study enrolled patients with high TG and low high-density lipoprotein cholesterol levels. Patients were randomly assigned to receive placebo; pemafibrate 0.1 mg/day, 0.2 mg/day, or 0.4 mg/day; or fenofibrate 100 mg/day or 200 mg/day for 12 weeks.
Results: Among 526 randomized patients, 489 completed the study, with drop-out rates of 0%, 6.7%, 5.5%, 5.9%, 8.2%, and 10.7% in the placebo; pemafibrate 0.1 mg/day, 0.2 mg/day, and 0.4 mg/day; and fenofibrate 100 mg/day and 200 mg/day groups. The study showed the non-inferiority of pemafibrate 0.4 mg/day and 0.2 mg/day to fenofibrate 200 mg/day as well the non-inferiority and superiority of all pemafibrate doses to fenofibrate 100 mg/day for reducing TG levels. No dose-dependent increase in the incidence of AEs or ADRs was observed among the pemafibrate dose groups. The incidence of AEs and ADRs for all pemafibrate doses was similar to that for placebo and fenofibrate 100 mg/day and significantly lower than that for fenofibrate 200 mg/day (P < 0.05).
Conclusions: The favorable safety profile of pemafibrate, with fewer adverse effects on kidney/liverrelated laboratory tests and fewer AEs/ADRs, including those leading to treatment discontinuation, over fenofibrate 200 mg/day may justify the use of this novel and potent treatment option for reducing TG levels in a broader range of patients.
Keywords: Selective PPARα modulator, Fibrate, Triglycerides, Safety, Residual risk
Introduction
Reduction in low-density lipoprotein cholesterol (LDL-C) levels is a clinical priority for preventing cardiovascular disease. Even when LDL-C levels are reduced by drug therapy, the residual risk of cardiovascular disease still persists1). Although further reduction in LDL-C levels may help decrease this residual risk2), growing evidence suggests that the pharmaceutical management of other lipid abnormalities also have clinical benefits. One condition for which such management can be applied is atherogenic dyslipidemia, which is characterized by high levels of triglyceride (TG)-rich lipoproteins that are commonly accompanied by low levels of high-density lipoprotein cholesterol (HDL-C) 3). Patients with this type of dyslipidemia often have comorbidities that make them highly vulnerable to cardiovascular events, and effective therapeutic strategies must manage TG and HDL-C levels in addition to LDL-C levels3, 4).
Fibrates, which activate peroxisome proliferator-activated receptor alpha (PPARα), can improve TG and HDL-C levels5). Fenofibrate, in particular, has been commonly used worldwide for this purpose. Clinical trials of fenofibrate and other fibrates have shown that TG levels decreased by about 25% to 50% and that HDL-C levels increased by 5% to 20%6–8), and some data suggest that fibrates can reduce the risk of cardiovascular events8, 9). For fenofibrate, the greatest risk reduction occurs in patients who have high TG (> 200 mg/dL) and low HDL-C (< 35 mg/dL) levels at the start of treatment8, 10, 11).
However, fibrates, including fenofibrate, have been associated with increased risk of liver damage12) and increased levels of serum creatinine, which is an indicator of kidney damage13). Most fibrates are excreted through the kidneys, and excretion is reduced in patients with compromised kidney function8, 13). According to the National Kidney Foundation, fenofibrate and several other fibrates are contraindicated in patients with abnormal kidney function test results13, 14). Fibrates can also affect the liver drug-metabolizing enzyme activity and therefore interact with other drugs such as gemfibrozil and statins8, 15).
Pemafibrate (K-877) is a novel selective PPARα modulator (SPPARMα) with higher potency and selectivity for PPARα activation than fenofibrate3, 16, 17). Pemafibrate was identified from several candidate compounds with excellent potency and selectivity for PPARα as exerting more TG-reducing and HDL-C-increasing effects, but fewer adverse effects of increasing liver weight, than fenofibrate in animal studies18). Phase II and III studies have also shown promising safety and efficacy results19, 20). Pemafibrate was well tolerated, with no notable adverse effects on liver or renal function3, 19, 20). The incidence of liver- and kidney-related adverse events (AEs) was less in the pemafibrate groups than in the fenofibrate groups in these trials19). In addition, it has been reported that pemafibrate attenuated postprandial hypertriglyceridemia in laboratory animals (mice)21). A recent study has suggested that postprandial hypertriglyceridemia is related to the accumulation of TG-rich lipoproteins and their remnants, which have atherogenic effects22).
Available preclinical and clinical data on pemafibrate suggest that this new drug, with its favorable benefit–risk balance, is more effective than conventional PPARα agonists. The current study was designed to further evaluate the effects of pemafibrate on TG levels in patients with high TG and low HDL-C levels. In particular, this trial compared the efficacy and safety of pemafibrate to the maximum dose of fenofibrate (200 mg/day).
Aim
The objectives of this phase III study were to verify 1) the superiority of three doses of pemafibrate over placebo and 2) the non-inferiority of pemafibrate to the maximum dose of fenofibrate (200 mg/day) for reducing TG levels. The incidence of AEs and adverse drug reactions (ADRs) was investigated as the primary safety endpoint.
Methods
Trial Design
This phase III, placebo/active drug-controlled, randomized, double-blind, parallel group comparison study was conducted in Japan in accordance with the Declaration of Helsinki and in compliance with the study protocol and Good Clinical Practice. Ethical approval was obtained from the Institutional Review Board at each trial center.
Patients
Patients with dyslipidemia, high TG levels, and low HDL-C levels were enrolled. All patients provided written informed consent before participation. After providing written consent to participate, they underwent laboratory testing twice during the screening period (within 8 weeks) to determine eligibility. Men or postmenopausal women age 20 to 74 years who had received dietary and exercise counseling for 12 weeks were eligible if two consecutive tests showed a serum TG level of > 200 mg/dL and serum HDL-C level of < 50 mg/dL for men and < 55 mg/dL for women.
Patients with serum TG level of > 1000 mg/dL were excluded, along with patients requiring other lipid-lowering medications during the trial; patients with type 1 diabetes, poorly controlled type 2 diabetes (HbA1c ≥ 8.4%), poorly controlled thyroid disease, poorly controlled hypertension (systolic blood pressure ≥ 160 mmHg or diastolic blood pressure ≥ 100 mmHg), renal dysfunction (serum creatinine level ≥ 1.5 mg/dL), or gallbladder disease or history of gallstones; patients with elevated liver enzyme levels (twice the upper limit of the normal range [ULN]), low hemoglobin levels (below 12 g/dL for men and 11 g/dL for women), or low fibrinogen levels (below the lower limit of the normal range [LLN]); patients with a recent history of myocardial infarction (within 3 months prior to consent) or heart failure; or those with a malignant tumor.
Study Drug Administration
Eligible patients were randomly assigned to one of six groups at an assignment ratio of 1:1:3:2:2:3: placebo, pemafibrate 0.1 mg/day (50 µg bid), pemafibrate 0.2 mg/day (100 µg bid), pemafibrate 0.4 mg/day (200 µg bid), fenofibrate 100 mg/day (100 mg qd), or fenofibrate 200 mg/day (200 mg qd) (Fig. 1). This study used micronized fenofibrate capsules. The 100-mg micronized fenofibrate capsule was bioequivalent to an 80-mg fenofibrate tablet. Pemafibrate was administered in tablet form. The double-dummy design was used for blinding of the investigational product: patients in all groups took the same number of preparations with the same appearance using indistinguishable pemafibrate and placebo tablets and indistinguishable fenofibrate and placebo capsules. The drug administration period was 12 weeks with 4-week follow-up period.
Fig. 1.
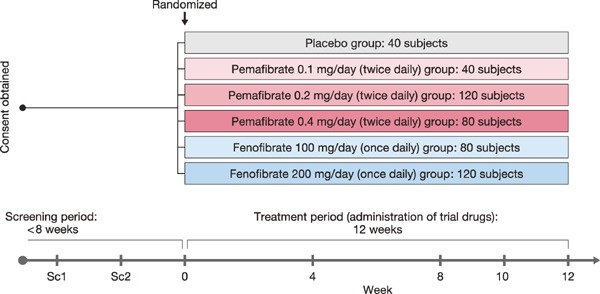
Study design
Patients were randomly assigned to one of six groups (placebo, three doses of pemafibrate, and two doses of fenofibrate).
Sample Collection and Assessment
Blood and urine were collected for endpoint analysis at the two screening visits and at weeks 0, 4, 8, 10, and 12 of treatment. Mean baseline values were obtained using the results from two screening tests and measurements at week 0 for fasting serum TG, HDL-C (direct method), total cholesterol (TC), LDL-C (direct method), and non-HDL-C (direct method). Other parameters used measurements at treatment week 0 as baseline.
Randomization and Blinding
Randomization was performed by a third party responsible for allocation. Patient allocation was performed by the Patient Registration Center based on the provisional/final registration information and test results, and the trial drugs were prescribed according to the drug numbers indicated by the Patient Registration Center. Double blinding was implemented as follows: the person responsible for drug allocation prepared a key code and stored it until the key was opened. The key was opened after database locking.
Endpoints
The primary efficacy endpoint was the percent change in fasting serum TG levels from baseline to week 8, 10, and 12 after the start of treatment. The secondary efficacy endpoints were changes and percent changes in other parameters from baseline to the end of treatment, including HDL-C, TC, LDL-C, non-HDLC, very-low-density lipoprotein cholesterol (VLDL-C), remnant lipoprotein cholesterol (RemL-C), apolipoprotein, glucose, and insulin levels and the homeostasis model assessment for insulin resistance (HOMA-R).
The primary safety endpoint was the incidence of AEs and ADRs. Secondary endpoints included (1) the percentages of patients who had aspartate aminotransferase (AST), alanine aminotransferase (ALT), creatine kinase (CK), or serum creatinine levels exceeding the cut-off levels (> 3× and > 5× ULN for AST and ALT; > 2.5× and > 5× ULN for CK; > 1.5 and > 2.0 mg/dL for serum creatinine) or those who had fibrinogen or hemoglobin levels below the cut-off levels (1×, 0.75×, and 0.5× LLN for fibrinogen and 10.0, 8.0, and 6.5 g/dL for hemoglobin) during treatment and (2) changes from week 0 in physiological and clinical test levels (AST, ALT, gamma-glutamyl transpeptidase [γ-GT], CK, and serum creatinine levels and (in posthoc analysis) estimated glomerular filtration rate [eGFR]).
Sample Size
The sample size was determined using the results of a previous phase II study20). To reproduce the previous findings, the study design called for at least 29 patients per group, which is the same number as that in the phase II study. Under these circumstances, to achieve at least 90% power in the primary analysis, the required number of patients was determined to be 29 in the placebo and pemafibrate 0.1 mg/day groups, 97 in the pemafibrate 0.2 mg/day group, 68 in the pemafibrate 0.4 mg/day group, and 97 in the fenofibrate 200 mg/day group. The target number of patients in the fenofibrate 100 mg/day group was set to the same number as that in the pemafibrate 0.4 mg/day group to clearly define the effects of pemafibrate. Finally, to accommodate potential discontinuations/drop-outs and the pre-established allocation ratio (1:1: 3:2:2:3), the following numbers were targeted: 40 in the placebo group, 40 in the pemafibrate 0.1 mg/day group, 120 in the pemafibrate 0.2 mg/day group, 80 in the pemafibrate 0.4 mg/day group, 80 in the fenofibrate 100 mg/day group, and 120 in the fenofibrate 200 mg/day group.
Statistical Analysis
Statistical analysis used a significance level of 5% and a confidence coefficient of 95% on both sides. Efficacy analysis set included all patients who were randomized, had at least one dose of the trial drug, and had baseline and post-baseline efficacy measurements. The safety analysis set included all patients who were randomized and had at least one dose of the trial drug.
For primary analysis of the primary efficacy endpoint, the confirmation of a dose–response relationship and assessment of non-inferiority were conducted with the closed testing procedure. To examine the dose–response relationship and superiority over the placebo group, each pemafibrate dose group was compared to the placebo group. In each examination, homogeneity of variance between the placebo and active drug groups was not assumed. The non-inferiority margin was set at 10%. There were four steps in this closed procedure. First, to test whether there was a dose–response relationship using the maximum contrast method, repeated measures analysis of covariance (ANCOVA) was performed on the percent change in fasting serum TG level with baseline as the covariate and weeks 8, 10, and 12 as repeated time points. If those results were significant, the second step was Dunnett's test to compare the three pemafibrate groups with the placebo group. If those results were significant, the third step was to assess the non-inferiority of pemafibrate 0.4 mg/day to fenofibrate 200 mg/day. Fourth, the non-inferiority of pemafibrate 0.2 mg/day was compared with fenofibrate 200 mg/day. Secondary assessments were implemented to test the superiority of pemafibrate 0.2 mg/day and pemafibrate 0.4 mg/day over fenofibrate 200 mg/day and to test the non-inferiority (and superiority, if non-inferiority was established) for each pemafibrate dose to fenofibrate 100 mg/day.
For the secondary efficacy endpoints, the levels of the other parameters at the completion of the treatment period were compared to baseline levels. For each group, one-sample t-test was used for determining the change or percent change from baseline and two-sample t-test was used to compare those changes between each pemafibrate group and placebo or each fenofibrate group.
For the analysis of the primary safety endpoints, Fisher's exact test was performed to compare the incidence of AEs and ADRs in each pemafibrate group and placebo or each fenofibrate group and the 95% confidence intervals (CIs) of the differences in incidence were calculated. The dose–response relationship for incidence was examined using the Cochran–Armitage test.
For the secondary safety endpoints, the percentage of patients whose AST, ALT, CK, or serum creatinine levels exceeded the cut-off value or whose fibrinogen and hemoglobin levels fell below the cut-off value were calculated. The Wilcoxon signed-rank test was performed to assess changes at each time point.
Results
Patients
Patients were enrolled from May 14 to December 27, 2012, in a total of 32 medical institutions in Japan. Informed consent was obtained from 854 patients, 526 were randomized to the treatment group, and 489 completed the study (Fig. 2). Most patients who provided informed consent but were not randomized did not meet the inclusion criteria or satisfied the exclusion criteria based on laboratory test results during the screening period. The drop-out rate was highest in the fenofibrate groups. The trial was discontinued in 0 patients in the placebo group, 3 of 45 (6.7%) patients in the pemafibrate 0.1 mg/day group, 7 of 128 (5.5%) patients in the pemafibrate 0.2 mg/day group, 5 of 85 (5.9%) patients in the pemafibrate 0.4 mg/day group, 7 of 85 (8.2%) patients in the fenofibrate 100 mg/day group, and 15 of 140 (10.7%) patients in the fenofibrate 200 mg/day group.
Fig. 2.
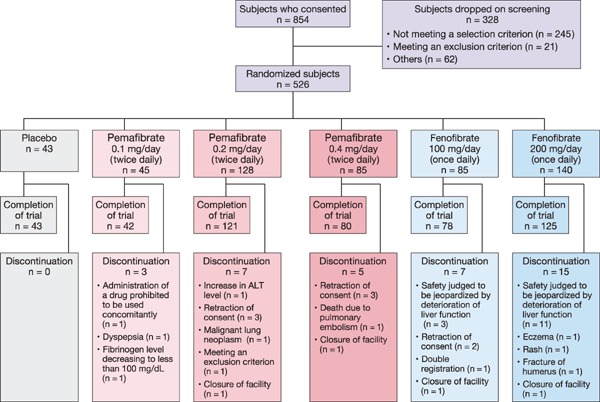
Disposition of patients
Baseline demographics were similar in all treatment groups (Table 1). The mean (standard deviation [SD]) age was 50.3 (10.2) years. Most patients were men (91.2%; 479/525). The mean (SD) body mass index was 26.7 (3.7) kg/m2. Type 2 diabetes was present in 15.2% (80 of 525) of the patients. The mean (SD) level for TG was 355.6 (138.3) mg/dL, for HDL-C was 38.9 (5.2) mg/dL, and for LDL-C was 131.5 (35.4) mg/dL.
Table 1. Patient Characteristics.
| Placebo | Pemafibrate |
Fenofibrate |
||||
|---|---|---|---|---|---|---|
| 0.1 mg/day | 0.2 mg/day | 0.4 mg/day | 100 mg/day | 200 mg/day | ||
| (N = 43) | (N = 45) | (N = 128) | (N = 84) | (N = 85) | (N = 140) | |
| Age, year | 49.6 ± 10.2 | 50.1 ± 10.5 | 50.7 ± 10.6 | 50.8 ± 10.1 | 48.9 ± 10.1 | 50.8 ± 9.8 |
| Male, n (%) | 38 (88.4) | 44 (97.8) | 114 (89.1) | 82 (97.6) | 76 (89.4) | 125 (89.3) |
| BMI, kg/m2 | 26.9 ± 3.7 | 26.9 ± 3.4 | 26.9 ± 3.6 | 26.6 ± 3.6 | 26.6 ± 3.5 | 26.6 ± 4.1 |
| Type 2 diabetes, n (%) | 7 (16.3) | 4 (8.9) | 24 (18.8) | 15 (17.9) | 11 (12.9) | 19 (13.6) |
| Hypertension, n (%) | 15 (34.9) | 12 (26.7) | 44 (34.4) | 17 (20.2) | 23 (27.1) | 43 (30.7) |
| Fatty liver, n (%) | 13 (30.2) | 11 (24.4) | 35 (27.3) | 20 (23.8) | 21 (24.7) | 29 (20.7) |
| TG, mg/dL | 346.1 ± 130.9 | 332.4 ± 106.1 | 367.2 ± 153.6 | 362.6 ± 158.5 | 362.0 ± 135.1 | 347.3 ± 123.8 |
| HDL-C*, mg/dL | 38.9 ± 4.5 | 38.3 ± 5.0 | 39.1 ± 5.5 | 37.8 ± 5.2 | 39.3 ± 5.4 | 39.4 ± 4.8 |
| LDL-C**, mg/dL | 133.8 ± 33.9 | 128.5 ± 36.9 | 131.4 ± 35.5 | 125.9 ± 33.5 | 133.8 ± 35.9 | 133.8 ± 36.1 |
| Non-HDL-C*, mg/dL | 183.5 ± 32.5 | 176.6 ± 35.2 | 185.5 ± 35.0 | 178.4 ± 35.3 | 186.0 ± 31.9 | 184.8 ± 34.2 |
| HbA1c, % | 6.0 ± 0.5 | 5.9 ± 0.6 | 6.0 ± 0.6 | 6.0 ± 0.7 | 5.8 ± 0.6 | 6.0 ± 0.6 |
Data are presented as mean ± SD for continuous parameters and the number of patients (%) for categorical parameters.
Direct method-Metabo Lead
Direct method
BMI, body mass index; TG, triglyceride; HDL-C, high-density lipoprotein cholesterol; LDL-C, low-density lipoprotein cholesterol; HbA1c, hemoglobin A1c; SD, standard deviation
Efficacy
For primary endpoint assessment, repeated measures ANCOVA was performed for fasting serum TG levels using baseline as the covariate and weeks 8, 10, and 12 as repetition points. Fasting serum TG levels decreased in all pemafibrate and fenofibrate treatment groups. The percent change in TG levels was analyzed using the aforementioned closed procedure. When the dose–response relationship was analyzed in the placebo and pemafibrate dose groups, all contrasts were significant (P < 0.001) (Supplementary Table 1). The contrast coefficient matrix of (−5, −1, 3, 3) was selected by the maximum contrast method and confirmed a dose–response relationship. The superiority of all pemafibrate dose groups over the placebo group was also confirmed (Dunnett's test, P < 0.001) (Supplementary Table 2).
Supplementary Table 1. Percent Change in TG (Analysis of Dose-Response Relationship).
| Least squares | 95%CI | P value | |
|---|---|---|---|
| Placebo | −2.8 ± 4.5 | −11.8, 6.2 | 0.538 |
| Pemafibrate 0.1 mg/day | −46.3 ± 2.8 | −51.8, −40.9 | < 0.001 |
| Pemafibrate 0.2 mg/day | −46.8 ± 1.6 | −50.0, −43.5 | < 0.001 |
| Pemafibrate 0.4 mg/day | −51.9 ± 2.0 | −55.8, −48.0 | < 0.001 |
| Contrast | F value | P value | Adjusted P value* |
|---|---|---|---|
| (−3 −1 1 3) | 96.7 | < 0.001 | |
| (−5 −1 3 3) | 98.2 | < 0.001 | < 0.001 |
| (−3 1 1 1) | 96.6 | < 0.001 |
Data are presented as least squares mean ± SE.
Multiplicity adjusted (contrast: maximum contrast method)
TG, triglyceride; CI, confidence interval; SE, standard error
Supplementary Table 2. Percent Change in TG (Pemafibrate Dose Groups vs. Placebo).
| Difference | 95%CI | Adjusted 95%CI | P value | Adjusted P value* | |
|---|---|---|---|---|---|
| Pemafibrate 0.1 mg/day | −43.6 ± 5.2 | −54.0, −33.1 | −56.2, −30.9 | < 0.001 | < 0.001 |
| Pemafibrate 0.2 mg/day | −44.0 ± 4.8 | −53.5, −34.5 | −55.5, −32.5 | < 0.001 | < 0.001 |
| Pemafibrate 0.4 mg/day | −49.1 ± 4.9 | −58.9, −39.3 | −60.9, −37.3 | < 0.001 | < 0.001 |
Data are presented as least squares mean ± SE.
Multiplicity adjusted (difference in LS-means: Dunnett)
TG, triglyceride; CI, confidence interval; SE, standard error; LS, least squares
The percent change in TG levels ranged from −46% to −52% in pemafibrate groups (Fig. 3). The change in the pemafibrate 0.4 mg/day group was confirmed to be non-inferior to that in the fenofibrate 200 mg/day group, with the upper limit of the 95% CI of the between-group difference less than 10%, the non-inferiority margin (−0.3% [95% CI: −5.3%, 4.7%], P = 0.906). Similarly, the non-inferiority of pemafibrate 0.2 mg/day to fenofibrate 200 mg/day was confirmed (4.8% [95% CI: 0.4%, 9.3%], P = 0.033). No superiority was confirmed in the pemafibrate 0.2 mg/day or 0.4 mg/day groups compared with the fenofibrate 200 mg/day group. The pemafibrate 0.1, 0.2 and 0.4 mg/day groups were confirmed to be non-inferior and superior (−8.0% [95% CI: −14.7%, −1.3%], P = 0.020; −8.4% [95% CI: −13.5%, −3.3%], P = 0.001; and −13.6% [95% CI: −19.2%, −8.0%], P < 0.001, respectively) to the fenofibrate 100 mg/day group.
Fig. 3.
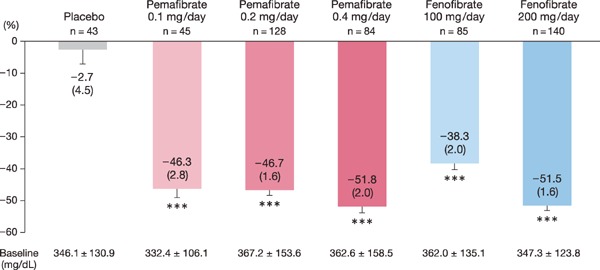
Percent change in TG levels
In repeated measures analysis of covariance (baseline as the covariate and weeks 8, 10, and 12 as repetition points). Data are presented as LS mean (SE). ***: P < 0.001 vs. baseline.
LS, least squares; SE, standard error
The results of the secondary efficacy endpoints are summarized in Table 2. HDL-C, apolipoprotein A-I (ApoA-I), ApoA-II, and LDL-C levels increased and VLDL-C, RemL-C, ApoB48, ApoC-II, ApoC-III, and ApoC-III/ApoC-II levels decreased in all pemafibrate and fenofibrate groups. Non-HDL-C levels decreased in all groups other than the pemafibrate 0.4 mg/day group, and TC, ApoB, and ApoB100 levels decreased in the fenofibrate 200 mg/day group. Fasting plasma glucose levels decreased in the pemafibrate 0.4 mg/day and fenofibrate 200 mg/day groups, fasting insulin levels decreased in the pemafibrate 0.2 and 0.4 mg/day groups, and HOMA-R decreased in the pemafibrate 0.2 mg/day group.
Table 2. Changes in Lipid and Glucose Metabolism During the 12-Week Treatment Period (LOCF).
| Placebo | Pemafibrate |
Fenofibrate |
||||
|---|---|---|---|---|---|---|
| 0.1 mg/day | 0.2 mg/day | 0.4 mg/day | 100 mg/day | 200 mg/day | ||
| (N = 43) | (N = 45) | (N = 128) | (N = 84) | (N = 85) | (N = 140) | |
| HDL-C, mg/dL† | ||||||
| n | 43 | 45 | 128 | 84 | 85 | 140 |
| Baseline | 38.9 ± 4.5 | 38.3 ± 5.0 | 39.1 ± 5.5 | 37.8 ± 5.2 | 39.3 ± 5.4 | 39.4 ± 4.8 |
| Week 12 | 39.0 ± 5.6 | 46.3 ± 8.3 | 47.3 ± 8.4 | 44.9 ± 8.3 | 45.2 ± 8.4 | 49.0 ± 9.7 |
| %Change | 0.4 ± 9.5 | 20.9 ± 14.0*** | 21.4 ± 16.7*** | 19.1 ± 17.1*** | 15.2 ± 14.8*** | 24.7 ± 21.4*** |
| P vs. placebo | < 0.001 | < 0.001 | < 0.001 | < 0.001 | < 0.001 | |
| P vs. fenofibrate 100 mg/day | 0.073 | 0.011 | 0.144 | |||
| P vs. fenofibrate 200 mg/day | 0.206 | 0.123 | 0.020 | |||
| TC, mg/dL | ||||||
| n | 43 | 45 | 128 | 84 | 85 | 140 |
| Baseline | 222.4 ± 33.1 | 214.9 ± 36.8 | 224.6 ± 36.2 | 216.2 ± 36.6 | 225.3 ± 34.4 | 224.2 ± 35.4 |
| Week 12 | 220.9 ± 30.1 | 212.3 ± 35.4 | 224.0 ± 37.5 | 216.0 ± 35.8 | 225.0 ± 35.4 | 212.5 ± 36.1 |
| %Change | −0.1 ± 9.0 | −0.5 ± 11.5 | 0.4 ± 11.5 | 1.0 ± 14.6 | 0.3 ± 9.2 | −4.5 ± 12.7*** |
| P vs. placebo | 0.898 | 0.811 | 0.609 | 0.863 | 0.034 | |
| P vs. fenofibrate 100 mg/day | 0.746 | 0.945 | 0.679 | |||
| P vs. fenofibrate 200 mg/day | 0.045 | < 0.001 | < 0.001 | |||
| LDL-C, mg/dL | ||||||
| n | 43 | 45 | 128 | 84 | 85 | 140 |
| Baseline | 133.8 ± 33.9 | 128.5 ± 36.9 | 131.4 ± 35.5 | 125.9 ± 33.5 | 133.8 ± 35.9 | 133.8 ± 36.1 |
| Week 12 | 131.8 ± 33.3 | 139.5 ± 33.9 | 148.5 ± 33.3 | 144.3 ± 33.0 | 147.2 ± 32.7 | 136.9 ± 33.5 |
| %Change | −0.8 ± 15.8 | 13.2 ± 24.6*** | 18.6 ± 34.1*** | 19.3 ± 30.9*** | 14.0 ± 24.1*** | 6.6 ± 28.2** |
| P vs. placebo | 0.022 | < 0.001 | < 0.001 | 0.006 | 0.137 | |
| P vs. fenofibrate 100 mg/day | 0.886 | 0.243 | 0.229 | |||
| P vs. fenofibrate 200 mg/day | 0.179 | < 0.001 | 0.001 | |||
| Non-HDL-C, mg/dL† | ||||||
| n | 43 | 45 | 128 | 84 | 85 | 140 |
| Baseline | 183.5 ± 32.5 | 176.6 ± 35.2 | 185.5 ± 35.0 | 178.4 ± 35.3 | 186.0 ± 31.9 | 184.8 ± 34.2 |
| Week 12 | 181.9 ± 30.3 | 166.0 ± 35.6 | 176.7 ± 38.1 | 171.1 ± 35.7 | 179.8 ± 33.6 | 163.5 ± 35.3 |
| %Change | −0.1 ± 11.2 | −5.1 ± 14.0* | −4.0 ± 14.5** | −2.7 ± 17.4 | −2.9 ± 11.6* | −10.7 ± 15.5*** |
| P vs. placebo | 0.107 | 0.129 | 0.341 | 0.318 | < 0.001 | |
| P vs. fenofibrate 100 mg/day | 0.395 | 0.562 | 0.958 | |||
| P vs. fenofibrate 200 mg/day | 0.027 | < 0.001 | < 0.001 | |||
| VLDL-C, mg/dL†† | ||||||
| n | 43 | 45 | 125 | 83 | 84 | 139 |
| Baseline | 43.5 ± 17.5 | 40.8 ± 11.7 | 45.4 ± 19.2 | 45.0 ± 17.8 | 45.9 ± 15.4 | 44.6 ± 16.5 |
| Week 12 | 44.8 ± 17.5 | 23.8 ± 11.4 | 23.6 ± 10.8 | 21.9 ± 11.2 | 31.4 ± 12.8 | 21.7 ± 10.9 |
| %Change | 8.6 ± 45.0 | −40.4 ± 24.6*** | −44.1 ± 24.4*** | −47.1 ± 28.1*** | −29.5 ± 23.5*** | −47.8 ± 26.0*** |
| P vs. placebo | < 0.001 | < 0.001 | < 0.001 | < 0.001 | < 0.001 | |
| P vs. fenofibrate 100 mg/day | 0.034 | < 0.001 | < 0.001 | |||
| P vs. fenofibrate 200 mg/day | 0.115 | 0.276 | 0.852 | |||
| RemL-C, mg/dL | ||||||
| n | 42 | 45 | 122 | 82 | 83 | 138 |
| Baseline | 23.8 ± 12.5 | 24.2 ± 13.2 | 27.1 ± 18.0 | 27.4 ± 19.1 | 27.1 ± 13.5 | 26.1 ± 14.5 |
| Week 12 | 25.2 ± 13.7 | 11.7 ± 7.6 | 11.7 ± 6.9 | 11.0 ± 6.6 | 16.3 ± 9.0 | 11.4 ± 6.7 |
| %Change | 18.4 ± 76.0 | −46.8 ± 31.3*** | −47.6 ± 30.9*** | −50.3 ± 32.7*** | −34.5 ± 29.8*** | −49.3 ± 31.6*** |
| P vs. placebo | < 0.001 | < 0.001 | < 0.001 | < 0.001 | < 0.001 | |
| P vs. fenofibrate 100 mg/day | 0.073 | 0.013 | 0.006 | |||
| P vs. fenofibrate 200 mg/day | 0.699 | 0.712 | 0.852 | |||
| ApoA-I, mg/dL | ||||||
| n | 42 | 45 | 123 | 82 | 83 | 138 |
| Baseline | 124.9 ± 11.0 | 124.9 ± 10.3 | 127.7 ± 13.4 | 124.4 ± 11.7 | 127.6 ± 14.0 | 127.8 ± 11.8 |
| Week 12 | 125.5 ± 10.5 | 133.7 ± 12.4 | 137.3 ± 14.6 | 132.3 ± 14.1 | 133.1 ± 14.7 | 139.2 ± 15.4 |
| %Change | 0.8 ± 7.3 | 7.3 ± 7.8*** | 7.9 ± 9.5*** | 6.7 ± 10.3*** | 4.9 ± 10.9*** | 9.2 ± 10.9*** |
| P vs. placebo | 0.003 | < 0.001 | 0.002 | 0.033 | < 0.001 | |
| P vs. fenofibrate 100 mg/day | 0.196 | 0.031 | 0.236 | |||
| P vs. fenofibrate 200 mg/day | 0.251 | 0.294 | 0.071 | |||
| ApoA-II, mg/dL | ||||||
| n | 42 | 45 | 123 | 82 | 83 | 138 |
| Baseline | 29.8 ± 2.8 | 29.2 ± 3.9 | 30.5 ± 3.8 | 29.3 ± 3.6 | 30.1 ± 3.6 | 29.9 ± 3.4 |
| Week 12 | 29.5 ± 3.1 | 33.8 ± 4.5 | 36.8 ± 4.7 | 37.4 ± 4.8 | 34.8 ± 5.3 | 38.8 ± 6.4 |
| %Change | −0.8 ± 9.2 | 16.5 ± 11.6*** | 21.5 ± 15.8*** | 28.7 ± 17.3*** | 15.8 ± 14.5*** | 30.4 ± 19.7*** |
| P vs. placebo | < 0.001 | < 0.001 | < 0.001 | < 0.001 | < 0.001 | |
| P vs. fenofibrate 100 mg/day | 0.817 | 0.014 | < 0.001 | |||
| P vs. fenofibrate 200 mg/day | < 0.001 | < 0.001 | 0.455 | |||
| ApoB, mg/dL | ||||||
| n | 42 | 45 | 123 | 82 | 83 | 138 |
| Baseline | 112.4 ± 19.2 | 105.9 ± 19.4 | 111.2 ± 21.2 | 105.6 ± 21.5 | 111.6 ± 18.8 | 110.8 ± 21.4 |
| Week 12 | 111.1 ± 16.6 | 105.1 ± 21.7 | 109.5 ± 21.7 | 107.5 ± 22.1 | 111.8 ± 19.0 | 101.3 ± 21.6 |
| %Change | −0.3 ± 10.7 | 0.3 ± 15.5 | −0.4 ± 16.3 | 3.2 ± 18.8 | 1.2 ± 14.2 | −7.3 ± 17.2*** |
| P vs. placebo | 0.880 | 0.971 | 0.258 | 0.627 | 0.014 | |
| P vs. fenofibrate 100 mg/day | 0.747 | 0.488 | 0.431 | |||
| P vs. fenofibrate 200 mg/day | 0.007 | 0.001 | < 0.001 | |||
| ApoB48, µg/mL | ||||||
| n | 43 | 45 | 126 | 83 | 84 | 139 |
| Baseline | 9.3 ± 5.2 | 10.4 ± 6.3 | 11.7 ± 9.3 | 12.1 ± 9.1 | 11.9 ± 8.4 | 11.2 ± 7.8 |
| Week 12 | 9.8 ± 6.5 | 4.7 ± 3.8 | 4.3 ± 2.9 | 4.0 ± 2.7 | 5.9 ± 3.9 | 4.3 ± 3.5 |
| %Change | 21.3 ± 94.1 | −46.6 ± 48.9*** | −51.5 ± 32.5*** | −59.0 ± 25.5*** | −40.1 ± 33.1*** | −51.4 ± 46.6*** |
| P vs. placebo | < 0.001 | < 0.001 | < 0.001 | < 0.001 | < 0.001 | |
| P vs. fenofibrate 100 mg/day | 0.438 | 0.076 | 0.007 | |||
| P vs. fenofibrate 200 mg/day | 0.539 | 0.988 | 0.229 | |||
| ApoB100, mg/dL | ||||||
| n | 42 | 45 | 123 | 82 | 83 | 138 |
| Baseline | 111.4 ± 19.3 | 104.8 ± 19.4 | 110.1 ± 21.3 | 104.4 ± 21.6 | 110.4 ± 19.0 | 109.7 ± 21.6 |
| Week 12 | 110.1 ± 16.5 | 104.6 ± 21.6 | 109.1 ± 21.6 | 107.1 ± 22.1 | 111.2 ± 18.9 | 100.9 ± 21.6 |
| %Change | −0.3 ± 10.7 | 0.9 ± 15.7 | 0.3 ± 16.8 | 4.1 ± 19.1 | 1.8 ± 14.5 | −6.7 ± 17.5*** |
| P vs. placebo | 0.755 | 0.839 | 0.170 | 0.506 | 0.028 | |
| P vs. fenofibrate 100 mg/day | 0.750 | 0.528 | 0.387 | |||
| P vs. fenofibrate 200 mg/day | 0.008 | 0.001 | < 0.001 | |||
| ApoC-II, mg/dL | ||||||
| n | 42 | 45 | 123 | 82 | 83 | 138 |
| Baseline | 7.7 ± 2.4 | 7.3 ± 1.7 | 8.6 ± 3.4 | 8.3 ± 3.9 | 8.6 ± 2.8 | 7.8 ± 2.4 |
| Week 12 | 8.3 ± 2.7 | 6.5 ± 1.9 | 6.8 ± 2.5 | 6.5 ± 2.4 | 7.7 ± 2.7 | 6.2 ± 2.0 |
| %Change | 9.6 ± 24.9* | −10.9 ± 20.2*** | −17.3 ± 23.1*** | −16.7 ± 28.1*** | −8.0 ± 22.9** | −17.7 ± 19.9*** |
| P vs. placebo | < 0.001 | < 0.001 | < 0.001 | < 0.001 | < 0.001 | |
| P vs. fenofibrate 100 mg/day | 0.491 | 0.004 | 0.015 | |||
| P vs. fenofibrate 200 mg/day | 0.088 | 0.908 | 0.759 | |||
| ApoC-III, mg/dL | ||||||
| n | 42 | 45 | 123 | 82 | 83 | 138 |
| Baseline | 15.6 ± 5.0 | 15.1 ± 4.2 | 17.3 ± 6.4 | 16.5 ± 6.9 | 17.3 ± 5.8 | 16.5 ± 4.8 |
| Week 12 | 17.1 ± 7.1 | 11.3 ± 3.8 | 11.1 ± 3.8 | 9.9 ± 3.5 | 13.5 ± 5.2 | 10.5 ± 3.1 |
| %Change | 12.1 ± 43.0 | −22.9 ± 26.8*** | −31.9 ± 22.6*** | −36.3 ± 19.6*** | −20.0 ± 22.9*** | −33.5 ± 17.9*** |
| P vs. placebo | < 0.001 | < 0.001 | < 0.001 | < 0.001 | < 0.001 | |
| P vs. fenofibrate 100 mg/day | 0.509 | < 0.001 | < 0.001 | |||
| P vs. fenofibrate 200 mg/day | 0.009 | 0.577 | 0.404 | |||
| ApoC-III/C-II | ||||||
| n | 42 | 45 | 123 | 82 | 83 | 138 |
| Baseline | 2.1 ± 0.4 | 2.1 ± 0.4 | 2.1 ± 0.6 | 2.0 ± 0.5 | 2.0 ± 0.5 | 2.2 ± 0.5 |
| Week 12 | 2.0 ± 0.4 | 1.8 ± 0.4 | 1.7 ± 0.5 | 1.6 ± 0.4 | 1.8 ± 0.5 | 1.7 ± 0.4 |
| %Change | 1.0 ± 23.5 | −13.2 ± 21.0*** | −16.7 ± 17.7*** | −21.4 ± 16.4*** | −12.2 ± 16.4*** | −18.4 ± 16.2*** |
| P vs. placebo | < 0.001 | < 0.001 | < 0.001 | < 0.001 | < 0.001 | |
| P vs. fenofibrate 100 mg/day | 0.781 | 0.081 | 0.001 | |||
| P vs. fenofibrate 200 mg/day | 0.088 | 0.439 | 0.219 | |||
| Glucose, mg/dL | ||||||
| n | 43 | 45 | 125 | 83 | 84 | 139 |
| Baseline | 107.9 ± 15.9 | 102.3 ± 14.7 | 109.2 ± 20.8 | 109.2 ± 23.1 | 106.4 ± 17.8 | 108.0 ± 17.8 |
| Week 12 | 109.5 ± 18.2 | 103.2 ± 14.2 | 107.3 ± 22.7 | 103.5 ± 18.4 | 105.3 ± 16.3 | 104.7 ± 18.1 |
| Change | 1.7 ± 10.9 | 0.9 ± 7.0 | −2.0 ± 11.7 | −5.7 ± 16.4** | −1.2 ± 11.0 | −3.3 ± 11.2*** |
| P vs. placebo | 0.752 | 0.084 | 0.001 | 0.206 | 0.018 | |
| P vs. fenofibrate 100 mg/day | 0.358 | 0.628 | 0.015 | |||
| P vs. fenofibrate 200 mg/day | 0.043 | 0.374 | 0.150 | |||
| Insulin, µU/mL | ||||||
| n | 42 | 44 | 122 | 81 | 82 | 135 |
| Baseline | 10.8 ± 5.6 | 10.7 ± 6.9 | 13.0 ± 11.8 | 13.4 ± 17.8 | 12.7 ± 11.1 | 13.9 ± 20.0 |
| Week 12 | 11.5 ± 8.9 | 9.7 ± 5.3 | 11.2 ± 8.4 | 9.3 ± 5.8 | 10.5 ± 4.8 | 11.7 ± 12.3 |
| Change | 0.7 ± 7.5 | −1.0 ± 5.8 | −1.8 ± 8.9* | −4.1 ± 16.5* | −2.1 ± 10.5 | −2.2 ± 15.6 |
| P vs. placebo | 0.526 | 0.255 | 0.040 | 0.220 | 0.179 | |
| P vs. fenofibrate 100 mg/day | 0.608 | 0.840 | 0.314 | |||
| P vs. fenofibrate 200 mg/day | 0.563 | 0.789 | 0.276 | |||
| HOMA-R | ||||||
| n | 42 | 44 | 122 | 81 | 82 | 135 |
| Baseline | 2.9 ± 1.7 | 2.8 ± 2.3 | 3.8 ± 5.0 | 4.2 ± 8.8 | 3.6 ± 4.1 | 4.1 ± 7.9 |
| Week 12 | 3.3 ± 3.6 | 2.6 ± 1.5 | 3.2 ± 4.2 | 2.5 ± 1.9 | 2.8 ± 1.7 | 3.2 ± 3.9 |
| Change | 0.4 ± 3.1 | −0.3 ± 1.7 | −0.6 ± 2.9* | −1.8 ± 8.5 | −0.7 ± 3.8 | −0.9 ± 6.2 |
| P vs. placebo | 0.553 | 0.306 | 0.031 | 0.264 | 0.162 | |
| P vs. fenofibrate 100 mg/day | 0.652 | 0.839 | 0.207 | |||
| P vs. fenofibrate 200 mg/day | 0.491 | 0.606 | 0.248 | |||
P value vs. placebo and against fenofibrate 100 mg/day and 200 mg/day were calculated using the 2-sample t-test.
Data are presented as mean ± SD for continuous parameters. Here, n is the number of subjects who had both baseline and post baseline measurements.
P < 0.05,
P < 0.01,
P < 0.001 vs. baseline (1-sample t-test).
Direct method-Metabo Lead
Ultracentrifugation
HDL-C, high-density lipoprotein cholesterol; TC, total cholesterol; LDL-C, low-density lipoprotein cholesterol; VLDL-C, very-low-density lipoprotein cholesterol; RemL-C, remnant lipoprotein cholesterol; Apo, apolipoprotein; HOMA-R, homeostasis model assessment for insulin resistance; SD, standard deviation
Safety
The incidence of AEs (Table 3) was 41.9% (18/43) in the placebo group, 33.3% (15/45) in the pemafibrate 0.1 mg/day group, 38.3% (49/128) in the pemafibrate 0.2 mg/day group, 40.0% (34/85) in the pemafibrate 0.4 mg/day group, 42.4% (36/85) in the fenofibrate 100 mg/day group, and 56.4% (79/140) in the fenofibrate 200 mg/day group. The incidence of ADRs was 7.0% (3/43) in the placebo group, 4.4% (2/45) in the pemafibrate 0.1 mg/day group, 7.8% (10/128) in the pemafibrate 0.2 mg/day group, 11.8% (10/85) in the pemafibrate 0.4 mg/day group, 14.1% (12/85) in the fenofibrate 100 mg/day group, and 26.4% (37/140) in the fenofibrate 200 mg/day group. No dosedependent increase in the incidence of AEs or ADRs was observed among the pemafibrate dose groups (P = 0.931 or 0.219, respectively). When compared with the placebo and fenofibrate groups by Fisher's exact test, the incidence of AEs and ADRs in the pemafibrate dose groups showed no marked difference compared with that in the fenofibrate 100 mg/day group, but were significantly less frequent than that in the fenofibrate 200 mg/day group (P < 0.05).
Table 3. Incidence of Adverse Events and Adverse Drug Reactions.
| (A) Adverse Events | ||||||
|---|---|---|---|---|---|---|
| Placebo | Pemafibrate |
Fenofibrate |
||||
| 0.1 mg/day | 0.2 mg/day | 0.4 mg/day | 100 mg/day | 200 mg/day | ||
| (N = 43) | (N = 45) | (N = 128) | (N = 85) | (N = 85) | (N = 140) | |
| Number of subjects with adverse events, n (%) | 18 (41.9) | 15 (33.3) | 49 (38.3) | 34 (40.0) | 36 (42.4) | 79 (56.4) |
| 95%CI | 27.0, 57.9 | 20.0, 49.0 | 29.8, 47.3 | 29.5, 51.2 | 31.7, 53.6 | 47.8, 64.8 |
| P † | 0.931 | |||||
| P vs. placebo‡ | 0.510 | 0.720 | 0.851 | 1.000 | 0.116 | |
| P vs. fenofibrate 100 mg/day‡ | 0.350 | 0.570 | 0.876 | 0.054 | ||
| P vs. fenofibrate 200 mg/day‡ | 0.010 | 0.003 | 0.020 | |||
| Serious, n (%) | 0 | 1 (2.2) | 2 (1.6) | 1 (1.2) | 0 | 3 (2.1) |
| Discontinuation, n (%) | 0 | 2 (4.4) | 2 (1.6) | 1 (1.2) | 3 (3.5) | 14 (10.0) |
| (B) Adverse Drug Reactions | ||||||
|---|---|---|---|---|---|---|
| Placebo |
Pemafibrate |
Fenofibrate |
||||
| 0.1 mg/day | 0.2 mg/day | 0.4 mg/day | 100 mg/day | 200 mg/day | ||
| (N = 43) | (N = 45) | (N = 128) | (N = 85) | (N = 85) | (N = 140) | |
| Number of subjects with adverse events, n (Incidence, %) | 3 (7.0) | 2 (4.4) | 10 (7.8) | 10 (11.8) | 12 (14.1) | 37 (26.4) |
| 95%CI | 1.5, 19.1 | 0.5, 15.1 | 3.8, 13.9 | 5.8, 20.6 | 7.5, 23.4 | 19.3, 34.5 |
| P † | 0.219 | |||||
| P vs. placebo‡ | 0.673 | 1.000 | 0.541 | 0.383 | 0.006 | |
| P vs. fenofibrate 100 mg/day‡ | 0.136 | 0.169 | 0.820 | 0.031 | ||
| P vs. fenofibrate 200 mg/day‡ | 0.001 | < 0.001 | 0.011 | |||
| Serious, n (%) | 0 | 0 | 0 | 0 | 0 | 0 |
| Discontinuation, n (%) | 0 | 1 (2.2) | 1 (0.8) | 0 | 2 (2.4) | 12 (8.6) |
Cochran-Armitage test (placebo, pemafibrate)
Fisher's exact test
CI, confidence interval
There was only one serious AE leading to death in the study: pulmonary embolism in one patient in the pemafibrate 0.4 mg/day group (Table 3). This event and all other serious AEs were judged by investigators to have no relationship with the investigational product. No serious ADRs were observed. AEs that led to the discontinuation of the study drug occurred in 4.4% (2/45) of the patients in the pemafibrate 0.1 mg/day group, 1.6% (2/128) of the patients in the 0.2 mg/day group, 1.2% (1/85) of the patients in the 0.4 mg/day group, 3.5% (3/85) of the patients in the fenofibrate 100 mg/day group, and 10.0% (14/140) of the patients in the fenofibrate 200 mg/day group (P values vs fenofibrate 200 mg/day were estimated as 0.365, 0.004 and 0.011 for pemafibrate 0.1, 0.2 and 0.4 mg/day, respectively, by post-hoc Fisher's exact test). ADRs required discontinuation of the study drug in 2.2% (1/45) of the patients in the pemafibrate 0.1 mg/day group, 0.8% (1/128) of the patients in the 0.2 mg/day group, 0% (0/85) of the patients in the 0.4 mg/day group, 2.4% (2/85) of the patients in the fenofibrate 100 mg/day group, and 8.6% (12/140) of the patients in the fenofibrate 200 mg/day group (P values vs fenofibrate 200 mg/day were estimated as 0.193, 0.003 and 0.004 for pemafibrate 0.1, 0.2 and 0.4 mg/day, respectively, by post-hoc Fisher's exact test).
The incidence of liver-related AEs was 8.2% (7/85) in the pemafibrate 0.4 mg/day dose group, but this incidence was similar to that in the placebo group (9.3%). In contrast, 13 of 85 (15.3%) patients treated with fenofibrate 100 mg/day and 34 of 140 (24.3%) patients treated with fenofibrate 200 mg/day had liverrelated AEs (Table 4). The incidence of rhabdomyolysis-/myopathy-related AEs was low and similar to placebo in all pemafibrate and fenofibrate dose groups (Table 4). The incidence of nasopharyngitis was ≥ 5% in some pemafibrate dose groups, but the incidence did not markedly differ from the incidence in the placebo group.
Table 4. Types of Adverse Events (Liver-related and Rhabdomyolysis/Myopathy-related).
| Placebo | Pemafibrate |
Fenofibrate |
||||
|---|---|---|---|---|---|---|
| 0.1 mg/day | 0.2 mg/day | 0.4 mg/day | 100 mg/day | 200 mg/day | ||
| (N = 43) | (N = 45) | (N = 128) | (N = 85) | (N = 85) | (N = 140) | |
| Liver-related AEs | 4 (9.3) | 2 (4.4) | 3 (2.3) | 7 (8.2) | 13 (15.3) | 34 (24.3) |
| Hepatobiliary disorders | 0 | 0 | 0 | 0 | 1 (1.2) | 3 (2.1) |
| Hepatic function abnormal | 0 | 0 | 0 | 0 | 1 (1.2) | 3 (2.1) |
| Laboratory test abnormalities | 4 (9.3) | 2 (4.4) | 3 (2.3) | 7 (8.2) | 12 (14.1) | 31 (22.1) |
| Abnormal liver function tests | 1 (2.3) | 2 (4.4) | 2 (1.6) | 4 (4.7) | 11 (12.9) | 22 (15.7) |
| AST increased | 0 | 0 | 0 | 1 (1.2) | 0 | 0 |
| ALT increased | 1 (2.3) | 0 | 1 (0.8) | 1 (1.2) | 0 | 2 (1.4) |
| γ-GT increased | 1 (2.3) | 0 | 0 | 0 | 1 (1.2) | 4 (2.9) |
| Blood bilirubin increased | 1 (2.3) | 0 | 0 | 0 | 0 | 2 (1.4) |
| Blood fibrinogen decreased | 0 | 0 | 0 | 1 (1.2) | 0 | 2 (1.4) |
| Rhabdomyolysis-/myopathy-related AEs | 3 (7.0) | 1 (2.2) | 2 (1.6) | 2 (2.4) | 3 (3.5) | 7 (5.0) |
| Laboratory test abnormalities | 3 (7.0) | 1 (2.2) | 2 (1.6) | 1 (1.2) | 2 (2.4) | 7 (5.0) |
| Serum CK increased | 3 (7.0) | 1 (2.2) | 1 (0.8) | 1 (1.2) | 2 (2.4) | 3 (2.1) |
| Serum Cr increased | 0 | 0 | 1 (0.8) | 0 | 0 | 4 (2.9) |
| Musculoskeletal and connective tissue disorders | 0 | 0 | 0 | 1 (1.2) | 1 (1.2) | 0 |
| Myalgia | 0 | 0 | 0 | 1 (1.2) | 1 (1.2) | 0 |
AST, aspartate aminotransferase; ALT, alanine aminotransferase; γ-GT, gamma glutamyl transpeptidase; CK, creatine kinase; Cr, creatinine; AE, adverse event
In the analysis of liver function test results, AST, ALT, and γ-GT levels markedly increased in the fenofibrate groups compared with those in the placebo and pemafibrate groups. ALT and γ-GT levels significantly decreased in the pemafibrate dose groups from baseline to weeks 4 to 12 (Fig. 4).
Fig. 4.
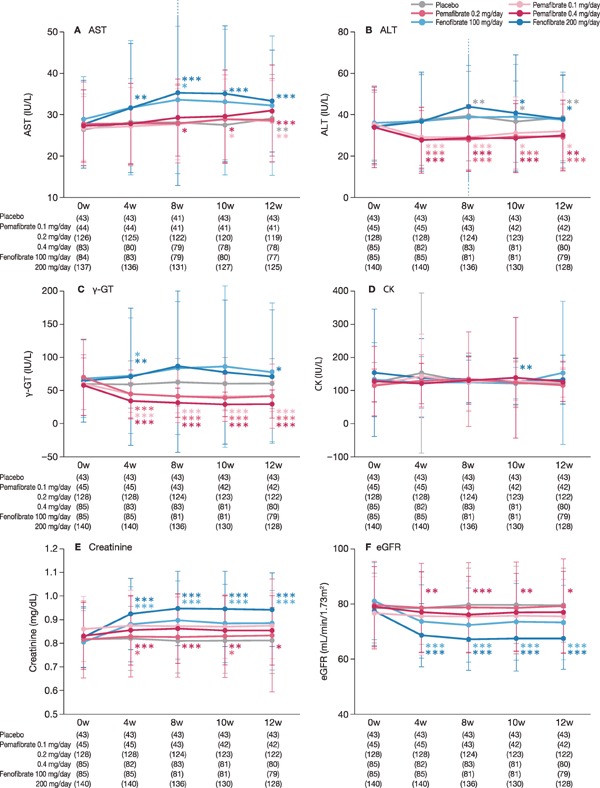
Safety endpoints (liver enzymes, CK, kidney function)
Data are presented as mean levels. (A) AST, (B) ALT, (C) γ-GT, (D) CK, (E) Creatinine, (F) eGFR. The error bar indicates standard deviation.
*: P < 0.05, **: P < 0.01, ***: P < 0.001 vs. baseline (Wilcoxon signed-rank test).
AST, aspartate aminotransferase; ALT, alanine aminotransferase; γ-GT, gamma-glutamyl transpeptidase; CK, creatine kinase; eGFR, estimated glomerular filtration rate
In kidney function tests, serum creatinine and eGFR levels dramatically increased and decreased, respectively, in the fenofibrate groups, particularly in the 200 mg/day group, compared with those in the placebo and pemafibrate groups (Fig. 4). CK levels were nearly unchanged.
Table 5 shows the number of patients with laboratory test results exceeding the cut-off values or going below the cut-off values. Four patients (4.7%) in the fenofibrate 100 mg/day group and seven (5.0%) in the fenofibrate 200 mg/day group had ALT levels that rose to > 3× ULN. No patients in the placebo or pemafibrate groups had ALT levels this high. Results were similar for AST levels. CK level changes exceeded 2.5× or 5× ULN in some patients in the pemafibrate groups, but the percentage of patients with such changes was similar to that in the placebo group. The serum creatinine level exceeded 2.0 mg/dL in 1 patient in the pemafibrate 0.2 mg/day group. This increase was considered to be an AE (increased blood creatinine level) but was judged to be “not related” to the trial drug.
Table 5. Number of Patients with Laboratory Test Values Exceeding or Decreasing below the Cut-off Values.
| Number of patients (%) |
||||||
|---|---|---|---|---|---|---|
| Placebo | Pemafibrate |
Fenofibrate |
||||
| 0.1 mg/day | 0.2 mg/day | 0.4 mg/day | 100 mg/day | 200 mg/day | ||
| (N = 43) | (N = 45) | (N = 128) | (N = 84) | (N = 85) | (N = 140) | |
| AST > ULN × 3 | 0 | 0 | 0 | 0 | 1 (1.2) | 3 (2.1) |
| AST > ULN × 5 | 0 | 0 | 0 | 0 | 0 | 1 (0.7) |
| ALT > ULN × 3 | 0 | 0 | 0 | 0 | 4 (4.7) | 7 (5.0) |
| ALT > ULN × 5 | 0 | 0 | 0 | 0 | 0 | 1 (0.7) |
| CK > ULN × 2.5 | 1 (2.3) | 1 (2.2) | 3 (2.3) | 1 (1.2) | 1 (1.2) | 1 (0.7) |
| CK > ULN × 5 | 1 (2.3) | 0 | 0 | 1 (1.2) | 1 (1.2) | 0 |
| Serum Cr > 1.5 mg/dL | 0 | 0 | 1 (0.8) | 0 | 0 | 0 |
| Serum Cr > 2.0 mg/dL | 0 | 0 | 1 (0.8) | 0 | 0 | 0 |
| Fibrinogen < LLN × 1 | 0 | 3 (6.7) | 3 (2.3) | 4 (4.8) | 2 (2.4) | 7 (5.0) |
| Fibrinogen < LLN × 0.75 | 0 | 0 | 0 | 0 | 1 (1.2) | 0 |
| Fibrinogen < LLN × 0.5 | 0 | 0 | 0 | 0 | 0 | 0 |
| Hemoglobin < 10.0 g/dL | 0 | 0 | 0 | 0 | 0 | 0 |
| Hemoglobin < 8.0 g/dL | 0 | 0 | 0 | 0 | 0 | 0 |
| Hemoglobin < 6.5 g/dL | 0 | 0 | 0 | 0 | 0 | 0 |
ULN of AST: 40 IU/L/37°C, ALT: 45 IU/L/37°C, CK: 270 (Male) or 150 (Female) IU/L/37°C, LLN of Fibrinogen: 155 mg/dL
AST, aspartate aminotransferase; ULN, upper limit of the normal range; ALT, alanine aminotransferase; CK, creatine kinase; Cr, creatinine; LLN, lower limit of the normal range.
Discussion
In this multicenter, randomized study, pemafibrate treatment demonstrated potent and dose-dependent reduction in TG levels at 0.1, 0.2 and 0.4 mg/day in patients with high TG and low HDL-C levels. This is the first study to compare the safety and efficacy of pemafibrate with the maximum dose of fenofibrate (200 mg/day). Pemafibrate 0.2 mg/day and 0.4 mg/day were confirmed to be non-inferior to fenofibrate 200 mg/day, and pemafibrate 0.1 to 0.4 mg/day was confirmed to be superior to fenofibrate 100 mg/day for reducing TG levels. The incidence of AEs/ADRs in all pemafibrate groups was confirmed to be comparable to that of placebo and less frequent than that of fenofibrate 200 mg/day. Overall, pemafibrate 0.4 mg/day was superior to fenofibrate 200 mg/day.
The efficacy results in the current study were consistent with another phase III study that found that pemafibrate 0.2 mg/day and 0.4 mg/day provided significantly better reduction in TG levels than fenofibrate tablets (106.6 mg/day, equivalent to micronized fenofibrate capsules with 134 mg/day)19). In an earlier phase II study, TG reductions were at least 10% greater in pemafibrate-treated patients (0.2 mg/day or 0.4 mg/day) than in fenofibrate patients (100 mg/day), but the difference was not significant20). The statistical significance in the current study was likely due to the higher patient numbers and greater statistical power.
Similar trends were observed in the present study for other TG-related indicators, including VLDL-C, RemL-C, and ApoC-III. At all doses, pemafibrate provided more potent improvement in TG-rich lipoprotein levels than fenofibrate 100 mg/day, and the effects of pemafibrate 0.2 mg/day and 0.4 mg/day were equivalent to those of fenofibrate 200 mg/day. Pemafibrate groups tended to show decreased fasting serum glucose levels and decreased fasting insulin levels. Treatment with pemafibrate may thus help reduce insulin resistance. This point requires further investigation.
In the present study, LDL-C levels increased in the pemafibrate and fenofibrate groups. Many enrolled patients had hyperlipidemia Type IV, which is often associated with increases in LDL-C levels after treatment with fenofibrate or bezafibrate. With fenofibrate, LDL-C levels may increase, even when these levels are initially low23). In patients with high TG levels but low LDL-C levels, VLDLs account for a relatively high proportion of apoB-containing lipoproteins, and LDL-C levels may increase as a result of TG-rich lipoprotein catabolism enhanced by treatment with those agents. Often, in clinical practice, LDL-C levels are initially elevated after fibrate treatment but then gradually decrease with continued fibrate treatment in combination with diet therapy. In the study mentioned above23), LDL-C levels increased after fenofibrate treatment compared to placebo, but the difference in LDL-C levels between the groups gradually diminished during the 104-week treatment period. No further details are available, but there might be integrated effects on slightly different baseline characteristics of patients, such as mean baseline levels and/or distribution of TG and LDL-C levels.
In addition to demonstrating efficacy, this study also confirmed the safety of pemafibrate. The incidence of AEs and ADRs in all pemafibrate groups was similar to that in the placebo group and less frequent than that in the fenofibrate groups; these differences between each of the pemafibrate groups and the fenofibrate 200 mg/day group were significant.
More specifically, pemafibrate was associated with a low risk of AEs related to liver function. Even at the highest dose (0.4 mg/day) in the present study, pemafibrate was associated with reduced ALT and γ-GT levels. In contrast, fenofibrate, particularly at a high dose (200 mg/day), caused further elevation in ALT and γ-GT levels. These observations are consistent with previous preclinical and clinical findings19, 20, 24–26). Unlike fenofibrate, pemafibrate is primarily excreted into the bile27). In rats, pemafibrate provided more potent reduction in TG levels than fenofibrate with less increase in liver weight18). In another double-blind comparative study, liver-related AEs occurred in 6.8% of patients in the pemafibrate 0.2 mg/day group, 0% of those in the pemafibrate 0.4 mg/day group, and 39.5% of those in the fenofibrate 106.6 mg/day group19). The ability of pemafibrate to potently reduce TG levels without affecting liver function clearly distinguishes it from fenofibrate.
The present study also confirmed the safety profile of pemafibrate related to renal function over fenofibrate. The greatest reduction in eGFR was noted at the maximum dose of fenofibrate (200 mg/day), which was even more extensive than that for fenofibrate 100 mg/day; eGFR was minimally affected by the maximum dose of pemafibrate (0.4 mg/day). In another phase III study, fenofibrate was associated with increases in serum creatinine levels and decreases in eGFR, but these changes were minimal in the pemafibrate group19). In the same study, the incidence of kidneyrelated AEs was 0% in the pemafibrate 0.2 mg/day and 0.4 mg/day groups and 3.9% in the fenofibrate 106.6 mg/day group19).
Drug effectiveness in real-world clinical practice is clearly affected by the number of treatment discontinuations due to AEs. To maximize the effectiveness of a drug, it is necessary to minimize treatment discontinuations. In the present study, the discontinuation rate was 10% for fenofibrate 200 mg/day (14 of 140 patients). The primary reason was concern for patient safety following worsening of liver function (11 patients). The pemafibrate groups showed one treatment discontinuation due to ALT level elevation in the 0.2 mg/day group and no discontinuations due to worsening liver function in the 0.4 mg/day (high dose) group. The low level of discontinuation suggests that patients can benefit from the highly potent reduction in TG levels at a high dose without compromising safety. Additionally, the ACCORD study prespecified rules for discontinuation or dose reduction based on laboratory values, including eGFR11). A comparison of fenofibrate and placebo in the same study found greater eGFR reduction (2.4% vs. 1.1%) and a higher rate of dose reduction with fenofibrate11). These results suggest that some patients are unable to benefit from the maximum fenofibrate dose. In contrast, pemafibrate appears to cause very little reduction in eGFR, even at the maximum dose. For this reason, we can anticipate few instances of drug withdrawal. These favorable efficacy and safety results compared to fenofibrate may also be related to findings that pemafibrate qualifies as a SPPARMα, which permits the separation of desirable effects from adverse effects16, 17).
This study has some limitations. First, the treatment period was short (12 weeks), and the sample size was moderate. Correlating the present findings to clinical outcomes, such as the prevention of cardiovascular events or acute pancreatitis, will require a larger study conducted over a longer duration. The ongoing PROMINENT study (NCT03071692), expected to have about four years of follow-up, should provide additional data on these kinds of clinical events3). Particularly, the risk of pulmonary embolism was slightly higher in the fenofibrate group than in the placebo group in the FIELD study28). Pulmonary embolism may be of interest in clinical practice, although it was not observed in the ACCORD study, and the instance observed in the pemafibrate 0.4 mg/day group was reported to have no relationship with pemafibrate by the investigator11). Second, in comparison with other clinical studies of pemafibrate, the upper limit of baseline TG levels in the present study was high (1000 mg/dL). Therefore, it may be possible that various baseline patient characteristics were not sufficiently homogenized by randomization, which may have made it difficult to interpret the results. Third, patients receiving concomitant statin therapy or those with serious liver or kidney damage were excluded. Further research will be required to determine the drug's effects in a real-world setting. Lastly, this study was limited to Japanese patients, and the results may not be applicable to other racial or ethnic populations.
Conclusion
In patients with high TG and low HDL-C levels, pemafibrate treatment at 0.1, 0.2, and 0.4 mg/day demonstrated potent and dose-dependent reduction in TG levels in comparison with placebo and fenofibrate at 100 and 200 mg/day; the results also suggested a favorable benefit-risk balance compared with fenofibrate. The favorable safety profile of pemafibrate, including fewer adverse effects on kidney/liver-related laboratory tests and fewer AEs/ADRs, including those leading to treatment discontinuation, may provide a broader range of patients with this novel and potent treatment option for reducing TG levels.
Acknowledgements
The authors acknowledge the investigators and patients who participated in this study. This study was conducted at OCROM Clinic (Satoshi Inoue), ToCROM Clinic (Osamu Matsuoka), Nada Clinic (Masaharu Murakami), PS Clinic (Masanari Shiramoto), Sumida Hospital (Ippei Ikushima), Nishi-Kumamoto Hospital (Makoto Yono), Tokyo-Eki Center-Building Clinic (Arihiro Kiyosue), Yanagibashi Annex, Eiju General Hospital (Hirotaka Nagashima), Shinagawa East One Medical Clinic (Hiroshige Itakura), Kanauchi Medical Clinic (Naohisa Hoshino), New Medical Research System Clinic (Atsuko Abe), P-One Clinic (Kenichi Furihata), Akasaka Chuo Clinic (Yuji Hidaka), Suidoubashi Medical Clinic (Satoshi Sunayama), Funamoto Clinic (Masanobu Funamoto), Tokyo Ekimae Clinic (Yoshio Ohashi), Sone Clinic (Masayoshi Sone), Asahi Clinic (Tetsu Aoki), Gakkentoshi Clinic (Hiroaki Yamamoto), Tomo Clinic (Tomofumi Murakami), Niwa Family Clinic (Kiyoshi Niwa), Fukuoka Rehabilitation Hospital (Toru Kihara), Kobari General Clinic (Fumihiko Hojo), Yoshimura Internal Medicine (Ryuuji Yoshimura), Fukuhama Chuo Clinic (Naofumi Tomita), Yotsuya Internal Medicine (Takahiro Yokoyama), Nanko Clinic (Shoichi Kitano), Anbe Heart Clinic (Jiro Anbe), Ogino Clinic (Kazunori Ogino), Pedi Shiodome Medical Clinic (Hideki Kaizuka), Shinozaki Ekimae Clinic (Yoshihiro Okada), Nihonbashi Enomoto Internal Medicine (Yasuyuki Enomoto). This work was supported by Kowa Company, Ltd. The funder had a role in the study design, data collection, data analysis, and data interpretation. EDIT, Inc. (Tokyo, Japan) provided medical writing and editing.
Conflict of Interest
H.A. reports personal fees from Kowa during the conduct of the study as well as grants from Daiichi Sankyo and personal fees from Daiichi Sankyo, MSD, and Otsuka Pharmaceutical outside the submitted work. S.Y. reports grants and personal fees from Kowa during the conduct of the study as well as grants from Nippon Boehringer Ingelheim, Otsuka Pharmaceutical, Shionogi, Bayer Yakuhin, National Institute of Biomedical Innovation, MSD, Japan Tobacco, Kyowa Medex, Takeda Pharmaceutical, Sanwa Kagaku Kenkyusho, Astellas Pharma, Daiichi Sankyo, Mochida Pharmaceutical, AstraZeneca, Izumisano City, Kaizuka City, Hayashibara, Teijin Pharma, Kaken Pharmaceutical, Kissei Pharmaceutical and personal fees from Otsuka Pharmaceutical, Shionogi, Bayer Yakuhin, MSD, Takeda Pharmaceutical, Sanwa Kagaku Kenkyusho, Ono Pharmaceutical, Astellas Pharma, Daiichi Sankyo, Astra-Zeneca, Medical Review, Skylight Biotech, Kaken Pharmaceutical, Pfizer Japan, Bristol-Myers Squibb, Amgen Astellas BioPharma, Sanofi, and Toa Eiyo outside the submitted work; in addition, S.Y. has a patent Fujirebio pending. K.Y. reports personal fees from Kowa during the conduct of the study as well as grants from Astellas Pharma, Otsuka Pharmaceutical, Daiichi Sankyo, Takeda Pharmaceutical, Mitsubishi Tanabe Pharma, and Bristol-Myers Squibb and personal fees from Astellas Pharma, AstraZeneca, Eisai, MSD, Ono Pharmaceutical, Kyowa Hakko Kirin, Kowa Pharmaceutical, Shionogi, Daiichi Sankyo, Takeda Pharmaceutical, Mitsubishi Tanabe Pharma, Pfizer Japan, and Mochida Pharmaceutical outside the submitted work. E.A. reports personal fees from Kowa during the conduct of the study as well as grants from Nippon Boehringer Ingelheim, Novo Nordisk Pharma, Ono Pharmaceutical, Sanofi, Daiichi Sankyo, Mitsubishi Tanabe Pharma, Novartis Pharma, Kowa Pharmaceutical, Astellas Pharma, AstraZeneca, Takeda Pharmaceutical, Taisho Toyama Pharmaceutical, and Pfizer Japan and personal fees from MSD, Nippon Boehringer Ingelheim, Novo Nordisk Pharma, Ono Pharmaceutical, Sanofi, Daiichi Sankyo, Mitsubishi Tanabe Pharma, Novartis Pharma, Kowa Pharmaceutical, Astellas Pharma, AstraZeneca, Takeda Pharmaceutical, Taisho Toyama Pharmaceutical and Eli Lilly Japan outside the submitted work. H.S. is an employee of Kowa. S.I. reports personal fees from Kowa during the conduct of the study as well as grants from Astellas Pharma, Daiichi Sankyo, Teijin Pharma, Takeda Pharmaceutical, Ono Pharmaceutical, Taisho Toyama Pharmaceutical, and Nippon Boehringer Ingelheim and personal fees from MSD, AstraZeneca, Sanwa Kagaku Kenkyusho, and Nippon Boehringer Ingelheim outside the submitted work.
Registration Identifier
JapicCTI-121764
References
- 1). Fulcher J, O'Connell R, Voysey M, Emberson J, Blackwell L, Mihaylova B, Simes J, Collins R, Kirby A, Colhoun H, Braunwald E, La Rosa J, Pedersen TR, Tonkin A, Davis B, Sleight P, Franzosi MG, Baigent C, Keech A: Efficacy and safety of LDL-lowering therapy among men and women: meta-analysis of individual data from 174,000 participants in 27 randomised trials. Lancet, 2015; 385: 1397-1405 [DOI] [PubMed] [Google Scholar]
- 2). Sabatine MS, Giugliano RP, Keech AC, Honarpour N, Wiviott SD, Murphy SA, Kuder JF, Wang H, Liu T, Wasserman SM, Sever PS, Pedersen TR: Evolocumab and Clinical Outcomes in Patients with Cardiovascular Disease. N Engl J Med, 2017; 376: 1713-1722 [DOI] [PubMed] [Google Scholar]
- 3). Fruchart JC: Pemafibrate (K-877), a novel selective peroxisome proliferator-activated receptor alpha modulator for management of atherogenic dyslipidaemia. Cardiovasc Diabetol, 2017; 16: 124. [DOI] [PMC free article] [PubMed] [Google Scholar]
- 4). National Cholesterol Education Program (NCEP) Expert Panel on Detection E, and Treatment of High Blood Cholesterol in Adults (Adult Treatment Panel III): Third Report of the National Cholesterol Education Program (NCEP) Expert Panel on Detection, Evaluation, and Treatment of High Blood Cholesterol in Adults (Adult Treatment Panel III) final report. Circulation, 2002; 106: 3143-3421 [PubMed] [Google Scholar]
- 5). Staels B, Dallongeville J, Auwerx J, Schoonjans K, Leitersdorf E, Fruchart JC: Mechanism of action of fibrates on lipid and lipoprotein metabolism. Circulation, 1998; 98: 2088-2093 [DOI] [PubMed] [Google Scholar]
- 6). Loomba RS, Arora R: Prevention of cardiovascular disease utilizing fibrates--a pooled meta-analysis. Am J Ther, 2010; 17: e182-188 [DOI] [PubMed] [Google Scholar]
- 7). Rosenson RS: Fenofibrate: treatment of hyperlipidemia and beyond. Expert Rev Cardiovasc Ther, 2008; 6: 1319-1330 [DOI] [PubMed] [Google Scholar]
- 8). Feingold K, Grunfeld C: Triglyceride Lowering Drugs. In: Endotext, ed by De Groot LJ, Chrousos G, Dungan K, Feingold KR, Grossman A, Hershman JM, Koch C, Korbonits M, McLachlan R, New M, Purnell J, Rebar R, Singer F, Vinik A, MDText.com, Inc., South Dartmouth (MA), 2017 [Google Scholar]
- 9). Wang D, Liu B, Tao W, Hao Z, Liu M: Fibrates for secondary prevention of cardiovascular disease and stroke. Cochrane Database Syst Rev, 2015; Cd009580. [DOI] [PMC free article] [PubMed] [Google Scholar]
- 10). Bruckert E, Labreuche J, Deplanque D, Touboul PJ, Amarenco P: Fibrates effect on cardiovascular risk is greater in patients with high triglyceride levels or atherogenic dyslipidemia profile: a systematic review and meta-analysis. J Cardiovasc Pharmacol, 2011; 57: 267-272 [DOI] [PubMed] [Google Scholar]
- 11). Ginsberg HN, Elam MB, Lovato LC, Crouse JR, 3rd, Leiter LA, Linz P, Friedewald WT, Buse JB, Gerstein HC, Probstfield J, Grimm RH, Ismail-Beigi F, Bigger JT, Goff DC, Jr., Cushman WC, Simons-Morton DG, Byington RP: Effects of combination lipid therapy in type 2 diabetes mellitus. N Engl J Med, 2010; 362: 1563-1574 [DOI] [PMC free article] [PubMed] [Google Scholar]
- 12). Ahmad J, Odin JA, Hayashi PH, Chalasani N, Fontana RJ, Barnhart H, Cirulli ET, Kleiner DE, Hoofnagle JH: Identification and Characterization of Fenofibrate-Induced Liver Injury. Dig Dis Sci, 2017; 62: 3596-3604 [DOI] [PMC free article] [PubMed] [Google Scholar]
- 13). Davidson MH, Armani A, McKenney JM, Jacobson TA: Safety considerations with fibrate therapy. Am J Cardiol, 2007; 99: 3c-18c [DOI] [PubMed] [Google Scholar]
- 14). National Kidney Foundation: KDOQI Clinical Practice Guideline for Diabetes and CKD: 2012 Update. Am J Kidney Dis, 2012; 60: 850-886 [DOI] [PubMed] [Google Scholar]
- 15). Ferri N, Corsini A, Sirtori C, Ruscica M: PPAR-alpha agonists are still on the rise: an update on clinical and experimental findings. Expert Opin Investig Drugs, 2017; 26: 593-602 [DOI] [PubMed] [Google Scholar]
- 16). Fruchart JC: Selective peroxisome proliferator-activated receptor α modulators (SPPARMα): the next generation of peroxisome proliferator-activated receptor α-agonists. Cardiovasc Diabetol, 2013; 12: 82. [DOI] [PMC free article] [PubMed] [Google Scholar]
- 17). Raza-Iqbal S, Tanaka T, Anai M, Inagaki T, Matsumura Y, Ikeda K, Taguchi A, Gonzalez FJ, Sakai J, Kodama T: Transcriptome Analysis of K-877 (a Novel Selective PPARα Modulator (SPPARMα))-Regulated Genes in Primary Human Hepatocytes and the Mouse Liver. J Atheroscler Thromb, 2015; 22: 754-772 [DOI] [PMC free article] [PubMed] [Google Scholar]
- 18). Yamazaki Y, Abe K, Toma T, Nishikawa M, Ozawa H, Okuda A, Araki T, Oda S, Inoue K, Shibuya K, Staels B, Fruchart JC: Design and synthesis of highly potent and selective human peroxisome proliferator-activated receptor alpha agonists. Bioorg Med Chem Lett, 2007; 17: 4689-4693 [DOI] [PubMed] [Google Scholar]
- 19). Ishibashi S, Arai H, Yokote K, Araki E, Suganami H, Yamashita S: Efficacy and safety of pemafibrate (K-877), a selective peroxisome proliferator-activated receptor α modulator, in patients with dyslipidemia: Results from a 24-week, randomized, double blind, active-controlled, phase 3 trial. J Clin Lipidol, 2018; 12: 173-184 [DOI] [PubMed] [Google Scholar]
- 20). Ishibashi S, Yamashita S, Arai H, Araki E, Yokote K, Suganami H, Fruchart JC, Kodama T: Effects of K-877, a novel selective PPARα modulator (SPPARMα), in dyslipidaemic patients: A randomized, double blind, active- and placebo-controlled, phase 2 trial. Atherosclerosis, 2016; 249: 36-43 [DOI] [PubMed] [Google Scholar]
- 21). Sairyo M, Kobayashi T, Masuda D, Kanno K, Zhu Y, Okada T, Koseki M, Ohama T, Nishida M, Sakata Y, Yamashita S: A Novel Selective PPARα Modulator (SPPARMα), K-877 (Pemafibrate), Attenuates Postprandial Hypertriglyceridemia in Mice. J Atheroscler Thromb, 2018; 25: 142-152 [DOI] [PMC free article] [PubMed] [Google Scholar]
- 22). Masuda D, Yamashita S: Postprandial Hyperlipidemia and Remnant Lipoproteins. J Atheroscler Thromb, 2017; 24: 95-109 [DOI] [PMC free article] [PubMed] [Google Scholar]
- 23). Davidson MH, Rosenson RS, Maki KC, Nicholls SJ, Ballantyne CM, Mazzone T, Carlson DM, Williams LA, Kelly MT, Camp HS, Lele A, Stolzenbach JC: Effects of fenofibric acid on carotid intima-media thickness in patients with mixed dyslipidemia on atorvastatin therapy: randomized, placebo-controlled study (FIRST). Arterioscler Thromb Vasc Biol, 2014; 34: 1298-1306 [DOI] [PubMed] [Google Scholar]
- 24). Arai H, Yamashita S, Yokote K, Araki E, Suganami H, Ishibashi S: Efficacy and safety of K-877, a novel selective peroxisome proliferator-activated receptor α modulator (SPPARMα), in combination with statin treatment: Two randomised, double-blind, placebo-controlled clinical trials in patients with dyslipidaemia. Atherosclerosis, 2017; 261: 144-152 [DOI] [PubMed] [Google Scholar]
- 25). Hata Y, Goto Y, Itakura H: Clinical assessment of GRS-001 (fenofibrate) in hyperlipidemic patients—a double blind, comparative study, using bezafibrate sustainedrelease tablet as a control drug. Geriatr Med, 1995; 33: 765-822 [Google Scholar]
- 26). Saito Y, Goto Y, Yasugi T, Hata Y, Itakura H, Nakaya N, Tsushima M, Kawakami Y, Kondo T, Ide H, Yachi A, Kihara A, Yamada H, Onodera K, Kanazawa T, Maruhama Y, Ninomiya K, Masamune O, Inomata S, Toyoda T, Oikawa S, Kotake H, Naito T, Murata K, Kawazu S, Tomono S, Hayashi R, Kawakami M, Yamamoto T, Nakamura H, Nishiwaki M, Yoshida S, Fujioka T, Saito E, Kanmatsuse K, Kurokawa K, Teramoto T, Kato H, Kinoshita M, Yazaki Y, Yamada N, Shimano H, Murase T, Miyazaki S, Mashiko S, Numano F, Kishi Y, Nakamura Y, Hirose N, Nagano M, Ishikawa T, Tada N, Tanaka Y, Tamachi H, Shiina Y, Honma Y, Iori S, Handa K, Yoshimura K, Shibata A, Izumi T, Masani F, Muto Y, Noma A, Seishima M, Kuzuya F, Yoshimine N, Fujinami T, Sakuma N, Hamazaki T, Taki H, Takeda R, Mabuchi H, Koizumi J, Sekimoto H, Rin K, Miyabo S, Nakai T, Tamai T, Oida K, Shigeta Y, Hidaka H, Kita T, Nagano Y, Nakagawa M, Sasaki S, Yasunaga K, Tetsutani T, Osawa N, Takamatsu J, Morii H, Nishizawa Y, Matsuzawa Y, Kubo M, Yamamoto A, Yamamura T, Nomoto H, Yukawa S, Maeda T, Ishikawa H, Nonaka H, Yokoyama M, Ishikawa Y, Kasuga M, Yoshino G, Kazumi T, Kimura I, Ishioka T, Kibata M, Kamisaka K, Kajiyama G, Horiuchi I, Ishikawa K, Kusukawa R, Okuda F, Hiwada K, Sekiya T, Suehiro T, Fujishima M, Yoshinari M, Takeshita A, Sunagawa K, Arakawa K, Sasaki J, Matsunaga A, Toshima H, Hashimoto R, Nagataki S, Akasawa S, Shichiri M, Kobori S, Tanaka N, Takesako K, Mimura G, Higa S: Clinical assessment of GRS-001 (fenofibrate) in hyperlipidemic patients—a dose finding, double blind study. Prog Med, 1995; 15 (Suppl 1): 949-1010 [in Japanese] [Google Scholar]
- 27). Blair HA: Pemafibrate: First Global Approval. Drugs, 2017; 77: 1805-1810 [DOI] [PubMed] [Google Scholar]
- 28). Keech A, Simes RJ, Barter P, Best J, Scott R, Taskinen MR, Forder P, Pillai A, Davis T, Glasziou P, Drury P, Kesniemi YA, Sullivan D, Hunt D, Colman P, d'Emden M, Whiting M, Ehnholm C, Laakso M, FIELD study investigators : Effects of long-term fenofibrate therapy on cardiovascular events in 9795 people with type 2 diabetes mellitus (the FIELD study): randomised controlled trial. Lancet, 2005; 366: 1849-1861 [DOI] [PubMed] [Google Scholar]