

Abstract
Hyperhaploid clones (24-34 chromosomes) were identified in 33 patients with multiple myeloma (MM), identifying a novel numerical cytogenetic subgroup. Strikingly, all hyperhaploid karyotypes were found to harbor monosomy 17p, the single most important risk stratification lesion in MM. A catastrophic loss of nearly a haploid set of chromosomes results in disomies of chromosomes 3, 5, 7, 9, 11, 15, 18, 19, and 21, the same basic set of odd-numbered chromosomes found in trisomy in hyperdiploid myeloma. All other autosomes are found in monosomy, resulting in additional clinically relevant monosomies of 1p, 6q, 13q, and 16q. Hypotriploid subclones (58-68 chromosomes) were also identified in 11 of the 33 patients and represent a duplication of the hyperhaploid clone. Analysis of clones utilizing interphase fluorescence in-situ hybridization (iFISH), metaphase FISH, and spectral karyotyping identified either monosomy 17 or del17p in all patients. Amplification of 1q21 was identified in eight patients, demonstrating an additional high-risk marker. Importantly, our findings indicate that current iFISH strategies may be uninformative or ambiguous in the detection of these clones, suggesting this patient subgroup maybe under-reported. Overall survival for patients with hyperhaploid clones was poor, with a five-year survival rate of 23.1%. These findings identify a distinct numerical subgroup with cytogenetically defined high-risk disease.
Keywords: multiple myeloma, hyperhaploid, hypotriploid, del17p, amp1q21, high-risk disease
Introduction
Multiple myeloma (MM) is a plasma cell disordered characterized by complex numerical and structural chromosome aberrations.1 There is a consensus on two main numerical subgroups associated with different oncogenetic pathways and prognostic significance.2 The largest numerical subgroup is composed of hyperdiploid (47-57 chromosomes) clones characterized by a consistent set of odd-numbered chromosomes including trisomies for chromosomes 3, 5, 7, 9, 11, 15, 19, and 21. This group is found in 50% to 60% of patients, contains fewer structural IGH translocations, and is associated with a better prognosis. The second subgroup is made up of non-hyperdiploid (hypodiploid) karyotypes with 35-45 chromosomes, and is characterized by the loss of chromosomes 13, 14, 16 and 22. The hypodiploid group contains more frequent structural aberrations involving adverse IGH translocations, and is associated with a worse prognosis.3
Hyperhaploidy is a rare numerical aberration group defined by a range of 24-34 chromosomes4 which has been identified in many disease entities.5 We and others have previously reported a small number of hyperhaploid karyotypes in MM; 5-10 however, hyperhaploidy is most consistently identified and recognized as a category for numerical aberrations in childhood acute lymphoblastic leukemia (ALL).11 In childhood ALL the hyperhaploid clones occur in two subgroups, a near-haploid group (25-29 chromosomes) and low hypodiploidy subgroup (30-39 chromosomes).11 A distinctive set of five chromosomes occurs in hyperhaploid ALL with disomies of the X, Y, 14, 18, and 21.11 In MM the hyperhaploid clone is characterized by a set of mostly odd numbered disomies including 3, 5, 7, 9, 11, 15, 18, 19, and 21. Of note, in MM this is the same set of odd-numbered chromosomes found as trisomies in hyperdiploid myeloma, with the exception that chromosome 18 is retained in disomy in most of these cases. Importantly, multiple chromosome regions associated with deletions and poor prognosis are inherently monosomic in these clones, including chromosome regions 17p, 1p, 13q, and 16q.1
In MM cytogenetic risk stratification models rely on a number of independent molecular markers to assess disease aggressiveness.12-17 Among current models there is a consensus that deletion of 17p is the single most important interphase fluorescence in situ hybridization FISH (iFISH) probe for prognostication. The International Myeloma Working Group (IMWG) recommends the use of three independent iFISH probes to identify cytogenetically defined high-risk disease, including probes for t(4;14), del17p13 and gain of 1q21.17 The del17p13 and gain of 1q21 are secondary copy number aberrations (CNAs) associated with disease progression and relapse. The universal finding of monosomy 17 in hyperhaploid clones indicates that these patients detected by iFISH would be classified as high-risk according to the IMWG and other stratification models. The significance of monosomy 17p in relation to risk-stratification, the emergence of hypotriploid subclones with CNAs “masked” to iFISH, and accumulation of secondary amplification of 1q21 has not been reported.
Patients and Methods
The Institutional Review Board of the University of Arkansas for Medical Sciences approved the research studies, and all subjects provided written informed consent approving the use of their samples for research purposes. Patients with hyperhaploid clones were identified by routine G-banded studies of clinical specimens. Locus-specific BAC probes for iFISH included 1q21 (CKS1B), 1p13 (AHCYL1), 13q14 (D13S31), 13q34 (D13s285), 17p (TP53), and 17q24 (ERB2), and hybridizations were performed as previously described.18 A 20% cut-off point was used for detection of numerical aberrations. Metaphase FISH (mFISH) and Spectral Karyotyping (SKY) were utilized in cases with adequate cell pellet available following G-banding procedures. mFISH probes also included commercial probes for IGH (break-apart probe), and probes to the pericentromeric regions of 1q12 (sat III DNA, red), 9q11 (alpha sat, aqua), and 16q11 (sat II, aqua) (Vysis, Downers Grove, IL). Probes were used according to the manufacturer's instructions. The SKY probe mixture and hybridization reagents were prepared by Applied Spectral Imaging (Carlsbad, CA). Image acquisition for FISH and SKY was performed as previously described 19 using a SD200 Spectracube (Applied Spectral Imaging, Inc., Carlsbad, CA) mounted on a Zeiss Axioplan II microscope (Gottingen, Germany). DAPI images were captured, then inverted and enhanced by SKYView software to produce G-band patterns on the chromosomes. Original magnification of all G-band and iFISH images was 1000×. Original magnification for SKY images was 630×.
Statistical Analysis
Overall survival curves were constructed according to the Kaplan-Meier method.20 Thirty-three hyperhaploid patients with overall survival data landmarked by cytogenetic analysis were compared to Total Therapy 3 (TT3)21,22 baseline samples according to presence of an abnormal karyotype, hypodiploidy satus (includes pseudodiploid and near-tetraploid cases), and risk features including ISS stage and GEP70 23 risk. Comparisons of clinical variables between TT3 and hyperhaploid patients were calculated by Fisher's exact test, univariate survival analyses utilized log rank test statistics, and a backwards stepwise selection identified a subset of all univariate clinical and demographic variables in a multivariate model. GEP was not included in the multivariate analysis as it was present on only 12 of out 33 hyperhaploid cases. Additionally, missing clinical values in subset of hyperhaploid cases were imputed using multivariate imputation by chained equations 24 and subsequent Cox regression models were pooled to increase overall power with all hyperhaploid samples included.
Results
Patient characteristics including age, sex, isotype, L-chain, Durie Salmon staging, International Staging System, and composite G-band karyotypes of all 33 patients are presented in Table 1. iFISH results for thirteen patients are present in Supplemental Table 1, and mFISH results for eleven patients in Supplemental Table 2. Chromosome numbers (derived from karyotype data) ranged from 30 to 34, with a modal number of 32 in the hyperhaploid clones, while the hypotriploid subclones showed a modal number of 66 chromosomes (Table 1). The hyperhaploid clones showed the same set of odd-numbered chromosomes found as disomies including 3, 5, 7, 9, 11, 15, 19, and 21 that are found as trisomies in hyperdiploid MM (not shown). The notable exception to this in the hyperhaploid clones is that all or part of chromosome 18 was retained in disomy in most patients (26/33) (Table 1). By G-banding only hyperhaploid clones were identified in 20 patients, while both hyperhaploid and hypotriploid subclones were found in 11 patients, and only hypotriploid clones in two patients (Table 1). Spectral karyotyping of patient # 33 demonstrate how the exact doubling of chromosomes in a hyperhaploid clone (Figure 1A), can result in a hypotriploid clone (Figure 1B). Rehybridization of the same cells with IMWG 17 probes for IGH, 17p and 1q21 shows single (normal) copies of all chromosomes probed (Figure 1C), while the hypotriploid cell shows two (normal) copies of all probes (Figure 1D). Analysis of patients for IGH translocations identified one patient each with a t(11;14) (q13;q32) (# 11) (Table 1), a t(4;14) (# 9), and a t(6;14) (# 32) (Supplemental Table 2).
Table 1.
Clinical characteristics and G-band karyotypes of hyperhaploid patients.
| Pt# | Age | Sex | Isotype | L-Chain | DS | ISS | Karyotype |
|---|---|---|---|---|---|---|---|
| 1 | 38 | M | IgG | Kappa | 0 | I | 31,X,+3,+7,add(7)(p22),(8)(q24),+9,+11,-13,+15,+18,+19,+21[9]/60, idemx2,+Y,+7,?del(13)(q32),+mar[10] |
| 2 | 41 | M | Free L-chain | Kappa | IIIb | III | 31,X,+3,+5,+7,+9,+11,+15,+19,+21[cp11] |
| 3 | 38 | M | Free L-chain | Lambda | Unk | II | 31∼33,X,+3,+7,+8,?add(8)(p22),+9,t(10;11)(q22;p15),+11,add(13)(q34),+18,+19,+20,+21[9] |
| 4 | 28 | M | Free L-chain | Kappa | IIIb | II | 32∼33,X,+Y,+2,+3,+5,+7,+9,+11,+15,+19,+20,del(20)(q11.2)[18] |
| 5 | 64 | F | IgG | Kappa | IIIa | I | 31,X,+3,+5,der(5;9)(q31;q11),+9,+add(7)(q32),+11,+15,?del(17)(p13),+der(17)t(9;17)(p10;q10),+18,+19[22] |
| 6 | 51 | F | IgG | Kappa | Ia | I | 30,X,+3,t(4;9)(q35;q22),+add(7)(p15),+9,+der(11)t(1;11)(q12;p15)add(1)(q42),+der(12;19)(p10;p10),+18,+add(21)(q22)[cp14]/60,idemx2[6] |
| 7 | 57 | M | Free L-chain | Kappa | Ia | 0 | 34,X,+Y,+2,+3,+5,+7,+9,+11,der(12)t(1;12)(p?32;q?23),+15,add(17)(p?11.1),+18,+19,+20,+add(21)(p11.2)[cp9] |
| 8 | 64 | M | IgG | Kappa | IIa | I | 65,XXY,-1,-2,+3,-4,-6,+7,-8,+9,-10,+11,-12,-13,-14,+15,-16,-17,+18,-19,-20,+21,+mar[2] |
| 9 | 53 | M | IgG | Kappa | IIIa | 0 | 31,X,+3,+7,+9,+11,+15,+18,+19,+mar[12]/61∼63,idem,+marx2[cp8] |
| 10 | 36 | M | IgG | Kappa | IIIb | II | 32∼33,X,+3,+del(5)(q?23q?34),+del(7)(q22q?35),+9,+11,+15,+18,+19,+der(20)t(1;20)(q12;q13.3),+21[cp16] |
| 11 | 66 | F | IgG | Kappa | IIIa | I | 62,XXX,-1,-2,+3,-4,-5,-6,-7,+9,+9,-13,-13,der(14)t(11;14)(q12∼13.1;q32)x2,-16,-17,+18,+19,-21,-22[7] |
| 12 | 49 | F | IgG | Kappa | III | I | 32∼33,X,+X,+3,+5,+7,+9,t(9;11)(p13;q23),+11,+15,+18,+19,+21[cp16]/57∼64,idem,+X,-11[cp4] |
| 13 | 60 | F | Free L-chain | Lambda | IIIa | I | 32,X,+3,+del(5)(q31),-6,+7,+8,add(8)(q24.3)x2,+9,+11,+15,+18,+19,+21[6] |
| 14 | 48 | M | IgG | Lambda | IIIb | III | 30,X,+3,+5,t(5;18)(q?15;q23),+7,t(7;14)(p22;q24),+11,+15,+18,+19[19] |
| 15 | 39 | M | IgG | Kappa | IIIb | III | 31,X,+?Y,+3,+7,+9,+11,+15,+19,+21[4]/55∼63,idemx2[cp6] |
| 16 | 48 | F | IgG | Lambda | IIIa | II | 32,X,+3,+5,+7,+9,+11,+15,+18,+19,+21[cp15]/64,idemx2[1] |
| 17 | 57 | M | IgG | Kappa | IIIa | I | 33∼34,X,+Y,dup(1)(q21q31),der?(3)(1;3)(q?21;p?13),+del(5)(q31),add(6)(q27),+7,+8,+9,+11,+15,+18,+add(19)(q13.1),+20,+mar[cp15]/60∼69, idemx2[cp5] |
| 18 | 52 | M | IgG | Kappa | Ia | I | 31,X,+1,der(1;19)(q10;p10),+del(3)(p21),+add(5)(q13),+7,+9,+11,+15,+der(15;22)(q10;q10)del(22)(q13),+add(18)(q22),+19,+del(22)(q13)[cp18]/61∼62,idemx2[cp2] |
| 19 | 36 | M | IgG | Kappa | IIIa | II | 33,X,+Y,der(1)t(1;?1)(q?32;p?22),+3,add(5)(q35),del(6)(q25),+7,+8,+9,+11,+del(13)(q12q22),+del(18)(q12.2q21.2),+19, der(19)t(1;19)(q21;q13.4)+21[13]/66,idemx2[4]/∼99,idemx3[1] |
| 20 | 72 | M | IgG | Kappa | IIIa | I | 30,X,+3,+t(7;15)(q11.2;q22),t(8;15)(q13;q24),+9,+11,+del(11)(q13),add(12)(p13),+18[cp7]/61,idemx2[1] |
| 21 | 46 | M | IgG | Kappa | IIIa | II | 33,X,+Y,+3,+5,+7,+9,+11,+15,+18,+19,+?21[cp8] |
| 22 | 37 | M | IgG | Kappa | IIIa | II | 31,XY,+3,+7,+9,+11,+18,+19,+21,inc[cp7] |
| 23 | 70 | F | IgG | Kappa | IIIa | III | 31∼33,X,+3,+5,+7,+9,+11,t(11;14)(p13;q11.1),+14,+15,+19,+21[18]/64∼68,idemx2,inc[2] |
| 24 | 66 | F | Nonsecretory | Kappa | IIIa | I | 32∼33,X,+3,+7,+8,+9,+9,?t(9;14)(q13;q32),+11,+15,+19,+21,-22,+mar1,+mar2[cp10] |
| 25 | 50 | M | IgG | Lambda | IIIa | II | 32,X,+3,+5,+7,?add(8)(p21),+9,+11,+15,add(15)(p11.2),+18,+19,+del(20)(q11.2)[cp20] |
| 26 | 48 | M | IgG | Kappa | IIIa | I | 33,X,+Y,+3,+5,+7,+9,+11,+15,+18,+19,+21[15]/66,idemx2[1] |
| 27 | 53 | M | IgG | Kappa | IIa | II | 33,X,dup(1)(q12q31),+3,+5,+7,+9,+11,+14,+15,+18,+19,+21[cp18] |
| 28 | 45 | M | Free L-chain | Kappa | Ia | I | 34,X,+3,+5,+7,+8,+9,+?10,+11,+15,+18,+21[cp6] |
| 29 | 70 | M | IgG | Kappa | IIa | I | 33,t(X;3)(p22.3;q25),+3,+5,+7,+9,+10,+11,+15,+18,add(18)(q23),+add(19)(q13.4),+21,der(21)t(?4;21)(q25;p11.2),inc[cp4] |
| 30 | 46 | M | IgG | Kappa | III | II | 32∼33,X,add(2)(q37),+3,der(3)t(1;3)(q12;p26),+7,+9,+11,+der(11;15)(q10;q10),+14,+18,+der(19)add(19)(p13.3)del(19)(q13.1),+21,+mar[cp17] |
| 31 | 36 | F | IgG | Kappa | IIIa | I | 30∼31,X,+del(3)(q21),+5,+7,+9,+11,+15,+18,+19[cp13] |
| 32 | 55 | M | Free L-chain | Lambda | IIIa | II | 32∼33,X,der(1;5)(p10;q10),+der(1;21)(q10;q10),+3,+5,+del(6)(p21.1),+7,+add(8)(q24.1),der(8)t(1;8)(q?21;p?23),+?der(9)t(6;9) (p21.1;p24)del(9)(q22),+11,-14,+15,+16,?inv(16) (p13.1q22), +17,+22[cp5] |
| 33 | 72 | M | Free L-chain | Lambda | Ia | II | 31,X,-Y,+3,+5,+7,+9,del(9)(p21),+11,+15,+19,+21[2]/61∼63,idemx2[cp3] |
ABBREVIATIONS Pt: Patient; L-Chain: Light Chain; DS: Durie Salmon; ISS: International Staging System
Figure 1.

Representative spectral karyotypes (SKY) and mFISH of patient # 33 showing the doubling chromosomes in a hyperhaploid clone (A-B) resulting in a hypotriploid subclone (C-D). A) A SKY karyotype of a hyperhaploid cell showing 32 chromosomes and the structural aberration of del 9p (arrow). B) The same SKY metaphase karyotype rehybridized with locus-specific mFISH probes to chromosomes 1, 14, and 17 illustrates the FISH findings with IMWG probe set. Note the single copies of probes to 1q12 (red), 1q21 (green) (top), 14q32 (fused red and green) (middle), and 17p13 (green), 17q12 (red) (bottom) denotes an abnormal iFISH finding. C) A SKY karyotype of a hypotriploid subclone from the same patient showing the exact doubling of chromosomes of the hyperhaploid clone, including the del 9p (arrows). D) The same SKY hypotriploid karyotype rehybridized with locus-specific mFISH, showing two copies of probes to 1q12 (red), 1q21 (green) (top), 14q32 (fused red and green) (middle), 17p13 (green) and 17q12 (red) (bottom). This “masked” hypotriploid subclone is normal by iFISH (not shown) with the IMWG probe set.
iFISH identified eleven of 13 patients as monosomic for chromosomes 1, 13 and 17 (Supplemental Table 1). Unexpectedly, discordant findings were found between the iFISH and G-band studies in three patients. Two patients (#s 26 & 33) showed iFISH results with two copies for all iFISH probes, instead of the expected one (Supplemental Table 1). This discrepancy was traced to a 20% cut-off calculation for numerical aberrations used in the iFISH analysis.25,26 In review, patient # 26 showed monosomy in 3-8% of cells and patient # 33 showed monosomy in 2-11% of cells, both below the cut-off value. These findings indicate the need for reevaluation of the widely used 20% cut-off for the detection of numerical aberrations by iFISH25,26. Equally important is that in these patients hypotriploid clones are “masked” to the current IMWG probe set if they are normal for IGH, and show two copies for 17p and 1q21 (Figure 1B). The third patient (# 32) with a discrepancy between iFISH and G-band results showed monosomy 1 and monosomy for 17p, but also showed two copies of 17q (Figure 2A, Supplemental Table 1). A subsequent G-band specimen resolved the discrepancy by analysis with mFISH and SKY which showed a derivative whole-arm translocation of 19p to 17q (Figure 2B), resulting in the deletion of 17p (Figure 2C). This result demonstrates an unexpected iFISH pattern for monosomy 17p in hyperhaploid clones occurs by whole-arm translocations (Figure 2C), and secondary amplification of 1q21 by a jumping translocation of 1q12 (JT1q12) (Figure 2C).
Figure 2.

Representative interphase cIgFISH, SKY, and mFISH of cells from patient # 32 showing CNAs resulting in 17p- and gain of 1q21. A) cIgFISH shows one signal for 1p13 (green) and one signal for 1q21 (red) (top panel), and one copy of 17p13 (red) and two copies of 17q12 (green) (bottom panel) indicating monosomy 1 and deletion 17p. B) SKY karyotype of bone marrow shows t(6;14), and whole-arm translocation of 19p to 17q resulting in the deletion of 17p. C) Representative partial karyotypes illustrated SKY (on left of each pair) and mFISH (on right of each pair) showing complex chromosome 1 rearrangements involving a der(1)t(1;5) and der(9)t(1;9) resulting in CN gain of 1q21 (top row). The bottom row shows a whole-arm translocation of 19p to 17q10 by SKY (left) resulted in the deletion of 17p. mFISH (right) shows loss of 17p13 (green) and two copies of 17q12 (red).
Metaphase FISH identified a single copy of 17p in the hyperhaploid clones of all eleven patients tested, and two copies of 17p, as expected, in the hypotriploid clones (Supplemental Table 2). Importantly, no evidence of hyperdiploid or non-hyperdiploid clones was found in any patient by G-banding, iFISH, or mFISH, indicating that hyperhaploid clones most likely arise independently of the other ploidy groups in MM.
Gain of 1q21 was identified in seven patients (#s 6, 10, 17, 18, 27, 30, 32) by G-banding (Table 1). Five patients (#s 17, 18, 27, 30, 32) had adequate sample for further mFISH and/or SKY analysis. mFISH probes for 1q12 and 1q21 identified amplification of 1q21 as direct duplications of 1q21-31 in two patients (#s 17, 27), and three with JT1q12 (#s 18, 30, 32). Strikingly, one case (# 30) showed high levels of 1q21 amplification originating on two different chromosomes: at both 1q12 as expected, and also on a RC 3. In this patient a CN of 2 was found in the hyperhaploid clone (amplified in the context of hyperhaploidy) resulting from a JT1q12 to RC 3pter (Figure 3A). Intraclonal heterogeneity for 1q21 CNs in this patient ranged from 2 to 4 in the hyperhaploid clone as a result of triradials of chromosome 1q12 (Figure 3B), iso1q21 (Figure 3C) and triradials of 3p (Figure 3D and E). The doubling of all the chromosomes to a hypotriploid subclone (Figure 3F) resulted in a CN of 8 for 1q21 (Figure 3G). The finding of triradials and multiradials originating on two different chromosomes (1q12 and 3pter) is rare and demonstrates that 1q12 pericentromeric heterochromatin can increase CN of 1q21 regardless of it's genomic position.
Figure 3.
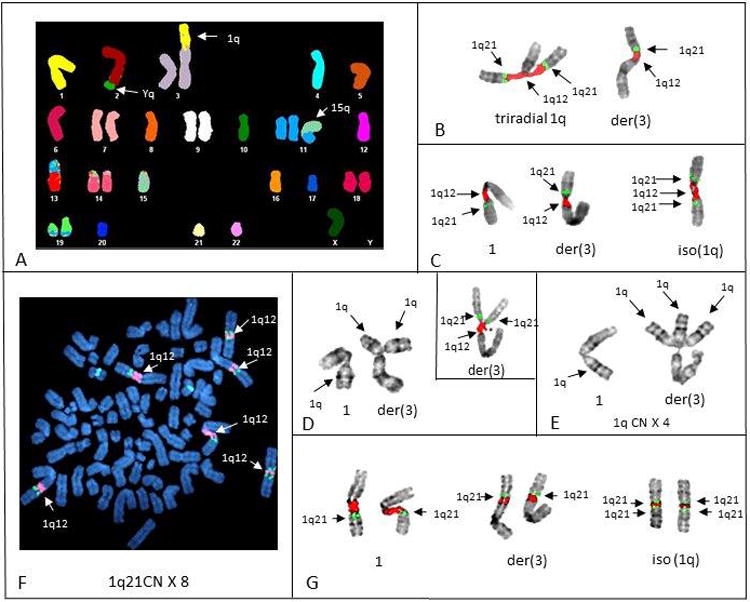
Representative SKY, mFISH, and G-banding of chromosomes of patient # 30 showing the origin and progression of 1q21 amplification. A) SKY karyotype shows multiple structural aberrations in hyperhaploid cell and an extra copy of 1q on 3p. B) Inverse DAPI banding of mFISH shows triradial of chromosome 1q12 (red), is the origin of a third copy of 1q21 (green) in this cell. C) Inverse DAPI banding shows three copies of 1q12 (red) and four copies of 1q21 (green) resulting from an isochromosome 1q21 in this cell. D) G-banding of normal 1 (left) and triradial of 1q12 on 3p (right). Insert shows mFISH of a different triradial on 3p demonstrating one copy of 1q12 (red) and two copies of 1q21 (green). E) G-banding of normal chromosome 1 on left, and three copies of 1q21 resulting from a multiradial of 1q12 on the der(3). F) Metaphase spread of hypotriploid cell (DAPI counter stain) showing the exact doubling of the all normal and abnormal chromosomes 1 found in Figure 3C. Note a CN doubling of 1q12 (red) to 6 and 1q21 to 8. G) Partial karyotypes (inverse DAPI bands) of chromosomes 1 in (Figure 3F) shows the presence of two normal 1s (left), two der(3)s (middle), and two isochromosomes 1q12, resulting in a CN of 8 for 1q21 (green) in this hypotriploid subclone.
Overall Survival and Multivariate Analysis
Overall survival (OS) for 33 hyperhaploid patients indicates poor prognosis, with a five-year survival rate of 23.1% (Figure 4A). When compared with cases from TT3 hyperhaploids have a significantly worse prognosis than hypodiploid cases with a log rank p-value of 0.015 (Figure 4A). Outcome of hyperhaploids is equivalent with that of the highest risk forms of multiple myeloma: cases with ISS stage III and GEP70 HR (log rank p-value 0.413, Figure 4B).
Figure 4.

Kaplan-Meier survival curves for hyperhaploid cases.
Kaplan-Meier overall survival curves for hyperhaploid cases compared with TT3 patient cohort split by cytogenetic abnormalities (A) and GEP70 risk plus ISS stage (B). Hyperhaploid cases have an outcome that is significantly worse than all other cytogenetic abnormalities, including hypodiploidy (hyperhaploidy vs hypodiploidy: log rank p-value of 0.015). Additionally, the outcome of hyperhaploid cases is on par with the performance of patients exhibiting the highest risk features: those with ISS Stage III and GEP70 HR (hyperhaploid vs ISS III & GEP70 HR: logrank p-value of 0.413).
A comparative univariate analysis between hyperhaploid cases and TT3 cases, split by GEP70 risk, revealed that hyperhaploid cases are similar to TT3 LR cases in all clinical feature but LDH (Table 2A). Hyperhaploid cases were statistically different from TT3 GEP70 HR cases according to the proportion of ISS Stage III cases with each group (15.4% in HH vs 48.7% in GEP70 HR). A multivariate model determined through backwards selection, identified Age, ISS Stage III, CRP, presence of an abnormal karyotype and hyperhaploidy as significant independent prognostic factors (Table 2B). Hypodiploid status did not retain significance following stepwise selection, indicating that the presence of hyperhaploidy adds greater prognostic value than hypodiploidy alone. Overall these analyses indicate that hyperhaploid cases may have similar clinical feature as LR disease with an outcome that is on par with the highest risk form of myeloma.
Table 2.
- Univariate analysis revealed that hyperhaploid cases were similar in clinical features to TT3 GEP70 LR, with only LDH values being significantly different in the hyperhaploid cohort. TT3 GEP70 HR cases were more frequently ISS Stage III than hyperhaploid cases (48.7% vs 15.4%, Fisher's exact test p-value of 0.003) indicating that the GEP70 HR cohort had worse clinical features than the hyperhaploid cohort. All p-values reported are two-sided Fisher's exact tests.
- The multivariate model results from backwards selection of the univariate variables across the TT3 and hyperhaploid cohort of patients revealed age, ISS Stage III, CRP, abnormal karyotype, and presence of hyperhaploidy as independent prognostic factors. Presence of hypodiploidy did not retain significance through model selection, indicating that hyperhaploid designation holds greater prognostic value than hypodiploid status alone. Hyperhaploid status also had the largest hazard ratio of all other variables included in the multivariate model.
| A | |||
|---|---|---|---|
| Univariate Analysis | Hyper-haploid | TT3 GEP70 LR | TT3 GEP70 HR |
| Variable | |||
| Age > 65 | 5/33 (15.2) | 99/363 (27.3) 0.151 | 21/76 (27.6) 0.222 |
| Male | 24/33 (72.7) | 243/363 (66.9) 0.565 | 39/76 (51.3) 0.057 |
| ISS Stage III | 4/26 (15.4) | 60/363 (16.5) 1.000 | 37/76 (48.7) 0.003 |
| Creatinine > 2.0 mg/dL | 3/27 (11.1) | 16/363 (4.4) 0.136 | 13/76 (17.1) 0.552 |
| LDH > 250 IU/L | 6/26 (23.1) | 19/363 (5.2) 0.004 | 18/76 (23.7) 1.000 |
| CRP > 30 mg/L | 4/23 (17.4) | 22/363 (6.1) 0.059 | 14/76 (18.4) 1.000 |
| Presence of Hypodiploidy | 33/33 (100.0) | 21/363 (5.8) < 0.001 | 31/76 (40.8) < 0.001 |
| Abnormal Karyotype | 33/33 (100.0) | 75/363 (20.7) < 0.001 | 52/76 (68.4) < 0.001 |
| GEP70 HR | 4/12 (33.3) | 0/363 (0.0) < 0.001 | 76/76 (100.0) <0.001 |
| B | |||
|---|---|---|---|
| Multivariate Survival Model | Coefficient | Hazard Ratio | p-value |
| Variable | |||
| Age > 65 | 0.455 | 1.576 | 0.003 ** |
| ISS Stage III | 0.886 | 2.426 | < 0.001 *** |
| CRP > 30 mg/L | 0.509 | 1.663 | 0.017 * |
| Abnormal Karyotype | 0.632 | 1.881 | < 0.001 *** |
| Presence of Hyperhaploidy | 1.156 | 3.178 | < 0.001 *** |
Discussion
Based on cytogenetic and molecular studies multiple myeloma is considered to be composed of many disease entities with two main numerical subtypes. The largest is the hyperdiploid subtype with higher chromosome numbers and recurring trisomies of chromosome 3, 5, 7, 9, 11, 15, 19, and 21. The second major subtype is the hypodiploid (non-hyperdiploid) group without trisomies and with one of several immunoglobulin heavy chain (IgH) rearrangements. The hypodiploid group is characterized by the loss of chromosomes 13, 14, 16 and 22, and adverse IGH translocations including the t(4;14), t(14;16), and t(14;20).
Here we report a subtype of MM composed of hyperhaploid clones and hypotriploid subclones. These distinctive karyotypes resemble hyperdiploid clones in two ways. First, the numerical aberrations involve essentially the same set of autosomes in disomy instead of trisomy, with the exception of the chromosome 18. Secondly, based on our limited numbers, these clones have fewer IGH translocations (Tables 1, and Supplemental Table 2). The origins of numerical aberrations in MM are currently unknown. It is intriguing that the same set of chromosomes found in disomy in these hyperhaploid clones are found in trisomies in hyperdiploid clones. This suggests the possibility that the origin of these different clones somehow involves the set same chromosomes are aligned on the mitotic plaque in a similar manner, but undergo different segregation patterns due to variations in the spindle apparatus and/or centrosomedefects.27-29 It also seems plausible that the same types of spindle or centrosome defects that result in the catastrophic loss of a haploid set of chromosomes in hyperdiploid ALL30,31 also results in the catastrophic loss of chromosomes in hyperhaploid MM. Although it is tempting to speculate that the hyperhaploid clones result from the loss of a complete set of normal chromosome from a hyperdiploid cell, we found no evidence of hyperdiploid clones in any of the patients analyzed. Accordingly, these clones appear to arise independently of hyperdiploid clones by a catastrophic loss of chromosomes from a diploid cell, as has been found in other hyperhaploid malignancies.5,11
In patients with MM, the major clones are believed to be most responsible for prognosis, while minor clones are known to provide a reservoir for relapse.31 Specific types of cytogenetic lesions such as 17p deletions when found in a higher proportion of cells are also known to be associated with shorter survival.32-34 Consequently, the ability to detect minor clones in patients harboring hyperhaploid and/or hypotriploid clones with monosomy 17p is clinically very important. Our findings here, and those of others suggest that an unknown number of patients with hypotriploid or near triploid clones likely passed through a hyperhaploid stage without detection, and that the double chromosome number in a near triploid clone can become the dominating clone and mask the presence of a hyperhaploid origin.5,11,36 In this study both routine cytogenetics and iFISH strategies were uninformative in identifying certain clones. Metaphase cytogenetics is known to be uninformative because of the low proliferation of the plasma cells, while iFISH can be uninformative because of improper probe selection or inappropriate cut-off values. For example, in patients # 26 and 33 iFISH results were uninformative (Supplemental Table 1) due to cut-off values set too high to detect the minor clones involving monosomies. The commonly used cut-off value for the interpretation of numerical abnormalities in MM is 20%,25,26 suggesting this value needs to be reevaluated for the detection of this novel subgroup of patients. Equally important is that in even with lower cut-offs, the hypotriploid subclones in these patients are cryptic or “masked” to the presence of monosomy 17p due to the reduplication of all the chromosomes (Figure 2B). These “masked” clones occur in an as yet unknown number of patients. The probes sets for the detection of the common trisomies 3, 5, 7, 9, 11 and 15 in hyperdiploid myeloma can easily be mis-interpreted as normal since hyperhaploid clones have the normal copy number for these chromosomes. Hypotriploid clones will be identified abnormal with two extra copies of 3, 5, 7, 9, 11, and 15; however, by iFISH this set of extra chromosomes will most likely be incorrectly interpreted as a tetraploid clone rather than a hypotriploid subclone (Figure 1C).
The accumulation of secondary CNAs is a known mechanism for clonal evolution and intraclonal heterogeneity during the progression of MM. Secondary CNAs involving deletions of 1p and 13q are well documented in MM and it is believed that monosomies of these chromosomes are also clinically important.37-39 Chromosome 1p has been shown to harbor a number of under-expressed genes and deletions of specific genes including CDKN2C, FAF1 and FAM46C, among others.1 In fact, in addition to t(4;14) and del17p, the deletion of 1p32 has recently been shown to be a main factor negatively impacting survival.38 Copy number gains of 1q21 are common in MM and in these 33 patients involved direct duplications of 1q21∼23, whole-arm translocations of 1q12, and jumping translocations of 1q12 (JT1q12). 40,41 As in hyperdiploid and non-hyperdiploid MM, instability of 1q12 pericentromeric heterochromatin was also a factor in the amplification of 1q21. The CN gains of 1q21 were identified originating from the formation of triradials of 1q12, but also on chromosome 3p (Figure 3), and are thought to be associated with the hypomethylation of the 1q12 pericentromeric region.41
The clinically important cytogenetic lesions in these karyotypes include several monosomies inherently present in these clones, including 17p, 1p, 13q, and 16q.1 Significantly, the reduplication of chromosomes in the hyperhaploid clones to a hypotriploid subclone results in these monosomic clones being duplicated and therefore becoming masked to the commonly used iFISH probes for the identification of CNAs. Our findings suggest current iFISH cut-off values and probe selections for the identification of these clones need to be reevaluated. Surprisingly, hyperhaploid clones result in the retention of disomies 3, 5, 7, 9, 11, 15, 18, and 21, which to our knowledge represents the minimal disomic and monosomic chromosome constitution for a viable plasma cell clone. The total lack of trisomies and large number of monosomies in this subset of patients provides a unique patient group for multiple types of array and single cell genomic analysis.43 Recently, risk stratification in ALL has combined the use of genomic and cytogenetic data and has identified the near haploidy and low hypodiploidy groups as poor risk.44 In this group of patients the OS was likewise poor, with a five-year survival rate of 23.1% (Figure 4A). In general, hyperhaploids have an outcome that is similar to cases with extremely adverse risk profiles- cases with ISS stage III and GEP70 HR. 23 The correct identification and interpretation of these distinctive clones is critical since risk stratification and treatment decisions are based in part on the iFISH detection of 17p and 1q21.
Supplementary Material
Acknowledgments
We would like to thank the patients and staff of the Myeloma Institute for Research and Therapy. This work was supported in part by PO1 grant CA 0055819 from the National Cancer Institute.
Footnotes
Authorship Contributions: JRS analyzed and interpreted data, and wrote the manuscript. CMS, CS, CLH, LP, ML, GS, and JDS analyzed data. ET perform iFISH, JLL performed mFISH and SKY studies. JE, CS, and CB provided statistical analysis. MZ, FED, FvR and BB provided patient samples. BB and GJM wrote and reviewed the manuscript.
Conflict of Interest: The authors declare no conflict of interest.
References
- 1.Morgan GJ, Walker BA, Davies FE. The genetic architecture of multiple myeloma. Nat Rev Cancer. 2012;12(5):335–48. doi: 10.1038/nrc3257. [DOI] [PubMed] [Google Scholar]
- 2.Smadja NV, Bastard C, Brigaudeau C, Leroux D, Fruchart C Groupe Français de Cytogénétique Hématologique. Hypodiploidy is a major prognostic factor in multiple myeloma. Blood. 2001 Oct 1;98(7):2229–38. doi: 10.1182/blood.v98.7.2229. [DOI] [PubMed] [Google Scholar]
- 3.Bergsagle PL, Chesi M. Molecular classification and risk stratification of myeloma. Hematol Onco. 2013;31(Suppl. 1):38–41. doi: 10.1002/hon.2065. [DOI] [PMC free article] [PubMed] [Google Scholar]
- 4.Shaffer LG, McGowan-Jordan J, Schmid M, editors. ISCN (2013) An International System for Human Cytogenetic Nomenclature. S.Kager; Basel: 2013. [Google Scholar]
- 5.Mandahl N, Johansson B, Mertens F, Mitelman F. Disease-Associated patterns of Disomic Chromosomes in Hyperhaploid Neoplasms. Genes Chrom Cancer. 2012;51:536–544. doi: 10.1002/gcc.21947. [DOI] [PubMed] [Google Scholar]
- 6.Pantou D, Rizou H, Tsarouha H, Pouli A, Papanastasiou K, Stamatellou M, et al. Cytogenetic manifestations of multiple myeloma heterogeneity. Genes Chromosomes Cancer. 2005 Jan;42(1):44–57. doi: 10.1002/gcc.20114. [DOI] [PubMed] [Google Scholar]
- 7.Mohamed AN, Bentley G, Bonnett ML, Zonder J, Al-Katib A. Chromosome aberrations in a series of 120 multiple myeloma cases with abnormal karyotypes. Am J Hematol. 2007 Dec;82(12):1080–7. doi: 10.1002/ajh.20998. [DOI] [PubMed] [Google Scholar]
- 8.Gabrea A, Martelli ML, Qi Y, Roschke A, Barlogie B, Shaughnessy JD, Jr, et al. Secondary genomic rearrangements involving immunoglobulin or MYC loci show similar prevalences in hyperdiploid and nonhyperdiploid myeloma tumors. Genes Chromosomes Cancer. 2008 Jul;47(7):573–90. doi: 10.1002/gcc.20563. [DOI] [PMC free article] [PubMed] [Google Scholar]
- 9.Sawyer JR, Tian E, Thomas E, Koller M, Stangeby C, Sammartino G, et al. Evidence for a novel mechanism for gene amplification in multiple myeloma: 1q12 pericentromeric heterochromatin mediates breakage-fusion-bridge cycles of a 1q12-23 amplicon. Br J Haematol. 2009 Nov;147(4):484–94. doi: 10.1111/j.1365-2141.2009.07869.x. [DOI] [PMC free article] [PubMed] [Google Scholar]
- 10.Hoctor VT, Campbell LJ. Hyperhaploid plasma cell myeloma. Cancer Genet. 2012;205:414–18. doi: 10.1016/j.cancergen.2012.05.004. [DOI] [PubMed] [Google Scholar]
- 11.Harrison C, Johansson B. Acute Lymphoblastic Leukemia. In: Heim S, Mitelman F, editors. Cancer Cytogenetics. 3rd ed. Chapter 9. Wiley-Balckwell; Hoboken NJ: 2009. pp. 233–296. [Google Scholar]
- 12.Fonseca R, Bergsagel PL, Drach J, Shaughnessy J, Gutierrez N, Stewart AK, et al. International Myeloma Working Group. International Myeloma Working Group molecular classification of multiple myeloma: spotlight review. Leukemia. 2009 Dec;23(12):2210–21. doi: 10.1038/leu.2009.174. [DOI] [PMC free article] [PubMed] [Google Scholar]
- 13.Avet-Loiseau H, Li C, Magrangeas F, Gouraud W, Charbonnel C, Harousseau JL, et al. Prognostic significance of copy-number alterations in multiple myeloma. J Clin Oncol. 2009 Sep 20;27(27):4585–90. doi: 10.1200/JCO.2008.20.6136. [DOI] [PMC free article] [PubMed] [Google Scholar]
- 14.Boyd KD, Ross FM, Chiecchio L, Dagrada GP, Konn ZJ, Tapper WJ, et al. A novel prognostic model in myeloma based on co-segregating adverse FISH lesions and the ISS: analysis of patients treated in the MRC Myeloma IX trial. Leukemia. 2012 Feb;26(2):349–55. doi: 10.1038/leu.2011.204. [DOI] [PMC free article] [PubMed] [Google Scholar]
- 15.Mikhael JR, Dingli D, Roy V, Reeder CB, Buadi FK, Hayman SR, et al. Management of newly diagnosed symptomatic multiple myeloma: updated Mayo Stratification of Myeloma and Risk-Adapted Therapy (mSMART) consensus guidelines 2013. Mayo Clin Proc. 2013 Apr;88(4):360–76. doi: 10.1016/j.mayocp.2013.01.019. [DOI] [PubMed] [Google Scholar]
- 16.Avet-Loiseau H, Durie BG, Cavo M, Attal M, Gutierrez N, Haessler J, et al. International Myeloma Working Group. Combining fluorescent in situ hybridization data with ISS staging improves risk assessment in myeloma: an International Myeloma Working Group collaborative project. Leukemia. 2013 Mar;27(3):711–7. doi: 10.1038/leu.2012.282. [DOI] [PMC free article] [PubMed] [Google Scholar]
- 17.Chng WJ, Dispenzieri A, Chim CS, Fonseca R, Goldschmidt H, Lentzsch S, et al. International Myeloma Working Group. IMWG consensus on risk stratification in multiple myeloma. Leukemia. 2014 Feb;28(2):269–77. doi: 10.1038/leu.2013.247. [DOI] [PubMed] [Google Scholar]
- 18.Tian E, Sawyer JR, Heuck CJ, Zhang Q, van Rhee F, Barlogie B, et al. In multiple myeloma, 14q32 translocations are nonrandom chromosomal fusions driving high expression levels of the respective partner genes. Genes Chrom Cancer. 2014;53:549–57. doi: 10.1002/gcc.22165. [DOI] [PMC free article] [PubMed] [Google Scholar]
- 19.Sawyer JR, Lukacs JL, Munshi N, Desikan KR, Singhal S, Mehta J, et al. Identification of new nonrandom translocations in multiple myeloma with multicolor spectral karyotyping. Blood. 1998;92:4269–78. [PubMed] [Google Scholar]
- 20.Kaplan EL, Meier P. Nonparametric estimation from incomplete observations. J Am Stat Assoc. 1958;53:457–81. [Google Scholar]
- 21.Barlogie B, Anaissie E, van Rhee F, Haessler J, Hollmig K, Pineda-Roman M, et al. Incorporating bortezomib into upfront treatment for multiple myeloma: early results of total therapy 3. Br J Haematol. 2007;138(2):176–85. doi: 10.1111/j.1365-2141.2007.06639.x. [DOI] [PubMed] [Google Scholar]
- 22.Barlogie B, Mitchell A, van Rhee F, Epstein J, Morgan GJ, Crowley J. Curing myeloma at last: defining criteria and providing the evidence. Blood. 2014;124(20):3043–51. doi: 10.1182/blood-2014-07-552059. [DOI] [PMC free article] [PubMed] [Google Scholar]
- 23.Shaughnessy JD, Zhan F, Burington BE, Huang Y, Colla S, Hanamura I, et al. A validated gene expression model of high-risk multiple myeloma is defined by deregulated expression of genes mapping to chromosome 1. Blood. 2007;109(6):2276–84. doi: 10.1182/blood-2006-07-038430. [DOI] [PubMed] [Google Scholar]
- 24.van Buuren S, GroothuIs-Oudshoorn K. Mice: Multivariate imputation by chained equations in R. J of Statistcal Software. 2011;45(3):1–67. [Google Scholar]
- 25.Ross FM, Avet-Loiseau H, Ameye G, Gutiérrez NC, Liebisch P, et al. European Myeloma Network. Report from the European Myeloma Network on interphase FISH in multiple myeloma and related disorders. Haematologica. 2012 Aug;97(8):1272–7. doi: 10.3324/haematol.2011.056176. [DOI] [PMC free article] [PubMed] [Google Scholar]
- 26.An G, Li Z, Tai YT, Acharya C, Li Q, Qin X, et al. The impact of clone size on the prognostic value of chromosome aberrations by fluorescence in situ hybridization in multiple myeloma. Clin Cancer Res. 2015 May 1;21(9):2148–56. doi: 10.1158/1078-0432.CCR-14-2576. Clin Cancer Res. [DOI] [PubMed] [Google Scholar]
- 27.Gordon DJ, Resio B, Pellman D. Causes and consequences of aneuploidy in cancer. Nat Rev Genet. 2012 Jan 24;13(3):189–203. doi: 10.1038/nrg3123. [DOI] [PubMed] [Google Scholar]
- 28.Krem MM, Press OW, Horwitz MS, Tidwell T. Mechanisms and clinical applications of chromosomal instability in lymphoid malignancy. Br J Haematol. 2015 Oct;171(1):13–28. doi: 10.1111/bjh.13507. [DOI] [PubMed] [Google Scholar]
- 29.Chng WJ, Ahmann GJ, Henderson K, Santana-Davila R, Greipp PR, Gertz MA, et al. Clinical implication of centrosome amplification in plasma cell neoplasm. Blood. 2006 May 1;107(9):3669–75. doi: 10.1182/blood-2005-09-3810. [DOI] [PMC free article] [PubMed] [Google Scholar]
- 30.Safavi S, Forestier E, Golovleva I, Barbany G, Nord KH, Moorman AV, et al. Loss of chromosomes is the primary event in near-haploid and low-hypodiploid acute lymphoblastic leukemia. Leukemia. 2013 Jan;27(1):248–50. doi: 10.1038/leu.2012.227. [DOI] [PubMed] [Google Scholar]
- 31.Paulsson K, Morse H, Fioretos T, Behrendtz M, Strombeck B, Johansson B. Evidence for a single-step mechanism in the origin of hyperdiploid childhood acute lymphoblastic leukemia. Genes Chrom Cancer. 2005;44:113–22. doi: 10.1002/gcc.20222. [DOI] [PubMed] [Google Scholar]
- 32.Magrangeas F, Avet-Loiseau H, Gouraud W, Lodé L, Decaux O, Godmer P, et al. Minor clone provides a reservoir for relapse in multiple myeloma. Leukemia. 2013;27(2):473–81. doi: 10.1038/leu.2012.226. [DOI] [PMC free article] [PubMed] [Google Scholar]
- 33.Corre J, Munshi N, Avet-Loiseau H. Genetics of multiple myeloma: another heterogeneity level? Blood. 2015 Mar;12(125):1870–76. doi: 10.1182/blood-2014-10-567370. [DOI] [PMC free article] [PubMed] [Google Scholar]
- 34.Avet-Loiseau H, Soulier J, Fermand JP, Yakoub-Agha I, Attal M, Hulin C IFM and MAG groups. Impact of high-risk cytogenetics and prior therapy on outcomes in patients with advanced relapsed or refractory multiple myeloma treated with lenalidomide plus dexaméthasone. Leukemia. 2010 Mar;24(3):623–8. doi: 10.1038/leu.2009.273. [DOI] [PubMed] [Google Scholar]
- 35.Avet-Loiseau H, Attal M, Campion L, Caillot D, Hulin C, Marit G, et al. Long-term analysis of the IFM 99 trials for myeloma: cytogenetic abnormalities [t(4;14), del(17p), 1q gains] play a major role in defining long-term survival. J Clin Oncol. 2012 Jun 1;30(16):1949–52. doi: 10.1200/JCO.2011.36.5726. [DOI] [PubMed] [Google Scholar]
- 36.Stark B, Jeison M, Gobuzov R, Krug H, Glaser-Gabay L, Luria D, et al. Near haploid childhood acute lymphoblastic leukemia masked by hyperdiploid line: detection by fluorescence in situ hybridization. Cancer Genet Cytogenet. 2001;128:108–13. doi: 10.1016/s0165-4608(01)00411-3. [DOI] [PubMed] [Google Scholar]
- 37.Chang H, Jiang A, Qi C, Trieu Y, Chen C, Reece D. Impact of genomic aberrations including chromosome 1 abnormalities on the outcome of patients with relapsed or refractory multiple myeloma treated with lenalidomide and dexamethasone. Leuk Lymphoma. 2010 Nov;51(11):2084–91. doi: 10.3109/10428194.2010.524325. [DOI] [PubMed] [Google Scholar]
- 38.Boyd KD, Ross FM, Walker BA, Wardell CP, Tapper WJ, Chiecchio L, et al. NCRI Haematology Oncology Studies Group. Mapping of chromosome 1p deletions in myeloma identifies FAM46C at 1p12 and CDKN2C at 1p32.3 as being genes in regions associated with adverse survival. Clin Cancer Res. 2011 Dec 15;17(24):7776–84. doi: 10.1158/1078-0432.CCR-11-1791. [DOI] [PMC free article] [PubMed] [Google Scholar]
- 39.Hebraud B, Magrangeas F, Cleynen A, Lauwers-Cances V, Chretien ML, Hulin C, et al. Role of additional chromosomal changes in the prognostic value of t(4;14) and del(17p) in multiple myeloma: the IFM experience. Blood. 2015 Mar 26;125(13):2095–100. doi: 10.1182/blood-2014-07-587964. [DOI] [PMC free article] [PubMed] [Google Scholar]
- 40.Sawyer JR, Tricot G, Mattox S, Jagannath S, Barlogie B. Jumping translocations of chromosome 1q in multiple myeloma: evidence for a mechanism involving decondensation of pericentromeric heterochromatin. Blood. 1998;91(5):1732–41. [PubMed] [Google Scholar]
- 41.Sawyer JR, Tian E, Heuck CJ, Epstein J, Johann DJ, Swanson CM, et al. Jumping translocations of 1q12 in multiple myeloma: a novel mechanism for deletion of 17p in cytogenetically defined high-risk disease. Blood. 2014 Apr 17;123(16):2504–12. doi: 10.1182/blood-2013-12-546077. [DOI] [PMC free article] [PubMed] [Google Scholar]
- 42.Sawyer JR, Tian E, Heuck CJ, Johann DJ, Epstein J, Swanson CM, et al. Evidence of an epigenetic origin for high-risk 1q21 copy number aberrations in multiple myeloma. Blood. 2015 Jun 11;125(24):3756–9. doi: 10.1182/blood-2015-03-632075. [DOI] [PMC free article] [PubMed] [Google Scholar]
- 43.Melchor L, Brioli A, Wardell CP, Murison A, Potter NE, Kaiser MF, et al. Single-cell genetic analysis reveals the composition of initiating clones and phylogenetic patterns of branching and parallel evolution in myeloma. Leukemia. 2014 Aug;28(8):1705–15. doi: 10.1038/leu.2014.13. [DOI] [PubMed] [Google Scholar]
- 44.Moorman AV, Enshaei A, Schwab C, Wade R, Chilton L, Elliott A, et al. A novel integrated cytogenetic and genomic classification refines risk stratification in pediatric acute lymphoblastic leukemia. Blood. 2014 Aug 28;124(9):1434–44. doi: 10.1182/blood-2014-03-562918. [DOI] [PubMed] [Google Scholar]
Associated Data
This section collects any data citations, data availability statements, or supplementary materials included in this article.