Abstract
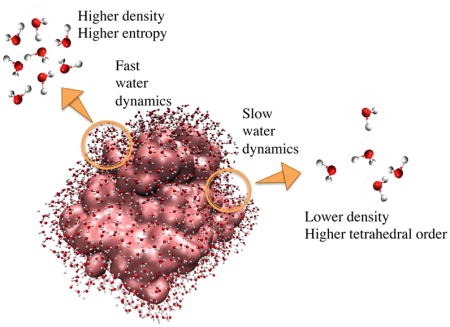
The enzyme Candida Antarctica lipase B (CALB) serves here as a model for understanding connections among hydration layer dynamics, solvation shell structure, and protein surface structure. The structure and dynamics of water molecules in the hydration layer were characterized for regions of the CALB surface, divided around each α-helix, β-sheet, and loop structure. Heterogeneous hydration dynamics were observed around the surface of the enzyme, in line with spectroscopic observations of other proteins. Regional differences in the structure of the biomolecular hydration layer were found to be concomitant with variations in dynamics. In particular, it was seen that regions of higher density exhibit faster water dynamics. This is analogous to the behavior of bulk water, where dynamics (diffusion coefficients) are connected to water structure (density and tetrahedrality) by excess (or pair) entropy, detailed in the Rosenfeld scaling relationship. Additionally, effects of protein surface topology and hydrophobicity on water structure and dynamics were evaluated using multiregression analysis, showing that topology has a somewhat larger effect on hydration layer structure-dynamics. Concave and hydrophobic protein surfaces favor a less dense and more tetrahedral solvation layer, akin to a more ice-like structure, with slower dynamics. Results show that pairwise entropies of local hydration layers, calculated from regional radial distribution functions, scale logarithmically with local hydration dynamics. Thus, the Rosenfeld relationship describes the heterogeneous structure-dynamics of the hydration layer around the enzyme CALB. These findings raise the question of whether this may be a general principle for understanding the structure-dynamics of biomolecular solvation.
Graphical Abstract
Protein hydration layer dynamics vary by region, and depend on structure (density and tetrahedrality) of local water layer
1 Introduction
In general, water dynamics slow at surfaces, relative to how quickly water molecules move in bulk solvent. Hydration dynamics, or the dynamics of water within the first few biomolecular solvation shells, have been implicated in various aspects of protein function, including molecular recognition and protein dynamics. Not all water at protein surfaces are slowed to the same extent; rather, heterogeneous water dynamics have been spectroscopically observed around proteins.1–12 Clearly, heterogeneous water dynamics in hydration layers have their origins in how the water molecules interact with the biomolecular surface. Heterogeneity in water dynamics has been connected to topological heterogeneity at the protein surface. For example, Berne and co-workers recognized that water molecules near a concave protein surface reside for a much longer time than those near a convex protein surface.13 In later simulation studies, Laage et al. studied how a biomolecule affects the water hydrogen bond and reorientation dynamics, and observed that differences in reorientation dynamics depend on whether the local surface is concave or convex, which is an entropic effect arising from the availability of approaching, new hydrogen bond partners.14 Further, they observed that protein-water hydrogen bond dynamics are also dependent on the strengths of the initial hydrogen bonds, which contribute an enthalpic term to the protein-water hydrogen bond lifetime.
NMR studies on globular proteins (bovine pancreatic trypsin inhibitor, ubiquitin, and bovine β-lactoglobulin) indicated that most water in the hydration shells of these globular proteins undergo a generic slowdown, with protein-specific results observed in secluded or buried water exhibiting dramatically slower dynamics.4 Laage and co-workers suggested that the common behavior amongst the majority of hydration shell water could be explained using excluded volume effects, i.e the protein surface curvature.14
Bulk liquid water has a tetrahedral structure (Fig. 1),15 often characterized using radial distribution functions, that is governed by highly networked hydrogen bonding interactions.16 Water at biomolecular surfaces likewise have structure. In the protein hydration layer, water structure and protein structure are interconnected, since chemical heterogeneity (polar, non-polar groups) at the protein surface alters the structure of the hydration layer.
Fig. 1.
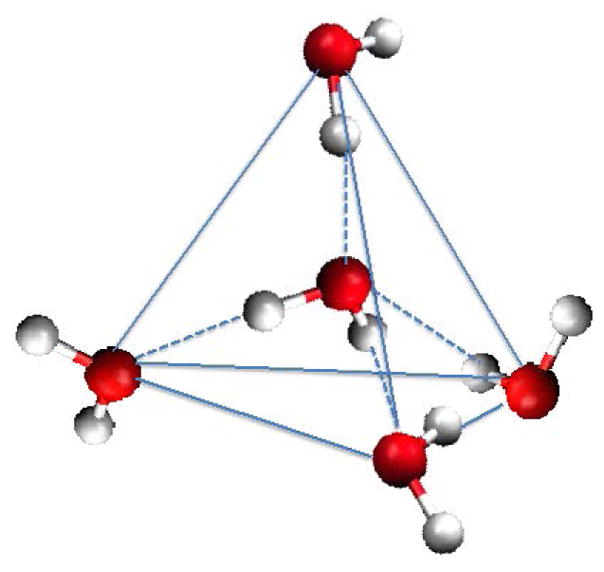
Tetrahedral water configuration
Questions of how protein structure and water dynamics couple, and the extent to which water dynamics are affected by protein structural elements remain unanswered. This work focuses on characterizing regional water dynamics at the surface of the Candida Antarctica lipase B enzyme,17,18,19 which is a 33.273 KDa with 10 α-helices, 9 β-sheets, and multiple loop regions. Pure water has been shown to have relationships between structure and diffusive dynamics, and these relationships were investigated in this work for the solvation layers at the protein surface.
To understand connections between dynamics and thermodynamics, it is helpful to consider the microscopic description of diffusion. A diffusing particle exists in a cage (structure) created by its neighboring molecules. The particle’s diffusive motion is coupled to relaxation of the surrounding structure. Enskog theory describes diffusion in the limit of the hard-sphere model, where particles interact only when in direct contact with one another (via an infinitely repulsive potential when the spheres of radius σ/2 are at a distance of σ from one another).20 Enskog diffusion, DE, is described by
| (1) |
where ρ is density, m is mass, and g(σ) is the value of the radial distribution function at the hard-sphere contact distance, σ, or in the case of generic liquids, the first maximum in g(σ). The Enskog relation sets up the expectation for the “normal” dependence of diffusion on density. Namely, that diffusion decreases as density (and the number of collisions) increases. Rosenfeld,21, 22 and later Dzugotov,23 connected diffusion to excess entropy. The connection arises via the liquid structure, described by g(σ), which can be used to calculate the pair entropy (vide infra).
Rosenfeld scaling is a semi-empirical ‘universal’ explanation to describe the diffusion-entropy scaling relation of dense fluids, including water.24 According to Rosenfeld scaling, the relation between dimensionless diffusion and excess entropy is as follows:
| (2) |
where D* is the dimensionless diffusion constant that is described by
| (3) |
where D is the diffusion coefficient, and ρ and m are density and mass of the solvent. Meanwhile, Sex is the excess entropy, which is defined as the difference between the entropies of the liquid (S) and ideal gas (Sid) under the same density and temperature:
| (4) |
The terms A and α in Eq. 2 are scaling parameters that depend on the nature of molecular interactions and properties. However, Dzugotov demonstrated universal scaling between diffusion and entropy in atomic liquids, showing that Sex can be restricted to S2, the two-body (or pair) entropy term (see more below).23 He also pointed out the utility of the structure-dynamics connection, explaining that diffusion constants “can thus be calculated from the diffraction data in those cases where direct measurement is not possible, or inferred from a structural model”.23
To understand apparent anomalies that arise in Rosenfeld scaling, it is worth commenting on the excess entropy relationships. As with ideal gases, the entropy of a liquid drops as its free volume decreases (density increases). Excess entropy, however, is the difference between the entropy of the liquid and the ideal gas. As density increases in simple liquids, the entropy of the liquid decreases more quickly than the corresponding ideal gas, due to intermolecular interactions that enhance the order of the substance, which can be characterized experimentally by X-ray and neutron scattering data.25 The excess entropy is often found to be described well by the pair entropy, S2 (see Methods for further detail).26,27 In simple liquids, then, the pair and excess entropy decrease as density increases.
The connection between thermodynamics (S2, arising from liquid structure) and transport properties (dynamics) has been demonstrated to hold with the normal relationship of D α 1/ρ for atomic liquids, atomic diffusion in a crystalline lattice, and Lennard-Jones fluids.23 Furthermore, Rosenfeld scaling has been validated for many different systems, including water, simple liquids,28 ionic metals,28–30 model polymeric metals31 and ionic liquids.32, 33 However, this scaling shows different behavior for different systems; for example, there are differences between simple liquids and network forming liquids. It is interesting to note that while most systems such as simple liquids and water show violation of Rosenfeld scaling at low temperatures,34 studies of ionic liquids have indicated the validity of Rosenfeld scaling even at much lower temperatures.34
Rosenfeld scaling is valid for liquid (bulk) water at various states in the density-temperature phase diagram,35, 36 but the relationship between diffusion and density for water is opposite that of a simple liquid, and thus may be considered anomalous. It appears that tetrahedrality in liquid structure reverses the relationship between liquid density and diffusion. Like water, ionic melts are liquids that form tetrahedral configurations at the microscopic level and exhibit water-like anomalous behavior in the density-diffusion relationship at the macroscopic level.37 In tetrahedrally-structured liquids, librational modes give rise to concerted motions in the networked liquid that are enhanced as density increases, allowing more facile diffusion in the cage of nearest neighbors.38 In certain parts of liquid water’s phase space, it is seen that tetrahedral order is highest at low density,29, 39 just as ice (solid water) has lower density and higher tetrahedral order than liquid water. These quantities are reflected in the excess entropy of water: as density increases and tetrahedral order decreases, excess entropy increases. Within the Rosenfeld relationships describing water, as excess entropy increases with density, so does diffusion.
In order to examine water dynamics in the biomolecular hydration layer and connections among water structure, macroscopic thermodynamics, and transport properties, it is crucial to consider the organization of water at the protein interface. Water is a tetrahedral network-forming liquid, exhibiting anisotropic hydrogen-bonding of the water molecules with a local coordination number of nearly 4 (Fig. 1).40 Studies regarding tetrahedral order in the hydration layer of biomolecular solutes are reported for different systems such as small sugar molecules,41 small peptides,42 and a small protein.43
Rosenfeld scaling (ln D* α S2, Eq. 2) was evaluated here for its ability to describe the correlation between water structure and water dynamics in hydration layer water around the enzyme Candida antarctica lipase B. The data here suggests that Rosenfeld scaling, or the entropy-density-diffusion relationship, may shed light on connections among biomolecular structure, hydration shell structure, and hydration dynamics. Scaling relationships between local diffusivities and excess entropy have been suggested previously as a way to evaluate hydration dynamics for a small peptide or protein,42, 44, 45 but heretofore have not been examined for such systems.
2 Methods
2.1 Simulation Details
The starting coordinates for simulations of CALB enzyme were taken from the X-ray crystallographic structure (PDB ID: 1TCA, resolution: 1.55 Å).17 All crystallographic water molecules were kept, as we recently showed this leads to fastest equilibration in aqueous simulations.46 MD simulations were performed using GROMACS (version 4.6.3)47 software package. AMBER03 force field48 was used for the CALB enzyme, and the SPC/E water model49 was used to represent water. The protein force field GROMOS53a650 was also used for the CALB enzyme with SPC/E water, in order to check the dependence of results on protein force field. The results presented in the main text use AMBER03 and SPC/E water, as this was recently shown by King et al. to reproduce experimentally measured protein-water hydrogen bond lifetimes.51 Among the common simple, fixed charge water force fields, SPC/E model best reproduces experimental water reorientation times and diffusion.52
The enzyme was centered in a cubic periodic box with a minimum distance of 1.0 nm between protein and any side of the box, and it was solvated with water. Note that boundary conditions have been observed to affect hydration dynamics in protein simulations. However, Chandramouli et al.53 found that self-diffusion coefficients and solvent radial distribution function, which are key data in this work, are not sensitive to boundary conditions. Na+ and Cl− ions were added, replacing solvent molecules, to neutralize the systems at a 0.15 M salt concentration. One system was prepared by adding one sodium ion (without adding salt), which was sufficient to obtain a neutral charge, in order to compare salt effects on results (with no discernible difference in hydration dynamics). The LINCS bond length constraint algorithm54 was used. For electrostatic interactions, Particle Mesh Ewald summation was used.55 A grid spacing of 0.12 nm combined with an interpolation order of 4 was used for long-range interactions. For van der Waals interactions, a 1.4 nm cut-off was used. Energy minimization was done using steepest descent algorithm.56 Position restraints were used on heavy atoms while annealing, where the system was gradually heated from 50 K to 300 K throughout a 200 ps time period. Systems were equilibrated in the NPT ensemble for 20 ns at 300 K using V-rescale thermostat57 and at 1 bar using Berendsen barostat58 for conditions similar to in vitro catalysis.19 Finally, the production runs were done in NVT ensembles at 300 K using Nosé-Hoover thermostat for a canonical ensemble.59, 60 The Nosé-Hoover thermostat provides weak thermal coupling with the bath. In analysis of water dynamics in an NVE ensemble versus NVT ensemble with Nosé-Hoover thermostat, Basconi and Shirts found the thermostat had negligible influence on water transport properties.61
Results were obtained from sets of 50 ns and 20 ns production runs. Seven trajectories (totaling 260 ns) were generated for the system with AMBER03 force field at 300 K, using different randomly assigned initial velocities. For the comparison system with GROMOS53a6 force field, three 50 ns trajectories were generated using the same protocol. In order to assess that outcome of the results does not depend on the specific choice of water model, one 50 ns trajectory with AMBER03 force field and TIP4P water model was generated using the same protocol. For statistical sampling, analyses of hydration dynamics (detailed below) were block-averaged with 10 ns time blocks acquired from multiple trajectories. Uncertainties are reported at the 95% confidence level, using the student t-test.62 When calculating density and entropy using the radial distribution function, the standard deviation was calculated, as the radial distribution function is already an average quantity.
2.2 Analysis
Previous work has recognized that water molecules near a concave protein surface reside for a much longer time than near a convex protein surface.13 In order to consider topology when evaluating the question of how protein structure and water dynamics relate, a qualitative scale ranging from 1 to 5 was used to describe the surface curvature: 1 for concave, 2 for concave to flat (intermediate character), 3 for flat, 4 for convex to flat (intermediate character), and 5 for convex surface regions. This scale was assigned to each surface-exposed secondary structure and connector of CALB enzyme, and is illustrated in Fig. 2.
Fig. 2.
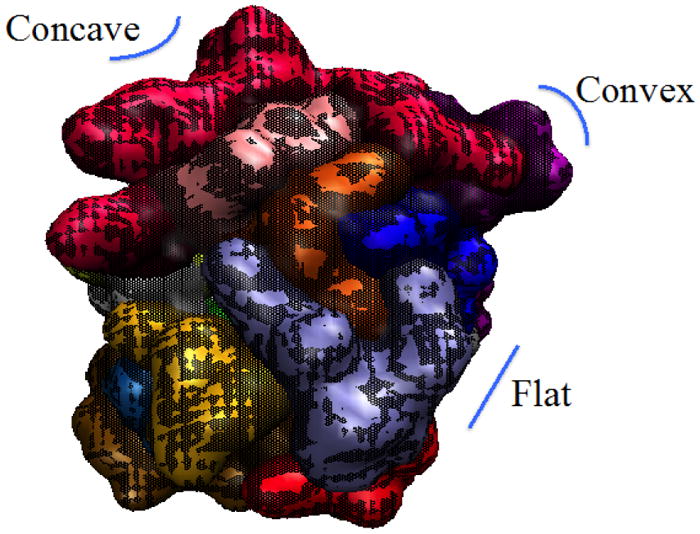
Illustration of different surface curvature regions of CALB: concave (1 on surface curvature scale), flat (3 on scale), and convex (5 on scale).
2.3 Water Dynamics
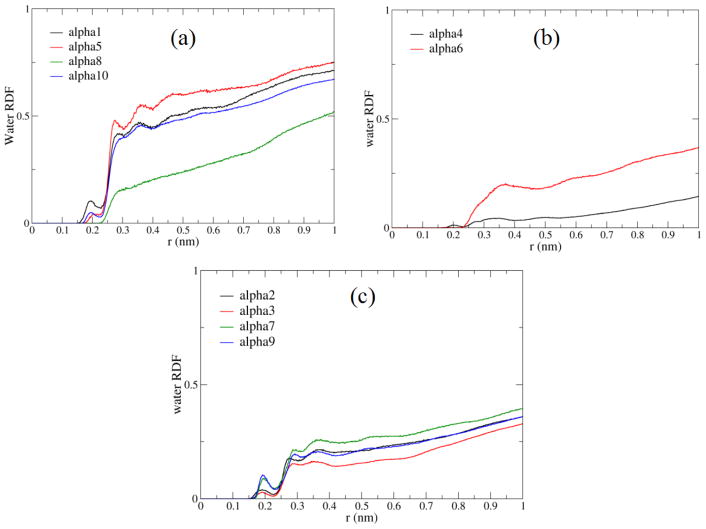
CALB is known to sample three conformations that depend on the distance, d, between the α5 and α10 helix.18 Depending on this distance, the conformations can be characterized as open (d > 1.90 nm), closed (d < 1.52 nm), or crystallographic (1.90 nm ≥ d ≥ 1.52 nm). Hydration dynamics were analyzed separately among the conformations, to check for dependence on protein conformation, as shown in supplementary information (Table S1). The water dynamics within the hydration shell around individual secondary structures (ten α helices and nine β strands), and connectors between secondary structures, were analyzed. This results in a mapping of (HBLTs), and solvation layer residence times. Diffusion and reorientation times were found for water within the first solvation layer. In order to define the first solvent shell, the radial distribution functions (RDFs) of water oxygens around side chain atoms were calculated around each α-helix (note that AMBER03 is an all-atom force field with explicit hydrogens), as shown in Figure 3. It was found that for all regions but helices α4, α6, and α8, the first hydration shell is contained within 3 Å. In these cases, we found height of the first solvation shell peak and the hydration dynamics by region.
Fig. 3.
Radial distribution functions [RDF, or g(r)] of water oxygens around side chain atoms calculated around each (a) exterior α-helix (b) interior α-helix (c) α-helix having both interior and exterior regions.
Different measures of hydration dynamics that can be spectroscopically assessed through site-specific measurements were calculated: regional hydration layer reorientational and translational dynamics, protein-water hydrogen bond lifetimes integration of the RDF out to 3 Å to provide equivalent measures of solvent density. For α4, α6, and α8 helices, the first hydration shell is contained within 4 Å. Solvent radial distribution functions were also calculated for water molecules around the Cα atoms of the protein backbone63 (see Fig. S1 of Supplemental Information), but in general, solvation shells were less well defined, due to variations in side chain lengths.
GROMACS software was used to obtain the dipole reorientational autocorrelation function, C2(t). At time t, C2 is given by,
| (5) |
where P2 is the second Legendre polynomial and e(t) is the dipole orientational vector at time t.64 The reorientation time τ2 was extracted as the time where C2(t)= 1/e. Reorientation times were also calculated for the water O-H vectors (for comparison to published simulations data), and are provided in Table S2. It was seen here that reorientation times are similar across both water vectors(dipole vs. O-H vectors).
GROMACS software was used to calculate diffusion coefficients of water molecules in the hydration layer, from mean-square displacements (MSD) using the Einstein relationship,
| (6) |
where <r2> is mean square displacement, a is the dimensionality in the diffusion process, and D is self-diffusion coefficient. Diffusion coefficients were calculated for 200 ps time blocks by least square fitting of a straight line from t= 20 ps to 60 ps, which corresponds to time within the hydration layer (vide infra) and an interval over which <r2> is consistently linear.
GROMACS software was also used to obtain hydrogen bond auto-correlation functions,65 which were analyzed graphically to obtain hydrogen bond lifetimes.66 The autocorrelation functions were fit with both biexponential and triexpoential fits, and the tables are presented in Table S3 of Supplemental Information. In order to give a characteristic timescale of each solvation environment by region, the hydrogen bond correlation and water reorientation times presented in Table 1 are the 1/e times (as suggested for hydration dynamics by King et al.51).
Table 1.
Hydration dynamics around each α-helix. Exterior regions are denoted as Ext. Interior regions are denoted as Int. Segments having both interior and exterior regions are denoted as Int-Ext.
| α1 (Ext) | α2 (Int-Ext) | α3 (Int-Ext) | α4 (Int) | α5 (Ext) | α6 (Int) | α7 (Int-Ext) | α8 (Ext) | α9 (Int-Ext) | α10 (Ext) | |
|---|---|---|---|---|---|---|---|---|---|---|
| Hydrogen bond lifetime (ps) | 22.8 ± 0.4 | 55.3 ± 4.5 | 60.9 ± 11.4 | 454 ± 84 | 23.8 ± 1.7 | 453 ± 95 | 25.3 ± 1.2 | 25.1 ± 0.5 | 37.5 ± 2.7 | 40.1 ± 2.1 |
| Residence time (ps) | 43.5 ± 0.6 | 50.4 ± 1.5 | 51.0 ± 1.2 | 76.5 ± 3.8 | 42.4 ± 0.6 | 63.2 ± 1.4 | 46.7 ± 1.6 | 41.6 ± .7 | 51.2 ± 1.1 | 44.3 ± 0.3 |
| Diffusion coefficient (1e-5 cm2/s) | 1.60 ± 0.03 | 1.14 ± 0.06 | 1.02 ± 0.04 | 0.17 ± 0.08 | 1.49 ± 0.08 | 0.77 ± 0.06 | 1.28 ± 0.06 | 1.31 ± 0.06 | 1.01 ± 0.02 | 1.46 ± 0.01 |
| Reorientation time (ps) | 1.96 ± 0.03 | 3.42 ± 0.09 | 4.05 ± 0.15 | 4.98 ± 0.15 | 2.67 ± 0.10 | 4.80 ± 0.14 | 2.65 ± 0.12 | 2.92 ± 0.12 | 3.38 ± 0.21 | 2.45 ± 0.05 |
A Fortran code was developed to calculate hydration shell water residence times. The residence time describes how long a water molecule resides in the protein hydration layer before leaving. For this analysis, the hydration layer was considered to be the first and second hydration shells (within 5 Å of protein) in order to compare with published simulations67 and spectroscopic data.10, 68 A survival probability time correlation function, Cres(t), was calculated, in which a water residing in the layer is assigned a value of 1 at time t (h(t)=1), and a value of 0 when it leaves the hydration layer (h(t) = 0), giving:
| (7) |
where the brackets denote averaging over all hydration layer water molecules across multiple time blocks. The residence time is fit to the time when Cres(t) = 1/e. Residence times were also calculated by histogramming the time for water to leave the hydration layer. Histogram and correlation time values were found to be statistically equivalent, and values presented herein are from the histogram averages and uncertainties, from 10 ns block averaging, reported at the 95% confidence level using the student t-test.
2.4 Water Structure (Local Density, Entropy and Tetrahedral Order)
The area under the peak of the radial distribution function can define coordination number or number of nearest neighbor atoms.69 Therefore, the local density of water around separate secondary structures and connectors was calculated by integrating the area under the peak of the radial distribution function corresponding to the first hydration layer (i.e 3 Å) water oxygens around side chain atoms of each exterior secondary structure and loop region, except for the α4, α6 and α8 helices due to noise from the low number of water molecules around them.
There is not a tractable, direct approach for entropy calculation of water in hydration layers.44, 70, 71 One way of calculating the entropy of bulk water is through its structural order, which can be obtained by calculating the n-particle correlation function. The excess entropy can be written as a summation of n-particle entropy terms,
| (8) |
This expression for excess entropy has been used to predict water dynamic properties in work by Chakravarty and coworkers.35 However, the calculation of n-particle correlation function for n>2, in order to obtain three body or higher contributions to the excess entropy, is almost impossible for complex systems. Therefore, only the contribution for n=2 (pair entropy S2) is calculated here. It has been shown that for many atomic and molecular systems, the pair entropy contribution to the excess entropy is convenient and dominant.38, 72–75 Giaquinta and coworkers have shown the similarity between calculated pair entropy of TIP4P water model and experimental excess entropy.76 Furthermore the pair entropy has been used by Nayar and Chakravarty to replace the excess entropy in building relationships between structure, entropy and transport properties in water and water-like liquids.72 Using S2, their results are consistent with the Rosenfeld scaling model’s description of the relationship between entropy and diffusion.
In order to evaluate the validity of the Rosenfeld scaling model for dynamics of water in the protein hydration layer of CALB, the pair entropy S2 was calculated for different regions of the solvation shell. The regional values of S2 were then used to evaluate connections between hydration layer water structure and transport properties of water. For a system consisting of a total number of N particles, the pair entropy is given by,
| (9) |
where g(2)(r) is the radial distribution function. Here the radial distribution functions of water oxygen around side chains of each secondary structure and connector were used and integrated out to the first hydration shell boundary, r1.
Since tetrahedrality in the water network is related to its entropy77 and density,39, 77 the tetrahedrality of hydration layer water was examined as well. GROMACS software was used to calculate a tetrahedral order parameter, which was developed by Chau and Hardwick.78 This parameter contains an angular part (Sg) and a distance part (Sk), which range from 0 to 1. For a perfect tetrahedron, Sg and Sk are 0. As the organization deviates from tetrahedrality, the values of Sg and Sk increase and reach a maximum of 1. Tetrahedrality values are reported herein as 1-Sk, so that tetrahedrality increases from 0 (no order) to 1 (perfect tetrahedron).
3 Results
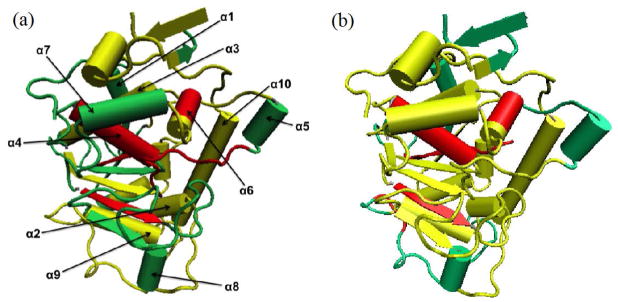
The hydration dynamics around each secondary structure and connector were analyzed using water-protein hydrogen bond lifetimes, hydration layer residence times, diffusion coefficients, and reorientation times around each α-helix. A color-coded map of CALB-water hydrogen bond lifetimes (HBLTs) for α-helices, β-sheets and connector regions is shown in Figure 4(a). Regions with fast protein-water HBLTs (< 30 ps) are in green, intermediate speeds in yellow (30–75 ps), and slow dynamics (> 75 ps) in red. Another color-coded map of water diffusion coefficients around individual α-helices, β-sheets and connector regions is shown in Figure 4(b). Regions with fast diffusion (> 1.5 × 10⁻⁵ cm2/s) are in green, intermediate speeds in yellow (1.0–1.5 × 10⁻⁵ cm2/s), and slow dynamics (> 1.0 × 10⁻⁵ cm2/s) in red. Initially, the regional hydration dynamics within the 4 conformational stages of the enzyme (open, closed, crystal-like, and transitioning) were analyzed separately, as there was no way to know a priori whether hydration dynamics depend on conformation. It was found that only water dynamics around the α5 helix have statistically-significant differences between conformations (Table S1). Thus, the interfacial water dynamics and the color-coded maps presented in Figure 4 come from combined trajectories sampling multiple conformations. It was found that the maps of hydrogen bond lifetimes generated from Amber03 (Fig. 4(a)) and GROMOS 53a6 (Fig. S2) protein force fields (both with SPC/E water) are qualitatively the same.
Fig. 4.
(a) Protein-water hydrogen bond lifetimes (HBLTs) mapped to CALB structure, color-coded according to dynamics (Green <30 ps HBLT, yellow 30–75 ps, red >75 ps HBLT). (b) Protein hydration shell water diffusion coefficients mapped to CALB structure (Green > 1.5 × 10⁻⁵ cm2/s, yellow 1.0–1.5 × 10⁻⁵ cm2/s, red < 1.0 × × 10−5 cm2/s water diffusion coefficients).
It may be expected that regions having slow protein-water hydrogen bond dynamics also exhibit slow dynamics by other measures. Water diffusion, residence times, and reorientation times were calculated, and tabulated in Table 1. It can be seen that regions with fast dynamics by one measure (residence times) generally exhibit fast dynamics by other measures (i.e. translation, reorientational dynamics). The highest correlation between the different measures of dynamics for both exterior and interior protein alpha helices was found between hydration layer water residence times and water diffusion, with an R2 value of 0.91. This is shown in Figure 5. Water diffusion and solvation layer residence time are two different ways of characterizing the translational dynamics, so their high degree of correlation is understandable.
Fig. 5.
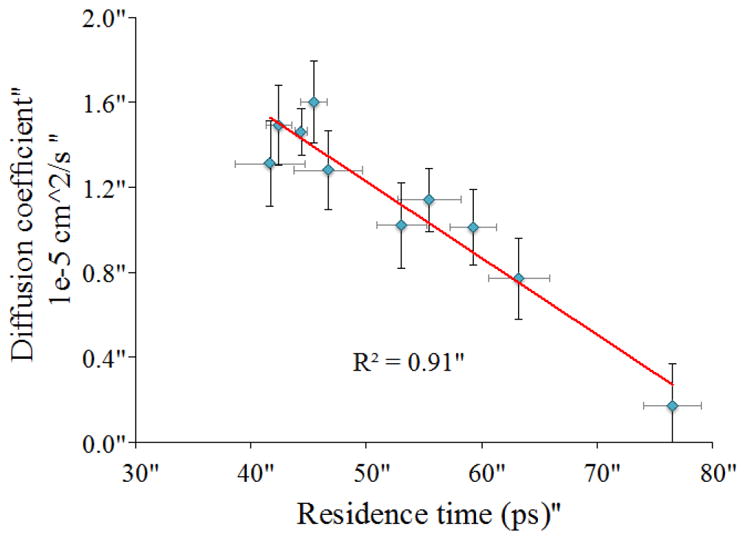
Correlation between hydration layer water residence times and water diffusion for solvation layers surrounding all α-helices.
Hydrogen bond lifetimes, however, are uncorrelated with other measures of hydration dynamics. It is important to keep in mind that these protein-water HBLTs report on only a subset of water molecules within the solvation layer, while the entire first solvation shell is considered for diffusion.
3.1 Protein structure and water structure
In order to examine the influence of protein structure on water dynamics, different characteristics of the protein regions were evaluated. The relationship between regional surface curvature and local water density was analyzed, as shown in Figure 6. Local water density of the first hydration shell was obtained from the integral of the radial distribution function (Fig. 3) out to the edge of the first hydration layer around each region (r=3 Å for all but α4, α6, α8). It can be seen that there is a general trend between water density and surface curvature (R2=0.82). The lower water density around concave surfaces must have contributions from excluded volume, where the surrounding protein surface eliminates some of the space available to hydration layer water molecules.
Fig. 6.
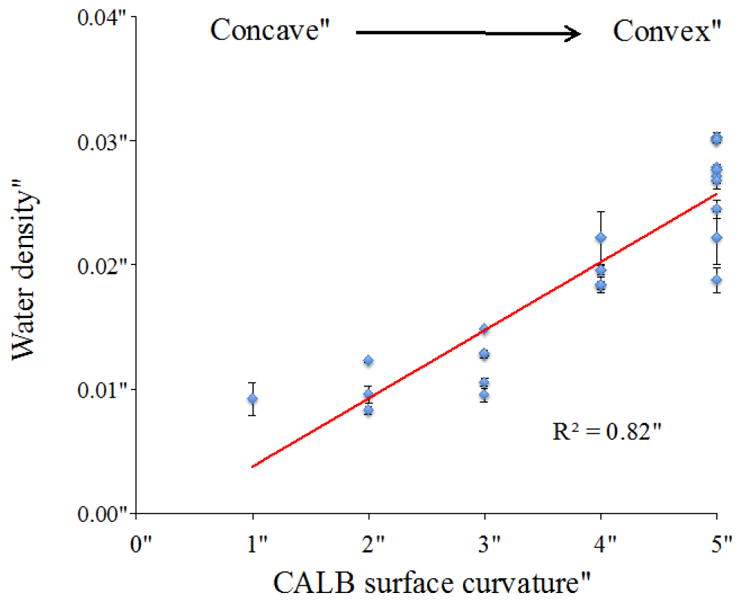
Relationship between surface curvatures of each region and the local water density (from RDF peak: integration of first solvation shell) around that region. Surface curvature scale: 1 for concave, 2 for concave to flat, 3 for flat, 4 for convex to flat, and 5 for convex surface regions.
Clearly, there is a strong influence of convex vs. concave topologies, as has been reported previously.13, 79 We sought to find out whether other properties of the CALB surface systematically influence solvation shell structure. The hydrophobicity of each region was evaluated from the percent hydrophobic solvent-accessible surface area. Local hydration layer density is plotted versus regional protein hydrophobicity in Figure 7. In CALB, there is a trend of density decreasing as hydrophobicity increases, with a correlation coefficient of R2= 0.63.
Fig. 7.
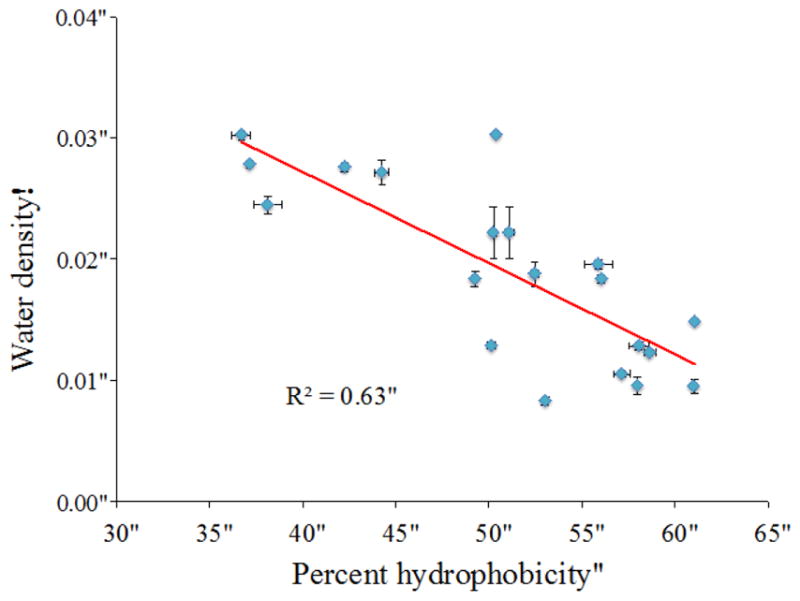
The percent hydrophobicity of each region vs. water density (from RDF peak: integration of first solvation shell) around corresponding region.
From Figures 6 and 7, it can be seen that both enzyme surface curvature and hydrophobicity are correlated with water density surrounding different regions. Furthermore, a plot of hydrophobicity vs. curvature scale (Fig. S3) for all solvent-exposed regions indicates that these two features are virtually uncorrelated (R2= 0.53). One would generally expect both hydrophobic residues and concave topologies on the interior of the protein, giving rise to a correlation. However, these results show that solvent-exposed surfaces (primarily at the exterior) of CALB exhibit considerable heterogeneity in both topology and hydrophobicity, which are generally uncorrelated. In order to figure out which effect is dominant, multi regression analysis was carried out to obtain the following model, which includes effects of both surface curvature and hydrophobicity:
This model has an R2 value of 0.88, higher than the correlation with any single parameter (Figs. 6 and 7). Table 2 shows the model parameters. According to Table 2, it can be seen that surface curvature has a P-value of less than 0.0001, whereas percent hydrophobicity has a P-value of 0.042. It is known that when a P-value is less than 0.05, there is a significant association between the response variable and the term. Therefore, multi regression analysis indicates that both surface curvature and percent hydrophobicity have significant effects on water density around regions of CALB.
Table 2.
Model parameters
| Source | Value | Standard error | t | P > |t| | Lower bound (95%) | Upper bound (95%) |
|---|---|---|---|---|---|---|
| Intercept | 0.0151 | 0.009 | 1.701 | 0.107 | −0.004 | 0.034 |
| Curvature | 0.0045 | 0.001 | 5.448 | < 0.0001 | 0.003 | 0.006 |
| % hydrophobicity | −0.0003 | 0.000 | −2.197 | 0.042 | −0.001 | 0.000 |
In order to determine the size of the effect from each independent variable (curvature and percent hydrophobicity) on the dependent variable (water density), the standard coefficients were determined for a multi-variable equation. Table 3 shows standard coefficients for the model, where it is seen that surface curvature has more effect on regional water density (with a standard coefficient of 0.704) than hydrophobicity (with a standard coefficient of 0.284). Thus, protein structure and hydration layer water structure are correlated.
Table 3.
Standard coefficients
| Source | Value | Standard error | t | Pr > |t| | Lower bound (95%) | Upper bound (95%) |
|---|---|---|---|---|---|---|
| Curvature | 0.704 | 0.129 | 5.448 | < 0.0001 | 0.431 | 0.976 |
| % hydrophobicity | −0.284 | 0.129 | −2.197 | 0.042 | −0.556 | −0.011 |
3.2 Water Structure and Water Dynamics
3.2.1 Water density and water dynamics
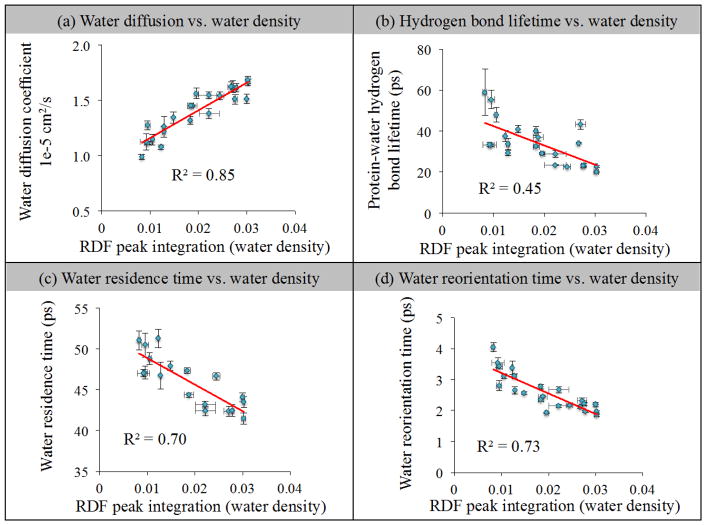
Since a general trend between water density and surface curvature was observed, next the relationship between local water density and hydration dynamics was analyzed for each measure of water dynamics (translational, rotational etc.). Figure 8(a) shows the regional diffusion coefficients of hydration shell water molecules vs. regional water density. As can be seen, there is a linear relationship (R2 = 0.85) between regional diffusion times and regional water density within the hydration shell, with higher water densities exhibiting faster dynamics, as seen in bulk water. Figure 8(b) indicates that the regional protein-water hydrogen bond lifetimes do not exhibit the same relationship with water density that the diffusive dynamics (i.e. residence times, diffusion) of the hydration layer do. The longest hydrogen bond lifetimes (slowest dynamics) are observed in regions of low density, and these longer H-bond lifetimes may arise from primarily entropic (excluded volume) effects explained by the extended jump model of hydrogen bonding.80 Figure 8(c) shows the regional residence times of hydration shell water molecules vs. regional water density. As can be seen, there is a correlation between regional hydration layer residence times and the density of the hydration shell, but the correlation (R2 = 0.70) is not as high as with diffusion. Figure 8(d) indicates that regional reorientation times and local hydration shell density are also correlated, with a correlation coefficient of 0.73. Taken altogether, each measure of water dynamics evaluated versus hydration shell density indicates that faster diffusive dynamics are observed in solvation layers having higher density. This is the same density-diffusion trend that has been observed in bulk liquid water.
Fig. 8.
Relationship of the local water density with each studied water dynamics parameter. (a) Regional diffusion coefficient of first hydration shell water molecules vs. regional water density. (b) Regional protein-water hydrogen bond lifetime vs. regional water density of first hydration shell. (c) Regional residence time of first and second hydration shell water molecules vs. regional water density. (d) Regional water reorientation time of first hydration shell water molecules vs. regional water density.
3.2.2 Water density, tetrahedral order and water dynamics
Next, the relationship between the organization and density of water at the protein interface was analyzed, as shown in Figure 9. In bulk water, it is known that in liquid water having more ice-like properties (lower density, higher tetrahedrality), the dynamics are slower. The converse, of course, is true: water with higher density and lower tetrahedrality (and thus higher excess entropy) has faster dynamics. Here, for water in the protein hydration shell, water density was defined as the mass density within the first hydration shell according to the water oxygen – water oxygen (Ow-Ow) pair correlation function near each secondary structure and connector.39
Fig. 9.
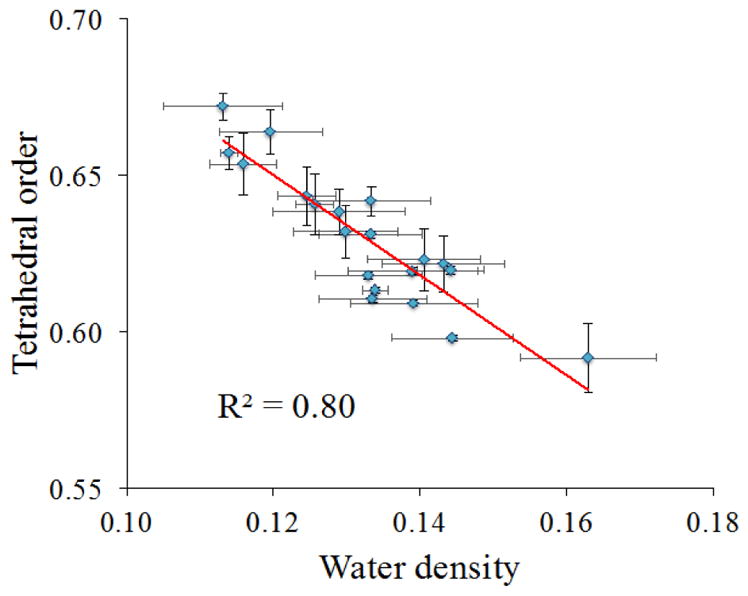
Relationship between the water tetrahedral order and density of water at different regions of the protein interface (from integration of first solvation shell in RDF).
Since the tetrahedral order parameter Sk has a value of 0 for the most perfect tetrahedron and a value of 1 for the most deviated structure, tetrahedrality (Td) was defined as, Td = (1-Sk), where now a value of Td close to 1 indicates organization nearing a perfect tetrahedron. The plot of tetrahedrality vs. water density shows a linear relationship, where tetrahedral order is higher at low densities (which is analogous to ice vs. liquid water).
3.2.3 Water entropy and water dynamics
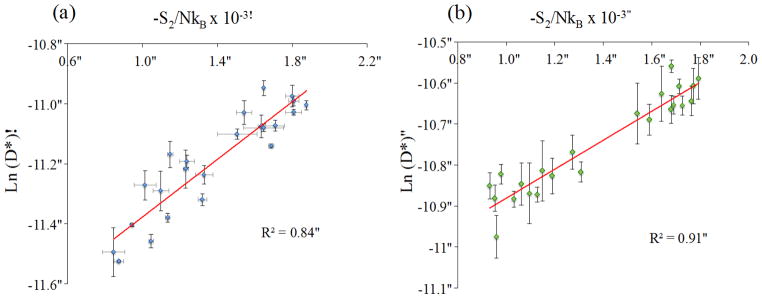
Rosenfeld scaling, which has been previously used to describe structure-entropy-diffusion relationships in liquid water, is used here to explain the relationship between water structure and water dynamics in hydration layer water. As mentioned before, Rosenfeld scaling (equation 2) is a diffusion-entropy scaling relation. Pair entropy was calculated using equation 9. It can be seen in Figure 10, which shows the logarithmic relationship between diffusivity and pair entropy, that Rosenfeld scaling is valid for hydration layer water in this present study. To our knowledge, this is the first study linking Rosenfeld scaling to the dynamics of a biomolecular solvation layer.
Fig. 10.
Logarithmic relationship between hydration shell water diffusivity and pair entropy, as described in the Rosenfeld relationship (Eq. 9), in the presence of (a) SPC/E water model and (b) TIP4P water model.
It is an interesting question to consider how these hydration layer values compare with bulk water. The nominal densities in the hydration layers are significantly lower than bulk water’s, due to excluded volume arising from the protein. However, the structural contribution to S2, contained inside the integral in Eq. 9, is on the same order as bulk water’s. This can be seen in Fig. S5.
4 Discussion
One observation of the CALB hydration shell, which is expected, is the heterogeneity in local solvent dynamics. According to all of the water dynamics parameters studied, a range of dynamics is observed over different surface areas of CALB. For instance, protein-water hydrogen bond lifetimes show a spread of values throughout the different surface areas of CALB, from 454 ps around α4 to 18 ps around the connector region between α3 and β4 (Figures 4(a) and 8(b)). The regional water diffusion times, water residence times and reorientation times also show heterogeneous water dynamics, even when considering only exterior regions. Concomitant with this is differences in water structure around the protein surface regions, as seen in the radial distribution functions in Fig. 3.
As mentioned before, in previous studies it has been found that both chemical heterogeneity and topological heterogeneity of the protein structure can affect water dynamics around the protein. These two factors were investigated to understand the extent to which surface chemistry and curvature affect water dynamics in the hydration shell. It has been shown in numerous studies that hydration dynamics in proteins strongly depend on whether the surface is concave or convex. 13, 79 In CALB, the interior residues (α4 and α6) certainly have slower hydration dynamics, where the protein surface is concave. Clearly, this is a dominating factor for water dynamics within concave (interior) surfaces, which are dramatically retarded relative to exterior surfaces. According to Figure 6, it can be seen that there is also a general trend between water structure and protein structure (surface curvature), with more convex protein regions giving rise to higher water density in the solvation shell, and more concave protein surfaces giving rise to lower water density. Figure 6 shows that water density is correlated with CALB enzyme surface curvature (R2 =0.82), but analysis indicates hydrophobicity also influences water density.
Bagchi and co-workers saw a strong relationship between percent polar solvent-accesible surface area in the protein and solvation layer residence times.81 They observed slowest water dynamics next to more hydrophobic regions. Laage and co-workers measured reorientation times of water around proteins and they found that the slowest hydration later water molecules were most highly oriented next to hydrophobic regions and hydrogen bond donors.14 In CALB, there is a trend of water density increasing when the surface is more hydrophilic, as shown in Figure 7 (R2 = 0.63). In CALB, the surface chemistry alone (hydrophilicity/hydrophobicity) does not determine the density of the water shell, nor the hydration dynamics. The CALB surface was color-coded by amino acid type (hydrophobic, hydrophilic, basic, acidic), and can be seen in SI Figure S4. It may be that the spatial arrangement of amino acid type also has an influence on hydration dynamics, along with the relative quantity of polar/hydrophobic residues. For instance, Berne and co-workers found that “correlated hydrogen bonds” within hydrophobic regions affect protein hydration.82 For interested readers, Table S4 in Supplemental Information provides additional information regarding the properties of each CALB region. Future work may incorporate additional properties of the protein surface for further analysis of how protein structure affects hydration layer structure and dynamics. The multi-regression analysis done in this study focuses on two properties, topology and hydrophobicity, and indicates the best correlation between water density and protein surface characteristics (assessed by P-value) occurs when both curvature and hydrophobicity are taken into consideration, with weights of 0.704 and 0.284 respectively, giving an R2 value of 0.88. Hydration layer density, in turn, is correlated with hydration dynamics (Fig. 8). Rosenfeld scaling (Eq. 2, as shown in Fig. 10) provides a theoretical explanation for this structure-dynamics connection in the hydration layer, which arises from pair entropy.
The correlation between regional surface properties--evaluated regionally across an entire α-helix, loop/connector, or β-sheet—and the dynamics of the region’s hydration layer indicates that this “mesoscopic” characterization can provide physical insight into how the protein surface locally influences the dynamics of water in its solvation shell. The findings also suggest that, in spite of water structure being highly networked, and water dynamics being highly cooperative, local/regional surface effects dominate the extent to which the (local/regional) hydration layer dynamics is slowed by the protein. In prior work by Laage and coworkers, a “microscopic” characterization of water molecules in the direct vicinity of individual amino acids provided insight into the influence of side chain identity on water reorientation times and hydrogen bond dynamics.83 Analysis of “macroscopic”, or global, characterizations of hydration shell dynamics from NMR relaxation experiments by Halle and Davidovic,84 on the other hand, has been used to explain (global) protein hydrodynamics. By assuming that surface reorientation times are proportional to the local viscosity, proteins’ rotational and translational diffusion times in solution were shown to depend on the globally-characterized dynamics of the hydration layer.84
There are different molecular interactions and mechanisms that participate in determining the time scale of dynamics of hydration shell water around the protein. The dipolar character of water and charged or polar groups in the protein create a strong electric field between protein and the hydration shell around it. The macroscopic polarizability can be characterized by the dielectric constant of the hydration layer.85 Heterogeneity of amino acid content in different areas of the protein interface will give rise to heterogeneous dielectric constants in the hydration layer. Reorientational relaxation rates and the degree of orientational polarization will depend on the structure and dynamics of the hydrogen bond network, as well as electrostatics in the local environment. Meanwhile, fluctuations in molecular topology cause fluctuations in local electrostatic forces, which are linked with ultra fast dynamics of hydration shells.86 Fluctuations in intermolecular electric forces result in fluctuations in the OH stretch vibrational frequency, which happens on a femtosecond time scale and is known as spectral diffusion.86 Hydrogen bond dynamics, which include reorientation, consist of breaking and reforming of hydrogen bonding on a picosecond time scale, with direct effects on the residence time of first hydration shell water molecules.14 In this paper we focus on measures of hydration dynamics that can be assessed through site-specific spectroscopic studies, for comparison with experimental data. For example, residence time hydration layer water molecules were found to be on the tens of picoseconds timescale, which is in agreement with spectroscopic data.10, 68 Other characteristics of the solvation layer, such as local dielectric and dipole moment, would be intriguing investigations in future work, as they are likely also related to solvent structure.
When analyzing the relationship between water density and water dynamics (Figure 8(a) – (d)), it was seen that solvation shell reorientation times, diffusion coefficients and hydration layer residence times are correlated with the density of water in the solvation shell, while protein-water hydrogen bond lifetimes are not (although the slowest HBLTs are found in regions of low density). The differences in density-dynamics correlations across different measures of hydration shell dynamics can be explained using enthalpic and entropic contributions. Differences in diffusion are mostly a function of entropy,87, 88 the majority of which can be directly calculated from water structure (RDF, or g(r)). Note that water residence times (dependent on diffusion perpendicular to the protein surface) and diffusion coefficients are highly correlated (Figure 5). Diffusion is known to have a dependence on density, via excess entropy, in bulk liquids. Hydrogen bond dynamics, on the other hand, comprise large-scale angular jumps in bulk solution and surface-exposed regions,64 but diffusive motion in more convex or interior regions.89 The hydrogen bond dynamics, in turn, influence water reorientation times.80 It has been shown in vibrational sum-frequency generation spectroscopy experiments that until a certain temperature, differences in hydrogen bond lifetimes arise primarily from enthalpy.90 Thus, protein-water hydrogen bond lifetimes may be determined by protein structure, more so than water structure.
Another way of analyzing water structure is water organization. Titantah et al. studied the effects of density and order on the rotational dynamics of water. They reported that in bulk water, low local density of water molecules are mainly characterized with high tetrahedral order, whereas less tetrahedral order is characteristic of regions with high local water density.39 Titantah et al. also observed that density and order have opposite effects on water rotational dynamics: water reorientation increases with higher water density and decreasing tetrahedral order, whereas water reorientation slows in regions of lower water density and increased order (i.e. having more ice-like characteristics).79 In Figure 9, which plots water tetrahedral order vs. water density at the protein interface, it can be seen that there is a linear correlation between hydration shell water density and tetrahedral order, where tetrahedral order decreases with increasing local water density. Therefore, plots of tetrahedral order vs. water dynamics, akin to those shown in Figure 8(a)–(d) for density vs. water dynamics, would show higher mobility in hydration layers with lower tetrahedral order. It can be stated that according to this present study, the conclusions by Titantah et al. about order (tetrahedrality)and density effects on the dynamics of bulk liquid water are valid for water in the CALB hydration shell, too.
Overall, it has been found that more convex and hydrophilic protein surfaces lead to a water structure with more density and less tetrahedral order. This can be connected to the iceberg model by Frank and Evans91 and Kauzmann.92 Xu and Berne have shown that in the hydration layer around non-polar groups of a polypeptide, hydrogen bonds among water molecules become stronger in energy. They also suggested that there should be an entropic contribution, too, in addition to this energy effect, since hydrophobic interfaces would increase the order in surrounding water molecules and this will lead to lower entropy.93 Bakker and coworkers observed stronger hydrogen bonds and higher ordering near hydrophobic surfaces via sum-frequency generating spectroscopy,94 echoing results from Raman spectroscopic studies by Ben-Amotz and coworkers that observed higher order in the hydration shells around small alcohols95 (which are not dissimilar to some amino acid side chains) and ab initio MD simulations by Avbelj and co-workers showing strengthened water hydrogen bonds around hydrophobic solutes.96 Pal et al. studied the water near structured hydrophobic surfaces of alkane crystals and they observed that the water density is reduced near hydrophobic interfaces.97 Enhanced ordering at hydrophobic regions is also observed in the data for CALB, where lower density and higher tetrahedral order correlate with protein hydrophobicity and concave topologies, resulting in lower entropy. This in turn scales with the diffusion and other measures of dynamics in the hydration layer.
In summary, the thermodynamics and dynamics of hydration shell water were studied by analyzing the relationship between diffusion and entropy. The fascinating relationship between diffusion coefficients and pair entropy has the capability to shed light on the correlation between the structure and dynamics of a liquid.44 Rosenfeld scaling, which describes the diffusion-entropy scaling relation of dense fluids including water,24 was used in the present study for CALB enzyme hydration shell water (Figure 10). The data here indicates that in addition to its validity for bulk water (and many other liquids), the Rosenfeld scaling relationship is valid for water molecules in local hydration shells, too.
5 Conclusions
Protein structure affects water structure and dynamics through topological and chemical effects. Water density and diffusion increase at more hydrophilic and convex regions of the CALB surface. Multi regression analysis was used to determine that local water structure and dynamics are more highly influenced by topological heterogeneity than by the chemical heterogeneity of the protein structure. Concave and hydrophobic regions induce a hydration layer with lower density, higher tetrahedral order, and slower dynamics: this could be considered to be more ice-like, although most water molecules remain quite mobile.
The Rosenfeld-scaling relationship of entropy-diffusion appears to be valid for hydration layers in this model protein CALB. In this work, pairwise entropy, S2, which is the first term in the excess entropy, shows high correlation with solvent shell diffusion coefficients, indicating this term is dominant in describing relationships between structure-dynamics of hydration layer water around the protein. The ability to tune the dynamics of the solvation layer, which could impact biomolecular dynamics and function,98, 99 might be achieved by engineering the solvation shell structure. The question remains whether biomolecule hydration shells generally exhibit relationships between water structure and dynamics that are described by Rosenfeld scaling and governed by excess entropy relationships.
Supplementary Material
Acknowledgments
Acknowledgement is made to the donors of the American Chemical Society Petroleum Research Fund for support of this research. This material is based upon work supported by the National Science Foundation under Grant No. CHE-1665157. This work is also supported by Wichita State University Department of Chemistry and Fairmount College of Liberal Arts and Sciences; the National Science Foundation under Award no. EPS-0903806 and matching support from the State of Kansas through the Kansas Board of Regents; and the National Institute of General Medical Sciences (P20 GM103418) from the National Institutes of Health. This work also used the Extreme Science and Engineering Discovery Environment (XSEDE)100 through allocation CHE170093. XSEDE is supported by National Science Foundation grant number ACI-1548562.
The content is solely the responsibility of the authors and does not necessarily represent the official views of the National Institute of General Medical Sciences or the National Institutes of Health.
References
- 1.Meister K, Ebbinghaus S, Xu Y, Duman JG, DeVries A, Gruebele M, Leitner DM, Havenith M. Proc Natl Acad Sci U S A. 2013;110:1617–1622. doi: 10.1073/pnas.1214911110. [DOI] [PMC free article] [PubMed] [Google Scholar]
- 2.Dielmann-Gessner J, Grossman M, Conti Nibali V, Born B, Solomonov I, Fields GB, Havenith M, Sagi I. Proc Natl Acad Sci U S A. 2014;111:17857–17862. doi: 10.1073/pnas.1410144111. [DOI] [PMC free article] [PubMed] [Google Scholar]
- 3.Nucci NV, Pometun MS, Wand AJ. Nat Struct Mol Biol. 2011;18:245–249. doi: 10.1038/nsmb.1955. [DOI] [PMC free article] [PubMed] [Google Scholar]
- 4.Mattea C, Qvist J, Halle B. Biophys J. 2008;95:2951–2963. doi: 10.1529/biophysj.108.135194. [DOI] [PMC free article] [PubMed] [Google Scholar]
- 5.Nucci NV, Pometun MS, Wand AJ. J Am Chem Soc. 2011;133:12326–12329. doi: 10.1021/ja202033k. [DOI] [PMC free article] [PubMed] [Google Scholar]
- 6.Armstrong BD, Choi J, Lopez C, Wesener DA, Hubbell W, Cavagnero S, Han S. J Am Chem Soc. 2011;133:5987–5995. doi: 10.1021/ja111515s. [DOI] [PMC free article] [PubMed] [Google Scholar]
- 7.Jha SK, Ji M, Gaffney KJ, Boxer SG. J Phys Chem B. 2012;116:11414–11421. doi: 10.1021/jp305225r. [DOI] [PMC free article] [PubMed] [Google Scholar]
- 8.King JT, Kubarych KJ. J Am Chem Soc. 2012;134:18705–18712. doi: 10.1021/ja307401r. [DOI] [PubMed] [Google Scholar]
- 9.Pal SK, Zewail AH. Chem Rev. 2004;104:2099–2123. doi: 10.1021/cr020689l. [DOI] [PubMed] [Google Scholar]
- 10.Qiu W, Zhang L, Okobiah O, Yang Y, Wang L, Zhong D, Zewail AH. J Phys Chem B. 2006;110:10540–10549. doi: 10.1021/jp055989w. [DOI] [PubMed] [Google Scholar]
- 11.Qiu W, Kao YT, Zhang L, Yang Y, Wang L, Stites WE, Zhong D, Zewail AH. Proc Natl Acad Sci U S A. 2006;103:13979–13984. doi: 10.1073/pnas.0606235103. [DOI] [PMC free article] [PubMed] [Google Scholar]
- 12.Jia M, Yang J, Qin Y, Wang D, Pan H, Wang L, Xu J, Zhong D. J Phys Chem Lett. 2015;6:5100–5105. doi: 10.1021/acs.jpclett.5b02530. [DOI] [PubMed] [Google Scholar]
- 13.Hua L, Huang X, Zhou R, Berne BJ. J Phys Chem B. 2006;110:3704–3711. doi: 10.1021/jp055399y. [DOI] [PubMed] [Google Scholar]
- 14.Sterpone F, Stirnemann G, Laage D. J Am Chem Soc. 2012;134:4116–4119. doi: 10.1021/ja3007897. [DOI] [PubMed] [Google Scholar]
- 15.Walrafen GE. J Chem Phys. 1964;40:3249. [Google Scholar]
- 16.dos Santos VML, Moreira FGB, Longo RL. Chem Phys Lett. 2004;390:157–161. [Google Scholar]
- 17.Uppenberg J, Hansen MT, Patkar S, Jones TA. Structure. 1994;2:293–308. doi: 10.1016/s0969-2126(00)00031-9. [DOI] [PubMed] [Google Scholar]
- 18.Zisis T, Freddolino PL, Turunen P, van Teeseling MC, Rowan AE, Blank KG. Biochemistry. 2015;54:5969–5979. doi: 10.1021/acs.biochem.5b00586. [DOI] [PMC free article] [PubMed] [Google Scholar]
- 19.Anderson EM, Karin M, Kirk O. Biocatal Biotransfor. 1998;16:181–204. [Google Scholar]
- 20.Allen MP, Tildesley DJ. Computer Simulation of Liquids. Clarendon Press; Oxford, UK: 2009. [Google Scholar]
- 21.Rosenfeld Y. Phys Rev A. 1977;15:2545–2549. [Google Scholar]
- 22.Rosenfeld Y. Chem Phys Lett. 1977;48:467–468. [Google Scholar]
- 23.Dzugutov M. Nature. 1996;381:137–139. [Google Scholar]
- 24.Rosenfeld Y. J Phys Condens Mat. 1999;11:5415–5427. [Google Scholar]
- 25.Head-Gordon T, Hura G. Chem Rev. 2002;102:2651–2670. doi: 10.1021/cr0006831. [DOI] [PubMed] [Google Scholar]
- 26.Johnson ME, Head-Gordon T. J Chem Phys. 2009;130:214510. doi: 10.1063/1.3140608. [DOI] [PubMed] [Google Scholar]
- 27.Laird BB, Haymet AD. Phys Rev A. 1992;45:5680–5689. doi: 10.1103/physreva.45.5680. [DOI] [PubMed] [Google Scholar]
- 28.Singh M, Liu H, Kumar SK, Ganguly A, Chakravarty C. J Chem Phys. 2010;132:074503. doi: 10.1063/1.3314288. [DOI] [PubMed] [Google Scholar]
- 29.Sharma R, Chakraborty SN, Chakravarty C. J Chem Phys. 2006;125:204501. doi: 10.1063/1.2390710. [DOI] [PubMed] [Google Scholar]
- 30.Singh M, Agarwal M, Dhabal D, Chakravarty C. J Chem Phys. 2012;137:024508. doi: 10.1063/1.4731705. [DOI] [PubMed] [Google Scholar]
- 31.Goel T, Patra CN, Mukherjee T, Chakravarty C. J Chem Phys. 2008;129:164904. doi: 10.1063/1.2995990. [DOI] [PubMed] [Google Scholar]
- 32.Agarwal M, Ganguly A, Chakravarty C. J Chem Phys B. 2009;113:15284–15292. doi: 10.1021/jp903694b. [DOI] [PubMed] [Google Scholar]
- 33.Agarwal M, Chakravarty C. Physical Review E. 2009;79:030202. doi: 10.1103/PhysRevE.79.030202. [DOI] [PubMed] [Google Scholar]
- 34.Banerjee A, Nandi MK, Bhattacharyya SM. J Chem Sci. 2017:1–8. [Google Scholar]
- 35.Agarwal M, Singh M, Sharma R, Parvez Alam M, Chakravarty C. J Phys Chem B. 2010;114:6995–7001. doi: 10.1021/jp101956u. [DOI] [PubMed] [Google Scholar]
- 36.Fomin YD, Ryzhov V. 2010 arXiv preprint arXiv:1010.4169. [Google Scholar]
- 37.Zhao G, Yan J, Yu Y, Ding M, Zhao X, Wang H. Sci Rep. 2017;7:39952. doi: 10.1038/srep39952. [DOI] [PMC free article] [PubMed] [Google Scholar]
- 38.Chakraborty SN, Chakravarty C. J Chem Phys. 2006;124:014507. doi: 10.1063/1.2140282. [DOI] [PubMed] [Google Scholar]
- 39.Titantah JT, Karttunen M. Soft Matter. 2015;11:7977–7985. doi: 10.1039/c5sm00930h. [DOI] [PubMed] [Google Scholar]
- 40.Angell CA, Bressel RD, Hemmati M, Sare EJ, Tucker JC. Phys Chem Chem Phys. 2000;2:1559–1566. [Google Scholar]
- 41.Lee SL, Debenedetti PG, Errington JR. J Chem Phys. 2005;122:204511. doi: 10.1063/1.1917745. [DOI] [PubMed] [Google Scholar]
- 42.Agarwal M, Kushwaha HR, Chakravarty C. J Phys Chem B. 2010;114:651–659. doi: 10.1021/jp909090u. [DOI] [PubMed] [Google Scholar]
- 43.Melchionna S, Briganti G, Londei P, Cammarano P. Phys Rev Lett. 2004;92:158101. doi: 10.1103/PhysRevLett.92.158101. [DOI] [PubMed] [Google Scholar]
- 44.Bagchi B. Cambr Molec Sci. 2013:1–356. doi: 10.1017/Cbo9781139583947. [DOI] [Google Scholar]
- 45.Pattni V, Vasilevskaya T, Thiel W, Heyden M. J Phys Chem B. 2017;121:7431–7442. doi: 10.1021/acs.jpcb.7b03966. [DOI] [PMC free article] [PubMed] [Google Scholar]
- 46.Dahanayake JN, Gautam DN, Verma R, Mitchell-Koch KR. Mol Simul. 2016;42:1001–1013. doi: 10.1080/08927022.2016.1139108. [DOI] [PMC free article] [PubMed] [Google Scholar]
- 47.Hess B, Kutzner C, van der Spoel D, Lindahl E. J Chem Theory Comput. 2008;4:435–447. doi: 10.1021/ct700301q. [DOI] [PubMed] [Google Scholar]
- 48.Duan Y, Wu C, Chowdhury S, Lee MC, Xiong G, Zhang W, Yang R, Cieplak P, Luo R, Lee T, Caldwell J, Wang J, Kollman P. J Comput Chem. 2003;24:1999–2012. doi: 10.1002/jcc.10349. [DOI] [PubMed] [Google Scholar]
- 49.Berendsen HJC, Grigera JR, Straatsma TP. J Phys Chem-Us. 1987;91:6269–6271. [Google Scholar]
- 50.Oostenbrink C, Villa A, Mark AE, van Gunsteren WF. J Comput Chem. 2004;25:1656–1676. doi: 10.1002/jcc.20090. [DOI] [PubMed] [Google Scholar]
- 51.King JT, Arthur EJ, Brooks CL, 3rd, Kubarych KJ. J Am Chem Soc. 2014;136:188–194. doi: 10.1021/ja407858c. [DOI] [PMC free article] [PubMed] [Google Scholar]
- 52.Xu HF, Stern HA, Berne BJ. J Phys Chem B. 2002;106:2054–2060. [Google Scholar]
- 53.Chandramouli B, Zazza C, Mancini G, Brancato G. J Phys Chem A. 2015;119:5465–5475. doi: 10.1021/jp511824t. [DOI] [PubMed] [Google Scholar]
- 54.Hess B, Bekker H, Berendsen HJC, Fraaije JGEM. J Comput Chem. 1997;18:1463–1472. [Google Scholar]
- 55.Darden T, York D, Pedersen L. J Chem Phys. 1993;98:10089–10092. [Google Scholar]
- 56.Arfken G. Mathematical Methods for Physicists. 3. Academic Press; Orlando, Florida, USA: 1985. [Google Scholar]
- 57.Bussi G, Donadio D, Parrinello M. J Chem Phys. 2007:126. doi: 10.1063/1.2408420. [DOI] [PubMed] [Google Scholar]
- 58.Berendsen HJC, Postma JPM, Vangunsteren WF, Dinola A, Haak JR. J Chem Phys. 1984;81:3684–3690. [Google Scholar]
- 59.Nose S. J Chem Phys. 1984;81:511–519. [Google Scholar]
- 60.Hoover WG. Phys Rev A Gen Phys. 1985;31:1695–1697. doi: 10.1103/physreva.31.1695. [DOI] [PubMed] [Google Scholar]
- 61.Basconi JE, Shirts MR. J Chem Theory Comput. 2013;9:2887–2899. doi: 10.1021/ct400109a. [DOI] [PubMed] [Google Scholar]
- 62.Shoemarker DP, Garland CW, Nibler JW. Experiments in Physical Chemistry. WCB McGraw-Hill; Boston, MA, USA: 1996. [Google Scholar]
- 63.Bandyopadhyay S, Chakraborty S, Balasubramanian S, Pal S, Bagchi B. J Phys Chem B. 2004;108:12608–12616. [Google Scholar]
- 64.Laage D, Stirnemann G, Sterpone F, Rey R, Hynes JT. Annu Rev Phys Chem. 2011;62:395–416. doi: 10.1146/annurev.physchem.012809.103503. [DOI] [PubMed] [Google Scholar]
- 65.van der Spoel D, van Maaren PJ, Larsson P, Timneanu N. J Phys Chem B. 2006;110:4393–4398. doi: 10.1021/jp0572535. [DOI] [PubMed] [Google Scholar]
- 66.Luzar A, Chandler D. Nature. 1996;379:55–57. [Google Scholar]
- 67.Huang D, Rossini E, Steiner S, Caflisch A. ChemMedChem. 2014;9:573–579. doi: 10.1002/cmdc.201300156. [DOI] [PubMed] [Google Scholar]
- 68.Denisov VP, Halle B. Faraday Discuss. 1996:227–244. doi: 10.1039/fd9960300227. [DOI] [PubMed] [Google Scholar]
- 69.Waseda Y. The structure of non-crystalline materials: liquids and amorphous solids. McGraw-Hill; New York, USA: 1980. [Google Scholar]
- 70.Huber RG, Fuchs JE, von Grafenstein S, Laner M, Wallnoefer HG, Abdelkader N, Kroemer RT, Liedl KR. J Phys Chem B. 2013;117:6466–6472. doi: 10.1021/jp311418q. [DOI] [PMC free article] [PubMed] [Google Scholar]
- 71.Debnath A, Mukherjee B, Ayappa KG, Maiti PK, Lin ST. J Chem Phys. 2010;133:174704. doi: 10.1063/1.3494115. [DOI] [PubMed] [Google Scholar]
- 72.Nayar D, Chakravarty C. Phys Chem Chem Phys. 2013;15:14162–14177. doi: 10.1039/c3cp51114f. [DOI] [PubMed] [Google Scholar]
- 73.Errington JR, Truskett TM, Mittal J. J Chem Phys. 2006;125:244502. doi: 10.1063/1.2409932. [DOI] [PubMed] [Google Scholar]
- 74.Baranyai A, Evans DJ. Phys Rev A. 1989;40:3817. doi: 10.1103/physreva.40.3817. [DOI] [PubMed] [Google Scholar]
- 75.Baranyai A, Evans DJ. Phys Rev A. 1990;42:849. doi: 10.1103/physreva.42.849. [DOI] [PubMed] [Google Scholar]
- 76.Giuffre E, Prestipino S, Saija F, Saitta AM, Giaquinta PV. J Chem Theory Comput. 2010;6:625–636. doi: 10.1021/ct900627q. [DOI] [PubMed] [Google Scholar]
- 77.Hujo W, Jabes BS, Rana VK, Chakravarty C, Molinero V. J Stat Phys. 2011;145:293–312. [Google Scholar]
- 78.Chau PL, Hardwick AJ. Mol Phys. 1998;93:511–518. [Google Scholar]
- 79.Halle B. Philos Trans R Soc Lond B Biol Sci. 2004;359:1207–1223. doi: 10.1098/rstb.2004.1499. discussion 1223–1204, 1323–1208. [DOI] [PMC free article] [PubMed] [Google Scholar]
- 80.Laage D, Hynes JT. Science. 2006;311:832–835. doi: 10.1126/science.1122154. [DOI] [PubMed] [Google Scholar]
- 81.Roy S, Bagchi B. J Phys Chem B. 2012;116:2958–2968. doi: 10.1021/jp209437j. [DOI] [PubMed] [Google Scholar]
- 82.Young T, Abel R, Kim B, Berne BJ, Friesner RA. Proc Natl Acad Sci U S A. 2007;104:808–813. doi: 10.1073/pnas.0610202104. [DOI] [PMC free article] [PubMed] [Google Scholar]
- 83.Sterpone F, Stirnemann G, Hynes JT, Laage D. J Phys Chem B. 2010;114:2083–2089. doi: 10.1021/jp9119793. [DOI] [PubMed] [Google Scholar]
- 84.Halle B, Davidovic M. Proc Natl Acad Sci U S A. 2003;100:12135–12140. doi: 10.1073/pnas.2033320100. [DOI] [PMC free article] [PubMed] [Google Scholar]
- 85.Pethig R. Annu Rev Phys Chem. 1992;43:177–205. doi: 10.1146/annurev.pc.43.100192.001141. [DOI] [PubMed] [Google Scholar]
- 86.Laage D, Elsaesser T, Hynes JT. Struct Dyn. 2017;4:044018. doi: 10.1063/1.4981019. [DOI] [PMC free article] [PubMed] [Google Scholar]
- 87.Adam G, Gibbs JH. J Chem Phys. 1965;43:139–146. doi: 10.1063/1.1697082. [DOI] [PubMed] [Google Scholar]
- 88.Rosenfeld Y. J Phys Condens Matter. 1999;11:5415. [Google Scholar]
- 89.Brotzakis ZF, Groot CC, Brandeburgo WH, Bakker HJ, Bolhuis PG. J Phys Chem B. 2016;120:4756–4766. doi: 10.1021/acs.jpcb.6b02592. [DOI] [PubMed] [Google Scholar]
- 90.Petersen C, Tielrooij KJ, Bakker HJ. J Chem Phys. 2009;130:214511. doi: 10.1063/1.3142861. [DOI] [PubMed] [Google Scholar]
- 91.Frank HS, Evans MW. J Chem Phys. 1945;13:507–532. [Google Scholar]
- 92.Kauzmann W. Adv Protein Chem. 1959;14:1–63. doi: 10.1016/s0065-3233(08)60608-7. [DOI] [PubMed] [Google Scholar]
- 93.Xu H, Berne B. J Phys Chem B. 2001;105:11929–11932. [Google Scholar]
- 94.Strazdaite S, Versluis J, Backus EH, Bakker HJ. J Chem Phys. 2014;140:054711. doi: 10.1063/1.4863558. [DOI] [PubMed] [Google Scholar]
- 95.Davis JG, Gierszal KP, Wang P, Ben-Amotz D. Nature. 2012;491:582–585. doi: 10.1038/nature11570. [DOI] [PubMed] [Google Scholar]
- 96.Grdadolnik J, Merzel F, Avbelj F. Proc Natl Acad Sci U S A. 2017;114:322–327. doi: 10.1073/pnas.1612480114. [DOI] [PMC free article] [PubMed] [Google Scholar]
- 97.Pal S, Roccatano D, Weiss H, Keller H, Muller-Plathe F. Chemphyschem. 2005;6:1641–1649. doi: 10.1002/cphc.200500074. [DOI] [PubMed] [Google Scholar]
- 98.Schiro G, Fichou Y, Gallat FX, Wood K, Gabel F, Moulin M, Hartlein M, Heyden M, Colletier JP, Orecchini A, Paciaroni A, Wuttke J, Tobias DJ, Weik M. Nat Commun. 2015;6:6490. doi: 10.1038/ncomms7490. [DOI] [PMC free article] [PubMed] [Google Scholar]
- 99.Beece D, Eisenstein L, Frauenfelder H, Good D, Marden MC, Reinisch L, Reynolds AH, Sorensen LB, Yue KT. Biochemistry. 1980;19:5147–5157. doi: 10.1021/bi00564a001. [DOI] [PubMed] [Google Scholar]
- 100.Towns J, Cockerill T, Dahan M, Foster I, Gaither K, Grimshaw A, Hazlewood V, Lathrop S, Lifka D, Peterson GD, Roskies R, Scott JR, Wilkins-Diehr N. Comput Sci Eng. 2014;16:62–74. [Google Scholar]
Associated Data
This section collects any data citations, data availability statements, or supplementary materials included in this article.


