

Abstract
Heme-binding proteins constitute a large family of catalytic and transport proteins. Their widespread presence as globins and as essential oxygen and electron transporters, along with their diverse enzymatic functions, have made them targets for protein design. Most previously reported designs involved the use of α-helical scaffolds, and natural peptides also exhibit a strong preference for these scaffolds. However, the reason for this preference is not well-understood, in part because alternative protein designs, such as those with β-sheets or hairpins, are challenging to perform. Here, we report the computational design and experimental validation of a water-soluble heme-binding peptide, Pincer-1, composed of predominantly β-scaffold secondary structures. Such heme-binding proteins are rarely observed in nature, and by designing such a scaffold, we simultaneously increase the known fold space of heme-binding proteins and expand the limits of computational design methods. For a β-scaffold, two tryptophan zipper β-hairpins sandwiching a heme molecule were linked through an N-terminal cysteine disulfide bond. β-Hairpin orientations and residue selection were performed computationally. Heme binding was confirmed through absorbance experiments and surface plasmon resonance experiments (KD = 730 ± 160 nm). CD and NMR experiments validated the β-hairpin topology of the designed peptide. Our results indicate that a helical scaffold is not essential for heme binding and reveal the first designed water-soluble, heme-binding β-hairpin peptide. This peptide could help expand the search for and design space to cytoplasmic heme-binding proteins.
Keywords: protein design, computational biology, heme, protein folding, protein motif, structural biology
Introduction
Protein folding and protein design are closely related problems and can be viewed as two sides of the same coin. Protein folding addresses which three-dimensional structure a given protein sequence adopts, whereas protein design addresses the inverse problem of determining sequences that adopt a given three-dimensional structure. Taking protein design further, one can ask whether a novel fold not observed in nature can be designed and which sequences would constitute such a fold. Recent reports indicate that the number of unique folds found in the PDB has plateaued and that the discovery of new folds is becoming rarer (http://www.rcsb.org/pdb/statistics/content GrowthChart.do?content=fold-cath).2 With this in mind, the design of a new fold becomes highly challenging. Another, perhaps more important, challenge is to engineer a desired functionality into a given protein fold. Computational methods have proven to be adept in the exploration of these challenges. The field of structural bioinformatics caters to the delineation of sequence–fold–function relationships, which can ultimately help guide protein design. Available methods combine physical chemistry models describing amino acid interactions and protein structure with advanced computational algorithms for a more systematic exploration of the design space. Successful applications of these methods include, but are not limited to, designing new binding sites into existing proteins to generate new functionality (2, 3), engineering new allosteric sites to introduce new regulatory strategies (4, 5), metabolic engineering to biosynthesize small molecules of interest (6, 7), probing protein–protein interactions and manipulating them to alter cellular functions (8, 9), and the design of new therapeutics (10, 11).
Because of the diverse functions of the heme molecule as an electron transporter, oxygen carrier, and enzyme cofactor, heme-binding proteins have consistently attracted the attention of protein designers. Initial design attempts focused on α-helical heme-binding proteins (12–14), in part because of the relative simplicity of designing self-assembling helical bundles. Heme-binding sites were designed inside the interhelical hydrophobic grooves. Examples of such designs are helichrome (15, 16), globin-1 (17), Cy-AA-EK (18), peptides IIa/IId (19) and α2 (20), and transmembrane helical designs (21–23). Later design attempts focused on creating functional heme-binding helical bundles. Oxidoreductases (24, 25), peroxidases (26, 27), electron transport proteins (28), oxygen transport proteins (29), and photosensitive (24) heme-binding proteins have been reported. Design techniques have matured to such an extent that it is now possible to generate entire libraries of heme-binding helical proteins (30–32).
All of the designs described involved the use of α-helical scaffolds. Interestingly, natural peptides also reflect a strong preference for helical scaffolds. 77% of natural heme-binding proteins are helical (14). Even proteins adopting mostly β topologies prefer interacting with heme through helical or disordered stretches (33, 34). These observations raise interesting questions about the structure–function relationships of heme-binding proteins. For example, how important is the presence of a helical scaffold for heme binding?
The design of all-β heme–binding proteins can therefore shed light on this question. However, designing β-sheets and β-hairpins has proven to be more complex than the design of α-helical proteins. Unlike α helices (35–37), simple parametric rules for designing all-β proteins do not yet exist. β-Sheets tend to aggregate in aqueous solutions and have a propensity to form insoluble amyloid plaques (38, 39). Further, β sheets have no obvious concavities into which hydrophobic heme-binding sites can be designed. Without these concavities, the placement of hydrophobic residues becomes nontrivial. D'Souza et al. (40) solved the residue placement problem by designing β-hairpins composed almost entirely of hydrophobic residues. As a consequence, the designs were insoluble and had to be characterized in dodecyl phosphocholine micelles.
In this work, we report the design of Pincer-1, a water-soluble heme-binding peptide adopting a β pincer motif (Fig. 1A), created using structural bioinformatics approaches. Pincer-1 was synthesized, and its solubility, heme-binding properties, and structural properties were experimentally verified.
Figure 1.

The topology and modeled structure of Pincer-1. A, topologically, we envisioned a disulfide-bridged double β-hairpin interacting with a single heme molecule. The porphyrin ring of the heme molecule is colored red. The heme iron atom is colored pink. Histidine residues are colored green. Designed coordinate bonds are colored blue. Designed disulfide bonds are colored yellow. N and C termini are labeled. Putative loops and disordered regions are colored gray. Putative β strands are colored teal. Note that both N-terminal residues were designed to be disulfide-linked cysteine residues. B, all-atom model of Pincer-1, created using the Trpzip2 scaffold. His-9 on either chain is colored blue. Trp-4 on either chain is colored green. These Trp residues were designed using PocketAnneal.
Results
Scarcity of heme-binding all-β motifs in natural proteins
Heme binding proteins adopt predominantly α-helical folds. An analysis of 472 nonredundant (70% sequence similarity cutoff; Text S1 and Fig. S2A) heme-binding proteins obtained from the PDB confirmed this. DSSP (Define Secondary Structure of Proteins) (41) was used for secondary structure assignment, and the largest secondary structure component was used to classify proteins into helix, sheet, or loop folds. 80.3% of heme-binding proteins adopted mostly α-helical folds, confirming previous observations (14). 11.4% adopted β-sheet folds, and 8.3% were predominantly structured as loops. Heme forms coordinate bonds with one or two residues within protein binding sites. We enumerated the heme-coordinating residues' secondary structures for proteins adopting predominantly β-sheet folds. Here, 49.3%, 26.0%, and 24.7% of these residues belonged to loop, α-helix, and β-motifs, respectively. Therefore, even for proteins composed predominantly of β-sheets, the heme-binding motif displays a strong preference for loop or α-helical secondary structures. Even when β-motifs are present, they are nearly always paired with opposing α-helical or loop motifs to form the heme-binding site. These observations indicate that natural heme-binding proteins display a strong preference against β-sheets both at the fold level and at the binding site level.
Topological design of a heme-binding β pincer motif
Topologically, we envisioned a heme molecule interacting with two β-hairpins (Fig. 1A) linked through an N-terminal Cys–Cys covalent bond. We envisioned a structure where the heme molecule would be clasped between, and stabilized by, the tryptophan-rich hydrophobic faces of two tryptophan zipper (42) hairpins. The heme iron atom would be coordinated between two strategically placed histidine residues on two β-hairpins, resembling the clasping edges of a pincer. A motivating factor for selecting such a topology is that it represents the smallest possible all-β heme-binding motif. All larger motifs (such as those involving β-sheets) are therefore reducible to the minimal pincer motif, making it an excellent model for the study of heme–β interactions.
Computational methods for the generation of an all-atom design
Computational methods were used to optimize β-hairpin placement and binding site mutations, determine peptide-heme steric hindrances, and explore all peptide/ligand rotameric conformations. A workflow listing all of the steps involved in the computational design is provided in Fig. 2. A full description, elaborating each step mentioned in the workflow, is provided in Text S1. Three computational tools were critical for the design of Pincer-1: PocketAnneal, Autodock (43), and Foldit (44). PocketAnneal in particular is a new algorithm and is discussed below.
Figure 2.
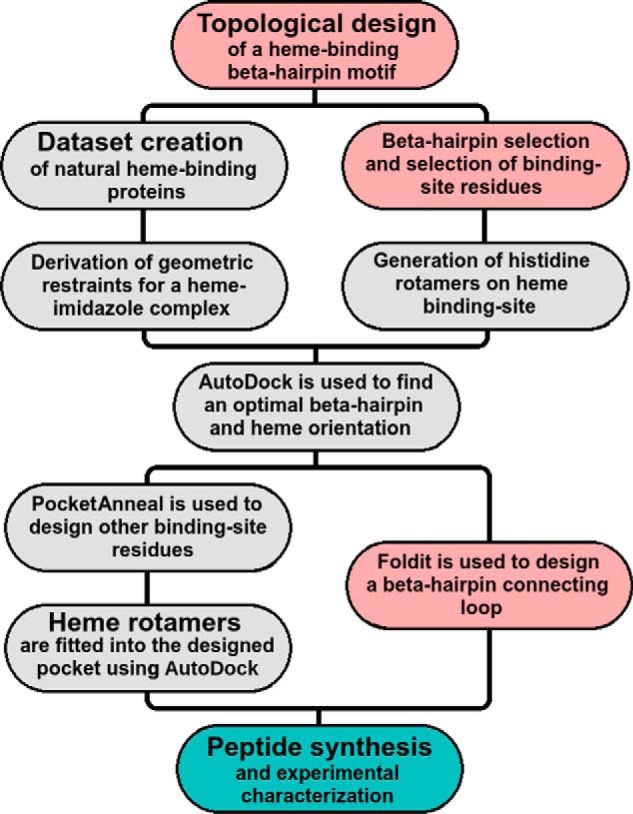
A workflow depicting all computational steps required for the design of Pincer-1. Completely automated steps are highlighted in gray. Steps requiring manual intervention are colored pink. Experimental steps are colored teal and are described further in the following sections.
PocketAnneal is capable of mutating and optimizing binding site residues (pocket) on a protein scaffold to accommodate any given ligand. The PocketAnneal algorithm contains two components: the energy function (AutoDock 4.1 compute_autodockscore) and the optimization function (simulated annealing). The simulated annealing protocol searches through residue and conformational space to find a good approximation of the AutoDock energetic global minimum. Search space involves sampling all 20 natural amino acids and all side-chain rotamers for a given residue using the Dunbracks rotamer library (45). Initially, all binding site residues are mutated to alanine. At each iteration, a randomly selected residue is mutated, and the binding site is scored and probabilistically accepted depending on the current temperature of the simulation. Multiple simulations are required to find the closest approximation of the global minimum.
A full description of PocketAnneal, along with its validation on the CSAR (Community Structure–Activity Resource) dataset (46) and against existing methods (47, 48), is provided in Text S1. PocketAnneal scripts are provided in Protocol S1) and uploaded to the GitHub repository (https://github.com/1337deepesh/Pocketanneal).2 The final all-atom computational model for Pincer-1 is illustrated in Fig. 1B, and PDB coordinates are provided in Text S2. This structure contained the sequence CGSWTWENGKHTWK and was chosen for peptide synthesis and experimental characterization.
Synthesis and preliminary characterization of Pincer-1
Peptide synthesis of Pincer-1 (sequence CGSWTWENGKHTWK, C1-C1 S-S linkage between the two subunits of the dimer) and disulfide linking were performed by GenScript, Inc. The disulfide bond was oxidized by incubating the monomer in 20% DMSO/water for 24 h at ambient temperature. 100 mg of Pincer-1 (dimer) possessed a percentage purity of 96.7%. HPLC chromatograms for both the Pincer-1 monomer (before disulfide linking, Fig. S1A) and the Pincer-1 dimer (after disulfide linking and further purification, Fig. S1C) confirm the purity. Molecular weights (and therefore dimerization state) were confirmed by electrospray ionization MS. The Pincer-1 monomer (Fig. S1B) possessed a molecular mass of 1719.90 Da, whereas the Pincer-1 dimer (Fig. S1D) possessed a molecular mass of 3437.75 Da.
Absorbance experiments reveal characteristic Soret peaks upon Pincer-1–heme interaction
Pincer-1 displayed a red coloration immediately upon addition of heme (Fig. 3A, P1-HEM), strongly indicative of peptide–heme interaction. This interaction was confirmed upon collecting absorption spectra. The Pincer-1 heme complex displayed a characteristic major Soret absorbance peak at 416 nm (γ peak) along with two minor Soret peaks at 536 nm (β peak) and 564 nm (α peak). Such Soret peaks are characteristically found in hemoglobin and the cytochrome family of proteins. Hemoglobin for example, displays γ, β, and α Soret peaks at 412 nm, 541 nm, and 576 nm, respectively (49), whereas cytochrome c1 displays γ, β, and α Soret peaks at 418 nm, 524 nm, and 554 nm, respectively (50).
Figure 3.

Absorbance experiments performed to determine Pincer-1 heme binding. A, quartz cuvettes of 1-cm path length displaying 1 ml of their respective contents: P1, 1000 μg/ml of Pincer-1; HEM, 95 μg/ml of hematin; P1-HEM, 1000 μg/ml of Pincer-1 with 95 μg/ml of hematin; BSA-HEM, 1000 μg/ml of BSA (fraction V) with 95 μg/ml of hematin. All solutions were created in 100 mm Tris buffer (pH 8). B, absorbance spectra collected for P1, HEM, P1-HEM, and BSA-HEM.
In contrast, Pincer-1 itself forms a colorless solution (Fig. 3A, P1), whereas solubilized heme forms a greyish solution (Fig. 3A, HEM). The absorption spectrum for solubilized Pincer-1 displayed no significant peaks in the visible spectrum (Fig. 3B). The absorption spectrum for solubilized heme displayed a broad absorbance peak in the 350- to 400-nm wavelength region (Fig. 3B). In both cases, no characteristic Soret peaks were detected, confirming Soret peak formation only upon Pincer-1–heme interaction.
As a further control, the interaction of BSA (fraction V, PDB code 4OR0) and heme was studied using absorbance scanning experiments. Bovine serum albumin is a 582-residue protein that contains 17 histidine residues. Visually, the BSA–heme solution appeared identical in color to heme alone (Fig. 3A, BSA-HEM). The absorption spectrum revealed that the BSA–heme solution displayed a near-identical spectrum compared with heme alone (Fig. 3B). The broad absorbance peak in the 350- to 400-nm wavelength region remained unaltered, indicating that heme remains in the uncoordinated form.
Pincer-1 displays characteristic Soret peak shifts upon dithionite reduction
Pincer-1 displays Soret peak shifts upon reduction of its heme ligand. Reduction was performed using an excess of sodium dithionite. The time difference between collecting the nonreduced and reduced spectra was 412 s. The major γ Soret peak was red-shifted from 416 nm to 422 nm (Fig. 4A). The β Soret peak displayed a blue shift from 536 nm to 528 nm. The α Soret peak displayed a blue shift from 564 nm to 560 nm. Further, the β and α Soret peaks appeared better resolved (Fig. 4B). The changes in Soret peak wavelength, intensity, and resolution observed upon dithionite reduction are characteristic of iron in a hexacoordinated form (51).
Figure 4.

Dithionite reduction of the Pincer-1–heme complex. A, nonreduced and reduced spectra over a wavelength range of 300–650 nm, showing characteristic shifts in the γ, β, and α Soret peaks. B, nonreduced and reduced spectra over a wavelength range of 500–600 nm, highlighting characteristic shifts in the β and α Soret peaks.
Pincer-1–heme interacts in a 1:1 stoichiometric ratio
A standard method to determine the stoichiometry of the Pincer-1 heme-binding binding event was employed. A 1:1 stoichiometric ratio was defined as occurring when 1 mol of hematin completely binds to 1 mol of Pincer-1 (consisting of two disulfide-linked β-hairpins). Pincer-1 and heme were chosen as the analyte and titrant, respectively. After every increase in heme concentration, an absorption spectrum was collected (Fig. 5A). 19 such absorption spectra were collected, and the difference in absorbance values at 416 nm and 374 nm was used to create a Job plot (Fig. 5B). From the Job plot, the stoichiometric ratio of heme–Pincer-1 binding was determined to be 0.98:1, which is in very good agreement with the 1:1 stoichiometric ratio expected for our design.
Figure 5.

Heme titration assay to determine the stoichiometric ratio of heme Pincer-1 binding. A, absorbance scans in the 300–650 nm range during the titration of Pincer-1 with heme. B, Job plot used to determine the stoichiometric ratio of heme Pincer-1 binding, based on absorbance data.
Surface plasmon resonance experiments confirm and quantify heme binding
The absorption spectra collected revealed that Pincer-1 binds to heme as designed. Furthermore, Pincer-1 showed all expected spectral characteristics for a peptide that coordinately interacts with a heme ligand. The absorption spectra also confirmed that Pincer-1 interacts with heme with a stoichiometric ratio of 1:1, which was expected based on our design parameters. Further characterization of the Pincer-1–heme interaction was performed using surface plasmon resonance (SPR)3 experiments using a standard amine coupling method. An initial concentration of 1 nm Pincer-1 was immobilized and used as the ligand, whereas heme was used as the analyte. Heme concentrations ranging from 500 nm to 10 μm were used against immobilized Pincer-1.
Surface plasmon resonance experiments were performed in duplicate. A global fit with the 1:1 Langmuir interaction model revealed that heme binds to Pincer-1 with an equilibrium dissociation constant (KD) of 730 ± 160 nm (Fig. 6). For a de novo designed binding interaction, this KD value is very encouraging, occupying the same KD range as natural antigen–antibody interactions.
Figure 6.
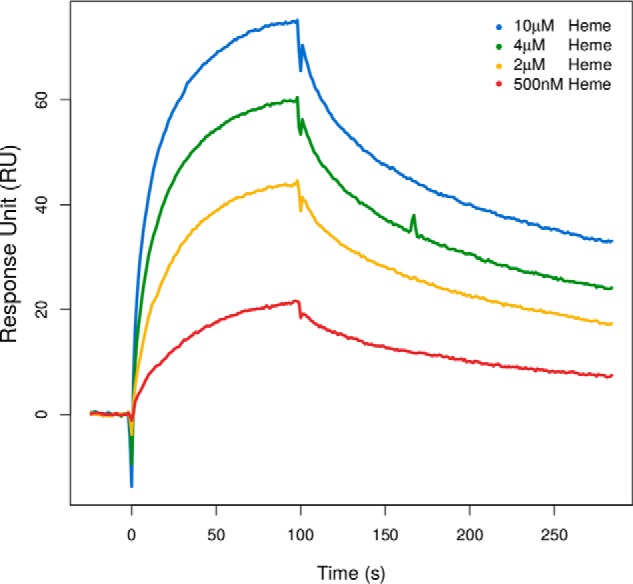
SPR sensograms showing the interactions between immobilized Pincer-1 peptide and heme in a CM5 chip using a Biacore 3000 optical biosensor. Multiple concentrations of heme (500 nm to 10 μm) were allowed to interact with the immobilized peptide. The interaction study was carried out at a flow rate of 30 μl/min and with an association for 100 s and dissociation for 200 s. The curves in different colors represent different analyte (heme) concentrations.
CD experiments reveal conformational changes upon heme binding
CD experiments were performed to understand the secondary and tertiary structural characteristics of Pincer-1 in the heme-bound and unbound forms. CD experiments in the 190- to 350-nm wavelength range indicated that Pincer-1 maintains its β-hairpin structure (Fig. 7A). Unliganded Pincer-1 displays two intense bands: a single minimum at 212 nm and a single maximum at 230 nm. These results are very similar to those reported for Trpzip2 (42), the parent structure of Pincer-1, confirming that the β-hairpin structure remained intact. A minimum at a wavelength of ∼215 nm is characteristic of β secondary structures, indicating that Pincer-1 retains its designed topology. A maximum at a wavelength of 230 nm is characteristic of aromatic chromophore interaction, indicating that the tryptophan residues are well-ordered (52).
Figure 7.

Circular dichroism experiments on Pincer-1 and heme. A, full UV spectra of unbound Pincer-1, displaying a minimum at 212 nm and a maximum at 230 nm, characteristic of the Trpzip2 template. B, far-UV CD spectra of Pincer-1 titrated against varying concentrations of heme. C, near-UV CD spectra of Pincer-1 titrated against varying concentrations of heme.
Pincer-1 was titrated against increasing concentrations of heme (Fig. 7B). In this case, a concentration of 100% heme indicates a 1:1 stoichiometric ratio. Heme was found to stabilize the β-hairpin structure at a maximal concentration of 80% heme, with the structure showing only slight destabilization at a concentration of 100% heme. Counterintuitively, increasing concentrations of heme caused a decrease in the intensity of the 230-nm band, indicating the destabilization of tryptophan–tryptophan π–π interactions. Near-UV CD experiments in the 250- to 350-nm wavelength range (Fig. 7C) were performed to better understand this phenomenon. Upon increasing the concentration of heme, an intense band developed with a minimum at 290 nm, indicating that tryptophan residues adopt an alternate conformation upon heme binding. The exact nature of this new conformation, or the tryptophan residues that participate, cannot be established by CD experiments alone. However, tryptophan residues 4, 6, and 13 could undergo side-chain rotameric shifts to accommodate the heme molecule without greatly affecting the backbone dihedrals.
1D NMR experiments confirm that Pincer-1 forms a paramagnetic complex with heme
1D NMR experiments were performed on Pincer-1 (20 μm) titrated against increasing concentrations of heme (0 → 20 μm, Fig. 8A). Initially, Pincer-1 (20 μm with 0 μm heme) displayed an NMR spectrum with well-resolved shifts in the amide region (7–9 parts per million), strongly indicative of a well-folded peptide.
Figure 8.

1D 1H NMR experiments on Pincer-1 and BSA titrated against heme. A, 20 μm Pincer-1 titrated against 0 → 20 μm heme. The shifts and broadening of peaks are characteristic of paramagnetic interference from the heme molecule in close proximity to the Pincer-1 peptide, confirming binding. B, 20 μm Pincer-1 titrated against 0 → 20 μm heme (amide region only). Shifts and broadening of peaks are more clearly visible in the superposed spectra. C, 20 μm BSA titrated against 0 → 20 μm heme (negative control). No paramagnetic interference is observed for the BSA spectrum at all concentrations of heme. This confirms that BSA does not interact with heme. D, 20 μm BSA titrated against 0 → 20 μm heme (amide region only). Shifts and broadening of peaks are clearly absent in the superposed spectra. Note that the intense peaks at 5 parts per million in A and C are caused by an unsuppressed water signal. Note that for clarity, only 0, 5, and 10 μm heme spectral superpositions are shown in B and D.
With increasing concentrations of heme, the NMR spectra displayed shifts and broadening of peaks (Fig. 8, A and B). These effects are characteristic of interference from a paramagnetic center (heme molecule) in close spatial proximity to the nuclei of the Pincer-1 peptide. The observation of paramagnetic interference therefore acts as further confirmation of Pincer-1–heme binding.
As a negative control, we titrated BSA (20 μm) against increasing concentrations of heme (0 → 20 μm). BSA was spectroscopically confirmed to possess no heme-binding ability (Fig. 3). Consequently, the BSA 1D NMR spectra appeared unaltered at the concentrations of heme used (Fig. 8, C and D), confirming that paramagnetic interference in Fig. 8A was caused by Pincer-1–heme interaction and not solely a result of the presence of a paramagnetic compound in solution.
2D NMR experiments confirm the β-hairpin structure of the Pincer-1 monomer
Based on chemical shifts obtained from the 2D 1H-1H NOESY and 2D 1H-1H TOCSY spectra (Fig. 9A), an NMR structural model was solved using CS-Rosetta (53). We were able to assign 64 1H chemical shifts for backbone and side-chain hydrogen atoms for 13 of the 14 Pincer-1 residues, excluding N-terminal cysteine (chemical shifts in the .star format are provided in Text S3). 40,000 CS-Rosetta models for Pincer-1 were then generated from these chemical shifts. The 10 lowest-scoring models appeared to converge, adopting a β-hairpin turn as designed (Fig. 9B, PDB coordinates in Text S4), with a mean backbone root mean square deviation of 0.6 ± 0.3 Å. A Ramachandran plot for the 10 lowest-scoring models confirmed that 100% of residues fell within the allowed regions (Fig. S3).
Figure 9.

2D NMR experiments performed on Pincer-1. A, 2D 1H-1H NOESY/TOCSY (purple/teal) spectra of Pincer-1 collected in water (90% H2O, 10% D2O). The H → Hα chemical shifts for each residue are labeled in red (residue number, residue one-letter code). A red tracer sequentially connects nTOCSYi(Ha) → nNOESYi→i + 1(Ha) → nTOCSYi + 1(Ha). B, backbone atoms for the 10 lowest-scoring CS-Rosetta monomeric Pincer-1 structures are displayed as lines and superposed. A secondary structure annotation for the sequence is provided below.
The best-ranking CS-Rosetta structure was found to be topologically identical to our computationally designed monomeric Pincer-1 model. The β-hairpin structure remained conserved, with residues 4–7, 8–9, and 10–13 adopting β, turn, and β conformations, respectively. Residues 1–3 and 14 at the N-terminal and C-terminal extremes adopted disordered conformations. The CS-Rosetta structure was superposed with the monomeric Pincer-1 model, resulting in a backbone root mean square deviation of 0.9 Å, confirming that both structures are highly similar. Taken together, NMR experiments on unbound Pincer-1 and CD experiments on the Pincer-1–heme complex (Fig. 7B) suggest that the Pincer-1–heme complex adopts the designed β-hairpin topology.
Discussion
The field of protein design is rapidly advancing and is now capable of creating proteins ranging from minimal motifs (54) to full proteins (55, 56) and megadalton-scale ordered nanostructures (57). Heme-binding protein designs have also displayed increasing complexity, with functional designs such as peroxidases (26, 27), oxireductases (24, 25), proteins involved in oxygen (29) and electron transport (28), and photosensitive (24) proteins being reported in the literature. Despite such functional diversity, the designed heme-binding proteins have so far been mostly restricted to α-helical topologies. Similar trends are mirrored in natural heme-binding peptides, with the vast majority adopting α-helical topologies (14). Even when proteins adopting β topologies bind to heme, they do so predominantly through helices or disordered regions (33, 34).
These observations led us to pose the following question: how important is the presence of a helical scaffold for heme binding? The design and experimental characterization of Pincer-1, a computationally designed, water-soluble, heme-binding peptide adopting a β-hairpin topology, helps answer this question. Absorbance experiments, stoichiometric data, SPR experiments, CD, and NMR experiments all confirmed and characterized the structure and heme-binding ability of Pincer-1. It is interesting to note that Pincer-1 possessed a KD of 730 ± 160 nm, well in the range of natural antigen–antibody interactions.
The successful design of Pincer-1 demonstrates that a helical scaffold is not essential for heme binding. This leads to interesting questions about the reason for the scarcity of heme-binding β-topologies in structural databases. One reason could be insufficient sampling. Large numbers of such proteins may exist in nature but have not yet been characterized. Alternatively, we would like to consider two evolutionary explanations for this deficit. First, like the genetic code (58), this α-helical preference could be a frozen accident, with the first heme-binding proteins evolving on α-helical scaffolds. Secondly, heme-binding β-topologies may be harder to create through the unguided, trial and error nature of evolution. α-Helical topologies may be favored simply because they develop heme-binding abilities after fewer mutations. Further work would be required to examine the validity of these hypotheses.
In conclusion, our design of a water-soluble, all-β, heme-binding motif pushes the limits of our understanding of the characteristics of heme-binding proteins. It should be noted that, although Pincer-1 was neither designed nor observed to be a functional protein, future work involving the incorporation of Pincer-1 into functional designs remains a possibility. Such designs could serve as electron transporters, oxygen transporters, or catalytic sites for future enzyme design applications.
Experimental procedures
Determination of absorption spectra for Pincer-1
To confirm heme binding to Pincer-1 and determine the stoichiometric ratio of binding, the absorption spectra of the Pincer-1–heme complex was collected in the wavelength range of 300–650 nm. All absorption spectra were collected on the Tecan Infinite200Pro multimode microplate reader using polystyrene 96-well plates. Stock solutions of Pincer-1 and heme were prepared as follows.
50 μg of Pincer-1 was solubilized in 100 μl of Tris buffer (100 mm Tris set to pH 8), forming a final concentration of 0.5 μg/μl (solution A). The source of heme chosen was porcine hematin (Sigma, H3281-1G), which is the hydroxide of heme. 3.57 mg of hematin was solubilized in 200 μl of Tris/KOH buffer (100 mm Tris (pH 8) and 50 mm KOH). Potassium hydroxide was added to solubilize hematin. This solution served as a 20× hematin stock (solution B). A 20-fold dilution of solution B was created in Tris buffer (100 mm Tris (pH 6.8)) to be used as the titrant (solution C). 100 μl of solution C was prepared, containing 0.89 μg/μl of hematin.
To determine whether Pincer-1 displays specific Soret peaks (50) (α band, 554–600 nm; β band, 524–532 nm; γ band, 412–439 nm; values for cytochrome a, b, c, and c1) upon heme-binding, we performed four simple absorbance experiments. First, 1 ml of a 1 mg/ml Pincer-1 solution was tested for background peptide absorbance. Second, 1 ml of a 95 μg/ml hematin solution was tested for background heme absorbance. Third, 1 ml of a 1 mg/ml Pincer-1 solution containing 95 μg/ml of hematin was tested for characteristic Soret peaks upon heme binding. Fourth, 1 ml of a 1 mg/ml BSA (fraction V) solution containing 95 μg/ml hematin was tested for Soret peak specificity. In all cases, Tris buffer was used (100 mm Tris (pH 6.8)), and 50 μl of each solution was loaded onto a polystyrene 96-well plate and used for absorption spectrum collection (300–650 nm).
To determine whether heme-bound Pincer-1 displays characteristic Soret peak shifts upon dithionite reduction, excess sodium dithionite was added to a mixture of 100 μl of solution A and 5.31 μl of solution C. Absorbance readings were taken as soon as possible.
Determination of the Pincer-1–heme stoichiometric ratio of binding
To determine the stoichiometric ratio of binding, we performed a titration experiment. Here, a 1:1 stoichiometric ratio is defined as the event where 1 mol (651.94 g) of hematin completely binds to 1 mol (3437.76 g) of Pincer-1 (disulfide-bonded). Pincer-1 was chosen as the analyte. Heme was chosen as the titrant. Titration was performed by adding 1 μl of solution C at a time to 100 μl of solution A and recording the absorbance values at a range of 300–650 nm. At each step, the absorbance value at 416 nm (Soret peak maximum) was subtracted from the absorbance value at 374 nm (nonspecific absorbance caused by excess unbound hematin). All such absorbance values were plotted against the immediate stoichiometric ratio to obtain a Job plot. Based on the dilutions used, a 1:1 stoichiometric ratio was expected to be achieved upon addition of 10.62 μl of solution C to 100 μl of solution A.
Determination of the Pincer-1 heme equilibrium dissociation constant using SPR
A standard amine coupling method was used to study the interaction between the designed peptide and heme. The peptide was immobilized on a research-grade CM5 sensor chip (GE Healthcare) precoated with carboxymethyl. Experiments were carried out using a Biacore 3000 optical biosensor (Biacore, Uppsala, Sweden) at 25 °C. The carboxymethyl dextran surface on the CM5 sensor chip was first charged by adding N-hydroxysuccinimide (NHS) and 1-ethyl-3-(3-dimethylaminopropyl)-carbodiimide hydrochloride (EDC) at a 1:1 ratio, and then 1 nm peptide in 10 mm acetate buffer (pH 4.0) was injected over the activated surface until a response unit above 500 was observed. Blocking of the charged sensor channel to avoid nonspecific binding was carried out by adding 1 m ethanolamine. A similar method was used to activate and deactivate the control channel, except that the peptide was not added in the coupling buffer. Different concentrations of heme (500 nm to 10 μm) in a running buffer containing 1× PBS (pH 7.5) with P20 (0.05%) were passed over each channel, and the response was measured (in response units). The magnitude of response units is proportional to the amount of heme bound to the immobilized peptide. A constant flow rate of 30 μl/min was used to measure the association and dissociation between the ligand and the analyte for a time period of about 5 min. Regeneration of the sensor surface was carried out using 4 m MgCl2. The signal obtained from the control channel was used to correct for nonspecific binding by subtracting it from the flow channel.
The SPR data were analyzed using the BIA EVALUATION 3.1 software. To monitor the binding between Pincer-1 and heme, kinetic parameters were determined from the sensograms using nonlinear curve fitting method with various kinetic models. The best fit was obtained when a one-to-one binding model (Langmuir) was used for curve fitting. The KD was obtained from the association (Ka) and dissociation (Kd) rate constants as KD = Kd/Ka. The low χ2 value (>10% Rmax) indicates that the binding parameters obtained are reliable (Fig. S2).
Secondary structure determination and understanding Pincer-1–heme interaction using CD
CD experiments were performed on the Jasco J-810 spectrophotometer using a quartz cuvette with a sample volume of 300 μl and a path length of 1 mm. Both far-UV (200–250 nm) and near-UV (250–350 nm) spectra were collected. All spectra were collected at a 3-nm bandwidth and a 4-s response time. Three technical replicates were performed for each spectrum collected. These technical replicates were averaged and corrected for buffer spectrum. Stock solutions of Pincer-1 and heme were prepared as follows.
For CD experiments, PBS (1× PBS, pH adjusted to 7.5) was used instead of Tris buffer to avoid interference in the far-UV region. 2 ml of a 2.91 mm solution of Pincer-1 was prepared in PBS (solution D). 1 ml of a 29.1 mm hematin stock was prepared in a PBS/KOH buffer (PBS +50 mm KOH) buffer (solution E). Solution E was diluted 30-fold in PBS buffer, creating 1 ml of a solution of 970 μm hematin (solution F).
Samples were prepared, keeping the concentration of Pincer-1 constant while varying the concentration of hematin. Six relative saturations of hematin were chosen, 0%, 20%, 40%, 60%, 80%, and 100%, where the percentage values indicate the molar concentration of hematin relative to that of Pincer-1. For example, a 100% relative concentration indicates that hematin and Pincer-1 exist in a 1:1 stoichiometric ratio. For all samples, 10 μl of solution D was used. Six volumes of solution E were used, 0 μl, 6 μl, 12 μl, 18 μl, 24 μl, and 30 μl, corresponding to their respective relative saturation percentages. For all samples, the final volume was made up to 300 μl using PBS before collecting the CD spectra. The final Pincer-1 concentration was 97 μm for all samples.
To ensure that hematin alone did not contribute to CD ellipticity, a control experiment was performed where Pincer-1 was excluded. The resulting hematin–PBS solutions showed negligible ellipticity under the same concentrations and experimental conditions and were used for blank subtraction.
Structural characterization using NMR
The solution 1D 1H NMR spectra were acquired at 298 K on a Bruker Avance NMR spectrometer operating at a 1H resonance frequency of 800 MHz equipped with a cryogenically cooled triple-resonance probe. All NMR data were processed using the TOPSPIN software available on the NMR spectrometers and analyzed using both TOPSPIN and CCPN (59). The samples for NMR titration and other experiments were prepared by adding the required volume of heme from its stock solution to the protein sample and equilibrated prior to NMR measurements. We carried out two titration experiments. First a 500-μl solution of 20 μm unlabeled Pincer-1 peptide in water (90% H2O, 10% D2O) was titrated in the NMR tube with heme taken from a stock solution of 20 mm heme in water. The NMR spectra were recorded for five additions of the heme corresponding to 0, 2, 5, 10, 15, and 20 μm heme. The titration was stopped when no further significant changes in spectrum were observed in the 1D spectrum. The second was a titration in which a fresh solution of 500 μl of solution of 20 μm unlabeled BSA was taken in the NMR tube, and heme was gradually added to it from a stock solution 20 mm heme in water. The NMR spectra were recorded for five additions of the heme corresponding to 0, 2, 5, 10, 15, and 20 μm of heme. The experimental time for each of the 1D spectrum (pulse program zgesgp) was 32 min, and it was acquired with 8192 complex points and 1024 scans.
For 2D 1H-1H NOESY/TOCSY experiments, 1 mm unlabeled Pincer-1 in water (90% H2O, 10% D2O) was used. The solution NMR spectra were acquired at 298 K on a Bruker Avance NMR spectrometer operating at a 1H resonance frequency of 400 MHz. The 2D 1H-1H NOESY spectrum was acquired with 2048 complex points in the directly acquired dimension and 326 complex points in the indirectly acquired dimension. The 2D 1H-1H TOCSY (total correlation spectroscopy) spectrum was acquired with 2048 complex points in the directly acquired dimension and 300 complex points in the indirectly acquired dimension. The spectra were processed using the NMRPipe (1) and CcpNmr (version 2.4., release 2) (59) programs to obtain chemical shifts for the peptide monomer. CS-Rosetta (53) was used to construct a structural model based on chemical shift data. 40,000 structures were generated, and the best 10 (possessing the lowest Rosetta score) were selected. A CcpNmr project folder is provided for the 2D NOESY/TOCSY experiments (Protocol S2).
Author contributions
D. N., H. S. A., and N. C. conceptualization; D. N. data curation; D. N. software; D. N. validation; D. N., S. S., G. D., and K. K. investigation; D. N. visualization; D. N., S. S., G. D., and K. K. methodology; D. N. writing-original draft; H. S. A. and N. C. resources; H. S. A. supervision; H. S. A. and N. C. project administration; H. S. A. and N. C. writing-review and editing.
Supplementary Material
Acknowledgments
D. N. thanks Natasha Roy for teaching him how to process NMR spectra on very short notice. We thank Prof. H. S. Savithri for useful discussions. We thank the Department of Science and Technology (India) for use of the NMR facilities at the Indian Institute of Science.
This work was supported by the Department of Biotechnology (India). The authors declare that they have no conflicts of interest with the contents of this article.
This article contains Figs. S1–S3, Protocols S1 and S2, and Texts S1–S4.
Please note that the JBC is not responsible for the long-term archiving and maintenance of this site or any other third party–hosted site.
- SPR
- surface plasmon resonance
- TOCSY
- total correlated spectroscopy.
References
- 1. Delaglio, F., Grzesiek, S., Vuister, G. W., Zhu, G., Pfeifer, J., and Bax, A. (1995) NMRPipe: a multidimensional spectral processing system based on UNIX pipes. J. Biomol. NMR 6, 277–293 [DOI] [PubMed] [Google Scholar]
- 2. Tinberg, C. E., Khare, S. D., Dou, J., Doyle, L., Nelson, J. W., Schena, A., Jankowski, W., Kalodimos, C. G., Johnsson, K., Stoddard, B. L., and Baker, D. (2013) Computational design of ligand binding proteins with high affinity and selectivity. Nature 501, 212–216 10.1038/nature12443 [DOI] [PMC free article] [PubMed] [Google Scholar]
- 3. Moretti, R., Bender, B. J., Allison, B., and Meiler, J. (2016) Rosetta and the design of ligand binding sites. Methods Mol. Biol. 1414, 47–62 10.1007/978-1-4939-3569-7_4 [DOI] [PMC free article] [PubMed] [Google Scholar]
- 4. Lee, J., Natarajan, M., Nashine, V. C., Socolich, M., Vo, T., Russ, W. P., Benkovic, S. J., and Ranganathan, R. (2008) Surface sites for engineering allosteric control in proteins. Science 322, 438–442 10.1126/science.1159052 [DOI] [PMC free article] [PubMed] [Google Scholar]
- 5. Liu, Y., and Gray, N. S. (2006) Rational design of inhibitors that bind to inactive kinase conformations. Nat. Chem. Biol. 2, 358–364 10.1038/nchembio799 [DOI] [PubMed] [Google Scholar]
- 6. Eriksen, D. T., Lian, J., and Zhao, H. (2014) Protein design for pathway engineering. J. Struct. Biol. 185, 234–242 10.1016/j.jsb.2013.03.011 [DOI] [PMC free article] [PubMed] [Google Scholar]
- 7. Siegel, J. B., Zanghellini, A., Lovick, H. M., Kiss, G., Lambert, A. R., St Clair, J. L., Gallaher, J. L., Hilvert, D., Gelb, M. H., Stoddard, B. L., Houk, K. N., Michael, F. E., and Baker, D. (2010) Computational design of an enzyme catalyst for a stereoselective bimolecular Diels-Alder reaction. Science 329, 309–313 10.1126/science.1190239 [DOI] [PMC free article] [PubMed] [Google Scholar]
- 8. Copeland, W. B., Bartley, B. A., Chandran, D., Galdzicki, M., Kim, K. H., Sleight, S. C., Maranas, C. D., and Sauro, H. M. (2012) Computational tools for metabolic engineering. Metab. Eng. 14, 270–280 10.1016/j.ymben.2012.03.001 [DOI] [PMC free article] [PubMed] [Google Scholar]
- 9. Lee, J. W., Na, D., Park, J. M., Lee, J., Choi, S., and Lee, S. Y. (2012) Systems metabolic engineering of microorganisms for natural and non-natural chemicals. Nat. Chem. Biol. 8, 536–546 10.1038/nchembio.970 [DOI] [PubMed] [Google Scholar]
- 10. Nagarajan, D., Nagarajan, T., Roy, N., Kulkarni, O., Ravichandran, S., Mishra, M., Chakravortty, D., and Chandra, N. (2018) Computational antimicrobial peptide design and evaluation against multidrug-resistant clinical isolates of bacteria. J. Biol. Chem. 293, 3492–3509 [DOI] [PMC free article] [PubMed] [Google Scholar]
- 11. Kuroda, D., Shirai, H., Jacobson, M. P., and Nakamura, H. (2012) Computer-aided antibody design. Protein Eng. Des. Sel. 25, 507–521 10.1093/protein/gzs024 [DOI] [PMC free article] [PubMed] [Google Scholar]
- 12. Lin, Y.-W., Sawyer, E. B., and Wang, J. (2013) Rational heme protein design: all roads lead to Rome. Chem. Asian J. 8, 2534–2544 10.1002/asia.201300291 [DOI] [PubMed] [Google Scholar]
- 13. Nanda, V., and Koder, R. L. (2010) Designing artificial enzymes by intuition and computation. Nat. Chem. 2, 15–24 10.1038/nchem.473 [DOI] [PMC free article] [PubMed] [Google Scholar]
- 14. Reedy, C. J., and Gibney, B. R. (2004) Heme protein assemblies. Chem. Rev. 104, 617–649 10.1021/cr0206115 [DOI] [PubMed] [Google Scholar]
- 15. Sasaki, T., and Kaiser, E. T. (1989) Helichrome: synthesis and enzymic activity of a designed hemeprotein. J. Am. Chem. Soc. 111, 380–381 10.1021/ja00183a065 [DOI] [Google Scholar]
- 16. Sasaki, T., and Kaiser, E. T. (1990) Synthesis and structural stability of helichrome as an artificial hemeproteins. Biopolymers 29, 79–88 10.1002/bip.360290112 [DOI] [PubMed] [Google Scholar]
- 17. Isogai, Y., Ota, M., Fujisawa, T., Izuno, H., Mukai, M., Nakamura, H., Iizuka, T., and Nishikawa, K. (1999) Design and synthesis of a globin fold. Biochemistry 38, 7431–7443 10.1021/bi983006y [DOI] [PubMed] [Google Scholar]
- 18. Rosenblatt, M. M., Wang, J., and Suslick, K. S. (2003) De novo designed cyclic-peptide heme complexes. Proc. Natl. Acad. Sci. U.S.A. 100, 13140–13145 10.1073/pnas.2231273100 [DOI] [PMC free article] [PubMed] [Google Scholar]
- 19. Robertson, D. E., Farid, R. S., Moser, C. C., Urbauer, J. L., Mulholland, S. E., Pidikiti, R., Lear, J. D., Wand, A. J., DeGrado, W. F., and Dutton, P. L. (1994) Design and synthesis of multi-haem proteins. Nature 368, 425–432 10.1038/368425a0 [DOI] [PubMed] [Google Scholar]
- 20. Choma, C. T., Lear, J. D., Nelson, M. J., Dutton, P. L., Robertson, D. E., and DeGrado, W. F. (1994) Design of a heme-binding four-helix bundle. J. Am. Chem. Soc. 116, 856–865 10.1021/ja00082a005 [DOI] [Google Scholar]
- 21. Discher, B. M., Noy, D., Strzalka, J., Ye, S., Moser, C. C., Lear, J. D., Blasie, J. K., and Dutton, P. L. (2005) Design of amphiphilic protein maquettes: controlling assembly, membrane insertion, and cofactor interactions. Biochemistry 44, 12329–12343 10.1021/bi050695m [DOI] [PMC free article] [PubMed] [Google Scholar]
- 22. Mahajan, M., and Bhattacharjya, S. (2014) Designed di-heme binding helical transmembrane protein. ChemBioChem 15, 1257–1262 10.1002/cbic.201402142 [DOI] [PubMed] [Google Scholar]
- 23. Korendovych, I. V., Senes, A., Kim, Y. H., Lear, J. D., Fry, H. C., Therien, M. J., Blasie, J. K., Walker, F. A., and Degrado, W. F. (2010) De novo design and molecular assembly of a transmembrane diporphyrin-binding protein complex. J. Am. Chem. Soc. 132, 15516–15518 10.1021/ja107487b [DOI] [PMC free article] [PubMed] [Google Scholar]
- 24. Farid, T. A., Kodali, G., Solomon, L. A., Lichtenstein, B. R., Sheehan, M. M., Fry, B. A., Bialas, C., Ennist, N. M., Siedlecki, J. A., Zhao, Z., Stetz, M. A., Valentine, K. G., Anderson, J. L. R., Wand, A. J., Discher, B. M., et al. (2013) Elementary tetrahelical protein design for diverse oxidoreductase functions. Nat. Chem. Biol. 9, 826–833 10.1038/nchembio.1362 [DOI] [PMC free article] [PubMed] [Google Scholar]
- 25. Huang, S. S., Koder, R. L., Lewis, M., Wand, A. J., and Dutton, P. L. (2004) The hp-1 maquette: from an apoprotein structure to a structured hemoprotein designed to promote redox-coupled proton exchange. Proc. Natl. Acad. Sci. U.S.A. 101, 5536–5541 10.1073/pnas.0306676101 [DOI] [PMC free article] [PubMed] [Google Scholar]
- 26. Faiella, M., Maglio, O., Nastri, F., Lombardi, A., Lista, L., Hagen, W. R., and Pavone, V. (2012) De novo design, synthesis and characterisation of mp3, a new catalytic four-helix bundle hemeprotein. Chem. Eur. J. 18, 15960–15971 10.1002/chem.201201404 [DOI] [PubMed] [Google Scholar]
- 27. Cherry, J. R., Lamsa, M. H., Schneider, P., Vind, J., Svendsen, A., Jones, A., and Pedersen, A. H. (1999) Directed evolution of a fungal peroxidase. Nat. Biotechnol. 17, 379–384 10.1038/7939 [DOI] [PubMed] [Google Scholar]
- 28. Anderson, J. L. R., Armstrong, C. T., Kodali, G., Lichtenstein, B. R., Watkins, D. W., Mancini, J. A., Boyle, A. L., Farid, T. A., Crump, M. P., Moser, C. C., and Dutton, P. L. (2014) Constructing a man-made c-type cytochrome maquette in vivo: electron transfer, oxygen transport and conversion to a photoactive light harvesting maquette. Chem. Sci. 5, 507–514 10.1039/C3SC52019F [DOI] [PMC free article] [PubMed] [Google Scholar]
- 29. Koder, R. L., Anderson, J. L., Solomon, L. A., Reddy, K. S., Moser, C. C., and Dutton, P. L. (2009) Design and engineering of an O2 transport protein. Nature 458, 305–309 10.1038/nature07841 [DOI] [PMC free article] [PubMed] [Google Scholar]
- 30. Rojas, N. R., Kamtekar, S., Simons, C. T., McLean, J. E., Vogel, K. M., Spiro, T. G., Farid, R. S., and Hecht, M. H. (1997) De novo heme proteins from designed combinatorial libraries. Protein Sci. 6, 2512–2524 [DOI] [PMC free article] [PubMed] [Google Scholar]
- 31. Moffet, D. A., Foley, J., and Hecht, M. H. (2003) Midpoint reduction potentials and heme binding stoichiometries of de novo proteins from designed combinatorial libraries. Biophys. Chem. 105, 231–239 10.1016/S0301-4622(03)00072-3 [DOI] [PubMed] [Google Scholar]
- 32. Patel, S. C., Bradley, L. H., Jinadasa, S. P., and Hecht, M. H. (2009) Cofactor binding and enzymatic activity in an unevolved superfamily of de novo designed 4-helix bundle proteins. Protein Sci. 18, 1388–1400 10.1002/pro.147 [DOI] [PMC free article] [PubMed] [Google Scholar]
- 33. Gray, J. C. (1992) Cytochrome f: structure, function and biosynthesis, Photosynth. Res. 34, 359–374 10.1007/BF00029811 [DOI] [PubMed] [Google Scholar]
- 34. Paoli, M., Anderson, B. F., Baker, H. M., Morgan, W. T., Smith, A., and Baker, E. N. (1999) Crystal structure of hemopexin reveals a novel high-affinity heme site formed between two β-propeller domains. Nat. Struct. Mol. Biol. 6, 926–931 10.1038/13294 [DOI] [PubMed] [Google Scholar]
- 35. Crick, F. H. (1953) The packing of α-helices: simple coiled-coils. Acta Crystallogr. 6, 689–697 10.1107/S0365110X53001964 [DOI] [Google Scholar]
- 36. Schiffer, M., and Edmundson, A. B. (1967) Use of helical wheels to represent the structures of proteins and to identify segments with helical potential. Biophys. J. 7, 121–135 10.1016/S0006-3495(67)86579-2 [DOI] [PMC free article] [PubMed] [Google Scholar]
- 37. Huang, P.-S., Oberdorfer, G., Xu, C., Pei, X. Y., Nannenga, B. L., Rogers, J. M., DiMaio, F., Gonen, T., Luisi, B., and Baker, D. (2014) High thermodynamic stability of parametrically designed helical bundles. Science 346, 481–485 10.1126/science.1257481 [DOI] [PMC free article] [PubMed] [Google Scholar]
- 38. Ouberai, M., Dolphin, G. T., Dumy, P., and Garcia, J. (2011) Amyloidogenesis highlighted by designed peptides forming supramolecular self-assemblies. Chem. Sci. 2, 1293–1300 10.1039/c1sc00016k [DOI] [Google Scholar]
- 39. Rufo, C. M., Moroz, Y. S., Moroz, O. V., Stöhr, J., Smith, T. A., Hu, X., DeGrado, W. F., and Korendovych, I. V. (2014) Short peptides self-assemble to produce catalytic amyloids. Nat. Chem. 6, 303–309 10.1038/nchem.1894 [DOI] [PMC free article] [PubMed] [Google Scholar]
- 40. D'Souza, A., Mahajan, M., and Bhattacharjya, S. (2016) Designed multi-stranded heme binding β-sheet peptides in membrane. Chem. Sci. 7, 2563–2571 10.1039/C5SC04108B [DOI] [PMC free article] [PubMed] [Google Scholar]
- 41. Kabsch, W., and Sander, C. (1983) Dictionary of protein secondary structure: pattern recognition of hydrogen-bonded and geometrical features. Biopolymers 22, 2577–2637 10.1002/bip.360221211 [DOI] [PubMed] [Google Scholar]
- 42. Cochran, A. G., Skelton, N. J., and Starovasnik, M. A. (2001) Tryptophan zippers: stable, monomeric β-hairpins. Proc. Natl. Acad. Sci. U.S.A. 98, 5578–5583 10.1073/pnas.091100898 [DOI] [PMC free article] [PubMed] [Google Scholar]
- 43. Morris, G. M., Huey, R., Lindstrom, W., Sanner, M. F., Belew, R. K., Goodsell, D. S., and Olson, A. J. (2009) Autodock4 and autodocktools4: Automated docking with selective receptor flexibility. J. Comput. Chem. 30, 2785–2791 10.1002/jcc.21256 [DOI] [PMC free article] [PubMed] [Google Scholar]
- 44. Cooper, S., Khatib, F., Treuille, A., Barbero, J., Lee, J., Beenen, M., Leaver-Fay, A., Baker, D., Popović, Z., and Players, F. (2010) Predicting protein structures with a multiplayer online game. Nature 466, 756–760 10.1038/nature09304 [DOI] [PMC free article] [PubMed] [Google Scholar]
- 45. Dunbrack, R. L., Jr., and Karplus, M. (1993) Backbone-dependent rotamer library for proteins application to side-chain prediction. J. Mol. Biol. 230, 543–574 10.1006/jmbi.1993.1170 [DOI] [PubMed] [Google Scholar]
- 46. Dunbar, J. B., Jr., Smith, R. D., Damm-Ganamet, K. L., Ahmed, A., Esposito, E. X., Delproposto, J., Chinnaswamy, K., Kang, Y.-N., Kubish, G., Gestwicki, J. E., Stuckey, J. A., and Carlson, H. A. (2013) Csar data set release 2012: ligands, affinities, complexes, and docking decoys. J. Chem. Inf. Model. 53, 1842–1852 10.1021/ci4000486 [DOI] [PMC free article] [PubMed] [Google Scholar]
- 47. Malisi, C., Schumann, M., Toussaint, N. C., Kageyama, J., Kohlbacher, O., and Höcker, B. (2012) Binding pocket optimization by computational protein design. PLoS One 7, e52505 10.1371/journal.pone.0052505 [DOI] [PMC free article] [PubMed] [Google Scholar]
- 48. Anand, P., Nagarajan, D., Mukherjee, S., and Chandra, N. (2014) Abs-scan: in silico alanine scanning mutagenesis for binding site residues in protein-ligand complex. F1000Research 3, 214 10.12688/f1000research.5165.2 [DOI] [PMC free article] [PubMed] [Google Scholar]
- 49. Hanson, E. K., and Ballantyne, J. (2010) A blue spectral shift of the hemoglobin Soret band correlates with the age (time since deposition) of dried bloodstains. PLoS ONE 5, e12830 10.1371/journal.pone.0012830 [DOI] [PMC free article] [PubMed] [Google Scholar]
- 50. Voet, D., Voet, J. G., and Pratt, C. W. (2006) Fundamentals of Biochemistry: Life at the Molecular Level, 2nd Ed., p. 838, John Wiley and Sons, New York [Google Scholar]
- 51. Zhu, H., Liu, M., and Lei, B. (2008) The surface protein shr of Streptococcus pyogenes binds heme and transfers it to the streptococcal heme-binding protein shp. BMC Microbiol. 8, 15 10.1186/1471-2180-8-15 [DOI] [PMC free article] [PubMed] [Google Scholar]
- 52. Woody, R. W. (1994) Contributions of tryptophan side chains to the far-ultraviolet circular dichroism of proteins. Eur. Biophys. J. 23, 253–262 10.1007/BF00213575 [DOI] [PubMed] [Google Scholar]
- 53. Shen, Y., Lange, O., Delaglio, F., Rossi, P., Aramini, J. M., Liu, G., Eletsky, A., Wu, Y., Singarapu, K. K., Lemak, A., Ignatchenko, A., Arrowsmith, C. H., Szyperski, T., Montelione, G. T., Baker, D., and Bax, A. (2008) Consistent blind protein structure generation from NMR chemical shift data. Proc. Natl. Acad. Sci. U.S.A. 105, 4685–4690 10.1073/pnas.0800256105 [DOI] [PMC free article] [PubMed] [Google Scholar]
- 54. Venkatraman, J., Shankaramma, S. C., and Balaram, P. (2001) Design of folded peptides. Chem. Rev. 101, 3131–3152 10.1021/cr000053z [DOI] [PubMed] [Google Scholar]
- 55. Nagarajan, D., Deka, G., and Rao, M. (2015) Design of symmetric tim barrel proteins from first principles. BMC Biochem. 16, 18 10.1186/s12858-015-0047-4 [DOI] [PMC free article] [PubMed] [Google Scholar]
- 56. Huang, P.-S., Feldmeier, K., Parmeggiani, F., Velasco, D. A. F., Höcker, B., and Baker, D. (2016) De novo design of a four-fold symmetric tim-barrel protein with atomic-level accuracy. Nat. Chem. Biol. 12, 29–34 10.1038/nchembio.1966 [DOI] [PMC free article] [PubMed] [Google Scholar]
- 57. King, N. P., Bale, J. B., Sheffler, W., McNamara, D. E., Gonen, S., Gonen, T., Yeates, T. O., and Baker, D. (2014) Accurate design of coassembling multi-component protein nanomaterials. Nature 510, 103–108 10.1038/nature13404 [DOI] [PMC free article] [PubMed] [Google Scholar]
- 58. Crick, F. H. (1968) The origin of the genetic code. J. Mol. Biol. 38, 367–379 10.1016/0022-2836(68)90392-6 [DOI] [PubMed] [Google Scholar]
- 59. Vranken, W. F., Boucher, W., Stevens, T. J., Fogh, R. H., Pajon, A., Llinas, M., Ulrich, E. L., Markley, J. L., Ionides, J., and Laue, E. D. (2005) The CCPN data model for NMR spectroscopy: development of a software pipeline. Proteins 59, 687–696 10.1002/prot.20449 [DOI] [PubMed] [Google Scholar]
Associated Data
This section collects any data citations, data availability statements, or supplementary materials included in this article.