Abstract
Defects in phosphatase and tensin homolog (PTEN) are associated with neurological disorders and tumors. PTEN functions at two primary intracellular locations: the plasma membrane and the nucleus. At the membrane, PTEN functions as a phosphatidylinositol (3,4,5)-trisphosphate phosphatase and suppresses PI 3-kinase signaling that drives cell growth and tumorigenesis. However, the in vivo function of nuclear PTEN is unclear. Here, using CRISPR/Cas9, we generated a mouse model in which PTEN levels in the nucleus are decreased. Nuclear PTEN-deficient mice were born with microcephaly and maintained a small brain during adulthood. The size of neuronal soma was significantly smaller in the cerebellum, cerebral cortex, and hippocampus. Also, these mice were prone to seizure. No changes in PI 3-kinase signaling were observed. By contrast, the size of other organs was unaffected. Therefore, nuclear PTEN is essential for the health of the brain by promoting the growth of neuronal soma size during development.
Keywords: phosphatase and tensin homolog (PTEN), phosphatidylinositide 3-kinase (PI 3-kinase), mouse genetics, brain, cell signaling, lipid signaling, PIP3 signaling, nucleus, mouse, genome editing
Introduction
Phosphatase and tensin homolog (PTEN)2 plays important roles in the regulation of signal transduction networks in the central nervous system (1–3). Defects in PTEN have been linked to various neurological diseases, including autism spectrum disorders, seizure, Cowden syndrome, Bannayan-Riley-Ruvalcaba syndrome, and Proteus-like syndrome (4–6). The exact pathogenic mechanisms underlying these diseases are unclear because PTEN functions in at least two distinct subcellular localizations: the plasma membrane and the nucleus (7–11). At the plasma membrane, PTEN functions as a lipid phosphatase that dephosphorylates phosphatidylinositol (3,4,5)-triphosphate (PIP3) to inhibit phosphatidylinositol 3-kinase (PI3K) signaling (1–3, 12–14).
In the nucleus, PTEN has been shown to control DNA damage responses and maintain genome integrity through interactions with nuclear AKT and p53 (7–11, 15–18). PIP3, in addition to PI3Ks and AKT, is also found in the nucleus, although the levels of PIP3 are considerably less (19). Therefore, the function of PTEN in the nucleus has been suggested to be independent of its PIP3 phosphatase activity, distinct from its function at the plasma membrane (11, 20). Cytosolic and nuclear PTEN may take different conformations to undergo phosphatase-dependent and phosphatase-independent functions (21). It has been reported that nuclear PTEN displays protein phosphatase activity against other nuclear proteins or undergoes other types of protein–protein interactions (11, 16). For example, the lipid and protein phosphatase activities of PTEN are dispensable for the function of nuclear PTEN in tumor suppression through regulating the anaphase-promoting complex (16). However, because these studies of nuclear PTEN have been primarily carried out in cell culture, the role of nuclear PTEN in vivo remains unknown.
The nuclear localization of PTEN is dynamic. The amount of PTEN in the nucleus changes in response to a wide range of cellular and environmental cues, such as cell cycle progression, development, oxidative stress, and neurotoxins (7–11). In neurons, where PTEN is highly expressed, PTEN transits in and out of the nucleus under physiological conditions, such as brain development, and under pathological conditions, such as ischemia, brain injury, and excitotoxicity (11, 22). Monoubiquitination of lysine 13 has been identified as a critical step for targeting PTEN to the nucleus (23–25). Substitution of lysine 13 with arginine inhibits the localization of PTEN to the nucleus (25).
Loss of total PTEN (e.g. both nuclear and nonnuclear PTEN) in the brain leads to an increase in soma size, ectopic dendrites, and macrocephaly, as well as the formation of excess synapses because of increased PIP3 signaling via increased phosphorylation of AKT and mTOR at the plasma membrane (1, 26–28). These previous studies have demonstrated the importance of total PTEN in vivo. A next overarching challenge in PTEN biology is to address the in vivo function of nuclear PTEN, separately from the function of PTEN at the plasma membrane. In the current work, using the CRISPR/Cas9 genome editing system, we specifically inhibited the nuclear localization of PTEN without affecting its plasma membrane localization in mice.
Results
PTENK13R, D384V mice are born with microcephaly
To investigate the physiological function of nuclear PTEN, using the CRISPR/Cas9 genome editing system, we introduced two mutations into the PTEN gene in mice. The first mutation substitutes lysine 13 to arginine. This substitution inhibits the ubiquitination required for the translocation of PTEN to the nucleus (24, 25) (Fig. 1A). The second mutation targets the amino acid sequence from 380 to 386 in the C-terminal tail (Fig. 1A). This region consists of negatively charged aspartates and serine and threonine clusters that undergo phosphorylation. These negative charges and phosphorylation are important for closing the conformation of PTEN through intramolecular interaction with the membrane-binding regulatory interface (consisting of the catalytic and C2 domains) (29–31). The combination of these two substitutions make PTEN more dynamic in terms of intracellular distribution and excludes PTEN from the nucleus (32). We injected a pair of single guide RNAs (sgRNAs) that are directed to these two regions of the PTEN gene into fertilized oocytes from standard B6SJLF1/J mice and transferred injected oocytes into pseudopregnant mice. We obtained 22 mice, and DNA sequenced their PTEN gene. We identified a founder mouse that carries substitutions of both lysine 13 to arginine and aspartate at 384 to valine (Fig. 1B). The founder line was backcrossed to C57BL/6J WT mice multiple times. We crossed heterozygous PTENK13R, D384V mice to obtain homozygous PTENK13R, D384V mice (hereafter PTENK13R, D384V mice) and littermate control mice. PTENK13R, D384V mice were born at an approximately Mendelian ratio and grew to normal body size (Fig. 1C).
Figure 1.
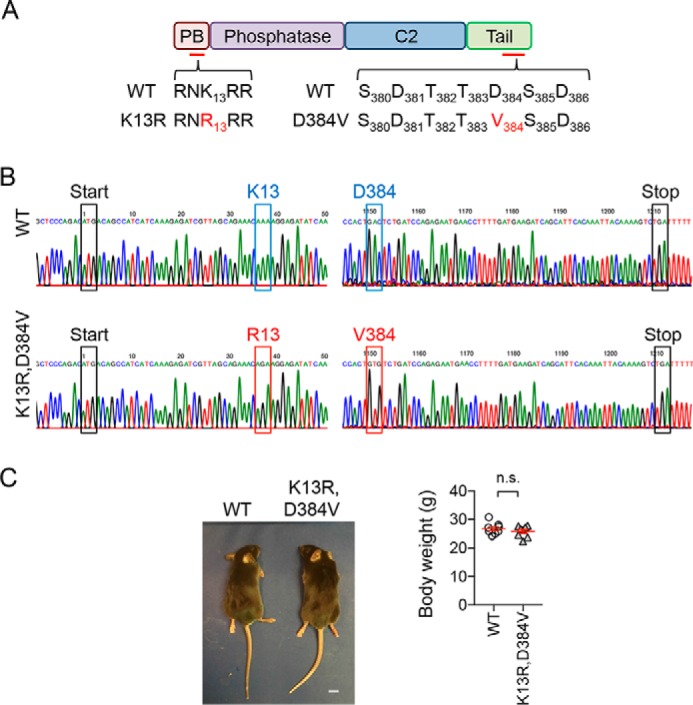
Generation of PTENK13R, D384V mice. A, mutations were introduced into the PTEN gene to substitute lysine 13 (K13) to arginine (R) in the N-terminal PIP2-binding domain (PB) and aspartate 384 (D384) to valine (V) in the C-terminal tail. B, DNA sequencing confirmed the K13R mutation (AAA changed to AGA) and D384V mutation (GAC to GTG). C, general appearance and body weight of PTENK13R, D384V and littermate control mice at 8–10 weeks old. Bars represent the mean ± S.E. (n = 8 male mice). Statistical analysis was performed using the Student's t test. Scale bar in C, 1 cm.
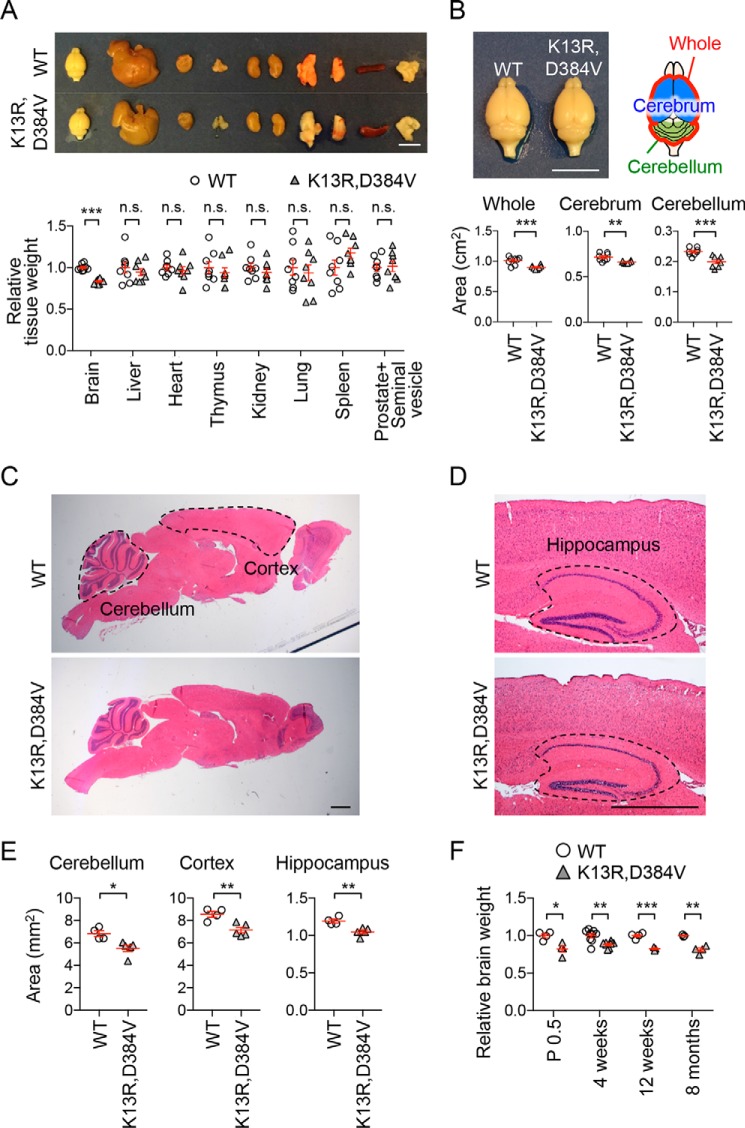
To determine the impact of the K13R and D384V mutations on organ size, we measured the weights of multiple organs. Brain weight was significantly decreased in PTENK13R, D384V mice of both sex (Fig. 2A and Fig. S1). In contrast, other organs, including the liver, heart, thymus, kidney, lung, spleen, and prostate/seminal vesicle, showed comparable weights between mutant and control mice (Fig. 2A and Fig. S1). Consistent with decreased brain weight, the area of the whole brain, as well as the cerebrum and cerebellum, were significantly decreased when measured in the top view (Fig. 2B). To further analyze subregions of the brain in PTENK13R, D384V mice, we fixed the brains using cardiac perfusion of paraformaldehyde and cut sagittal sections in the midline. Hematoxylin and eosin (H&E) staining showed no gross changes in the histology of the PTENK13R, D384V mice brain (Fig. 2, C and D). However, we found significant decreases in the area of the PTENK13R, D384V cerebral cortex and cerebellum in the side-view (Fig. 2, C and E). The size of the PTENK13R, D384V hippocampus was also significantly decreased in coronal sections (Fig. 2, D and E).
Figure 2.
Microcephaly in PTENK13R, D384V mice. A, images and weight of the indicated organs dissected out from PTENK13R, D384V and littermate control mice at 8–10 weeks old. Bars represent the mean ± S.E. (n = 8 male mice). Scale bar, 1 cm. B, the area of the whole brain, cerebrum, and cerebellum was determined in the top view. Bars represent the mean ± S.E. (n = 8 male mice). Scale bar, 1 cm. C, H&E staining of sagittal sections cut in the midline of brains from PTENK13R, D384V and littermate control mice at 8–10 weeks old. The cerebellum and cortex are outlined. Scale bar, 0.1 cm. D, the hippocampus is outlined in coronal sections. Scale bar, 0.1 cm. E, areas of the cerebellum, cortex, and hippocampus were quantified. Bars represent the mean ± S.E. (n = 4 control and 5 PTENK13R, D384V mice). F, weight of the brain was determined at the indicated ages. Bars represent the mean ± S.E. (n of control mice = 4 for P0.5, 9 for 4 weeks, 4 for 12 weeks, 3 for 8 months; n of PTENK13R, D384V mice = 4 for P0.5, 8 for 4 weeks, 3 for 12 weeks, 5 for 8 months). Statistical analysis was performed using the Student's t test: *, p < 0.05; **, p < 0.01; ***, p < 0.001.
To determine when changes in brain size occur in PTENK13R, D384V mice, we examined the weight of brains at different ages ranging from day 0–8 months. We found that the brain in PTENK13R, D384V mice is already smaller at birth and maintains its small size during adulthood (Fig. 2F). Because the development of the brain initiates in embryos and continues postnatally, these data suggest that PTENK13R, D384V affects brain development during both embryonic and postnatal periods.
These small brain phenotypes in PTENK13R, D384V mice are in sharp contrast to increased brain size in brain-specific PTEN knockout mice because of increased neuron size through enhanced PI3K signaling (1, 26–28, 33–36).
Decreases in neuronal soma size and nuclear PTEN levels in PTENK13R, D384V mice
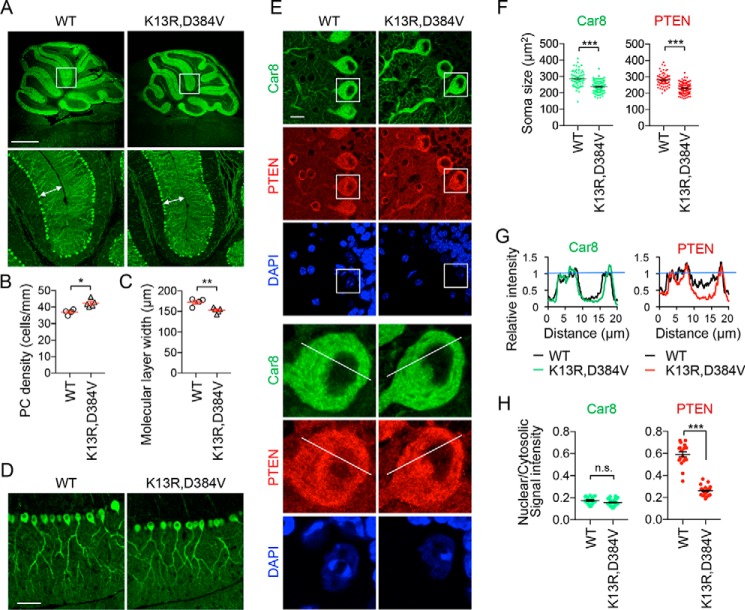
To determine the effect of PTENK13R, D384V on neuron size, we first examined the cerebellum and analyzed one of its major neurons, Purkinje cells (PCs), using confocal immunofluorescence microscopy. The soma of PCs forms a monolayer called the PC layer with highly extended dendritic arbors into the molecular layer. This stereotypical arrangement allowed us to quantitatively measure the density and size of PCs (37, 38). Brain sagittal sections were cut in the midline and stained with antibodies to Car8, a cytosolic marker for PCs (37). The density of the PC soma was significantly increased along the PC layer of PTENK13R, D384V mice, suggesting that the sizes of the soma of PCs decreased (Fig. 3, A and B). Indeed, image analyses of individual PCs showed that the size of their soma is significantly smaller in PTENK13R, D384V mice (Fig. 3, E and F, Car8). Co-immunostaining with anti-PTEN antibodies also showed a similar decrease in soma size of PTENK13R, D384V PCs (Fig. 3, E and F, PTEN). A significant decrease in the width of the molecular layer, which contains dendrites of PC, was also observed in PTENK13R, D384V mice (Fig. 3, A and C). Images with greater magnification of the molecular layer suggest that Purkinje dendritic arbors are shorter in PTENK13R, D384V mice (Fig. 3D).
Figure 3.
Decreased neuron size and nuclear PTEN levels in the cerebellum of PTENK13R, D384V mice. A–D, sagittal sections of the cerebellum cut in the midline were immunostained with anti-Car8 antibodies. Boxed regions are enlarged in A. The density of the soma of PCs and the width of the molecular layer (arrows in A) are quantified in B and C, respectively. Bars are the mean ± S.E. (n = 4 control and 5 PTENK13R, D384V mice). D, higher magnification images of the molecular layer. E, sagittal sections of the cerebellum in the midline were immunostained with antibodies to Car8 and PTEN along with DAPI. Boxed regions are enlarged. F, the area of the soma of PCs is quantified using Car8 and PTEN staining. Bars are the mean ± S.E. (n = 80 control and 111 PTENK13R, D384V cells). G, the fluorescent intensity of Car8 (green) and PTEN (red) was quantified along lines in E. H, the mean intensity of Car8 and PTEN in the nucleus relative to the cytosol was determined. Bars are the mean ± S.E. (n = 73 control and 93 PTENK13R, D384V cells). Statistical analysis was performed using the Student's t test: *, p < 0.05; **, p < 0.01; ***, p < 0.001. Scale bars, 0.1 cm in A, 50 μm in D, and 10 μm in E.
Importantly, quantification of immunofluorescence images revealed significant decreases in the signal of PTEN in the nucleus relative to that of PTEN in the cytosol of PTENK13R, D384V PCs (Fig. 3, G and H, PTEN). As a control, the relative signal intensity of Car8 between the nucleus and cytosol were similar in PTENK13R, D384V and control PCs (Fig. 3, G and H, Car8).
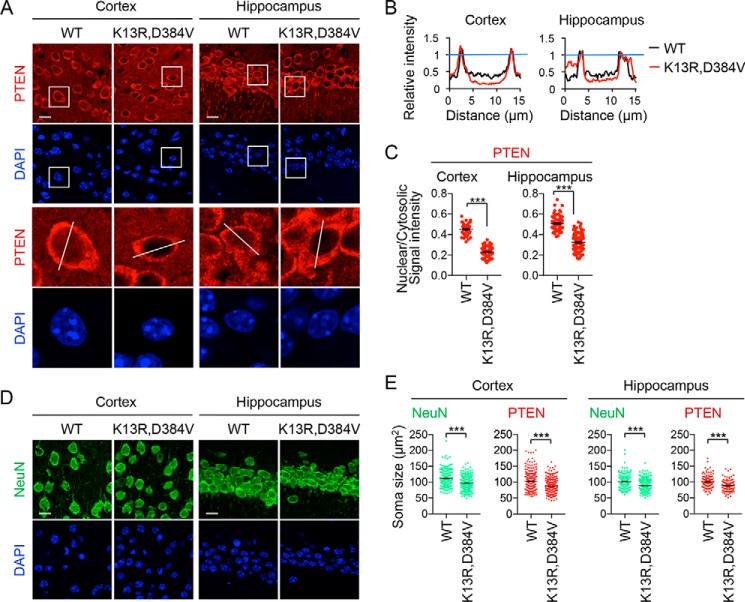
The intracellular distribution of PTEN and somata sizes in neurons of the motor cortex (layers 3 and 4) and hippocampus (CA1 region) were measured using confocal immunofluorescence microscopy with antibodies to PTEN and a mature neuron marker, NeuN (Fig. 4, A and D). Anti-NeuN antibodies label the entire cytoplasm (39). Relative neuronal PTEN levels at the nucleus and the cytosol were again found to be significantly decreased in PTENK13R, D384V mice (Fig. 4, A–C). Also, immunostaining of both PTEN and NeuN showed that these neuronal somata were significantly smaller in PTENK13R, D384V mice (Fig. 4E). Therefore, the K13R and D384V mutations decrease levels of PTEN in the nucleus and reduce the size of neurons in the cerebellum, cortex, and hippocampus in vivo.
Figure 4.
Decreased neuron size and nuclear PTEN levels in the cortex and hippocampus of PTENK13R, D384V mice. A, sagittal sections of the brain cut in the midline are immunostained with anti-PTEN antibodies to examine the cerebral cortex (layers III and IV) and the hippocampus (CA1). Boxed regions are enlarged. B, the fluorescent intensity of PTEN was quantified along lines indicated in A. C, the mean intensity of PTEN in the nucleus relative to the cytosol was determined in the cerebral cortex (layers III and IV) (n = 59 control and 73 PTENK13R, D384V cells) and the hippocampus (n = 73 control and 96 PTENK13R, D384V cells). Bars are the mean ± S.E. D, sagittal sections of the brain cut in the midline are immunostained with anti-NeuN antibodies to examine the cerebral cortex (layers III and IV) and the hippocampus (CA1). E, the size of the soma based on NeuN staining from D was determined in the cerebral cortex (layers III and IV) (n = 238 control and 308 PTENK13R, D384V cells) and the hippocampus (n = 180 control and 241 PTENK13R, D384V cells). The size of the soma was also determined based on PTEN staining from A in the cerebral cortex (layers III and IV) (n = 266 control and 333 PTENK13R, D384V cells) and the hippocampus (n = 126 control and 107 PTENK13R, D384V cells). Bars are the mean ± S.E. Statistical analysis was performed using the Student's t test: ***, p < 0.001. Scale bars, 10 μm in A and D.
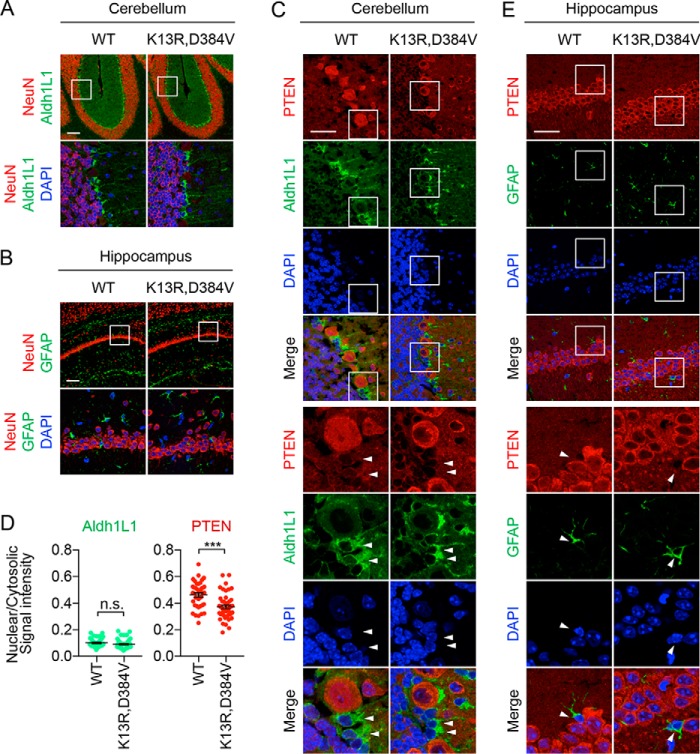
In addition to neurons, glial cells in PTENK13R, D384V mice were examined via immunofluorescence microscopy of the cerebellum using antibodies to NeuN and Aldh1L1, a glial marker that labels Bergmann glial cells in the cerebellum (40, 41). The number and distribution of Aldh1L1-positive cells in controls and PTENK13R, D384V mice were similar (Fig. 5A). The hippocampus was also analyzed using antibodies to NeuN and GFAP, another glial marker (40, 41). Again, no gross changes in the pattern of GFAP-positive glial cells were found in PTENK13R, D384V mice (Fig. 5B).
Figure 5.
Decreased nuclear PTEN levels in glial cells in the cerebella of PTENK13R, D384V mice. A and B, sagittal sections of the brain cut at the midline are immunostained with NeuN and Aldh1L1 antibodies in A and NeuN and GFAP antibodies in B. Boxed regions enlarged. C, cerebella were analyzed by immunostaining with PTEN and Aldh1L1 antibodies. D, mean (± S.E.) PTEN and Aldh1L1 intensities in the nucleus relative to the cytosol were determined (40 controls, 48 PTENK13R, D384V cells). E, the hippocampus was analyzed by immunostaining with PTEN and GFAP antibodies. White arrowheads indicate glial cells (C and E). Scale bars, 100 μm (A and B) or 40 μm (C and E).
As with the neurons, immunostaining of the cerebellum with antibodies to PTEN and Aldh1L1 showed that PTEN levels in the nucleus significantly decreased in Aldh1L1-positive glial cells in PTENK13R, D384V mice, but the total PTEN levels in these glial cells were lower than those in the PCs in both controls and PTENK13R, D384V mice (Fig. 5, C and D). Because GFAP-positive glial cells in the hippocampus expressed much lower levels of PTEN (Fig. 5E), a reliable comparison of PTEN levels in the nucleus and cytoplasm was impossible.
Although the livers in PTENK13R, D384V mice did not appear to change in size (Fig. 2A and Fig. S1), nuclear PTEN levels were significantly decreased in their hepatocytes (Fig. S2). It appears that the K13R and D384V mutations universally affect PTEN localization in the nucleus, but the physiological consequences of PTEN mislocalization depend on cell type.
PTENK13R, D384V mice show susceptibility to seizure
Seizures have been observed in patients with diseases linked to PTEN mutations, such as autism spectrum disorder (4–6, 42). Because no spontaneous seizure was observed in PTENK13R, D384V mice, we tested susceptibility to seizure using a well-established paradigm in which seizure is induced by intraperitoneal injection of a GABA receptor antagonist, pentylenetetrazol (PTZ) (43, 44). Littermate control mice started showing seizures at 2–3 min after injection of a standard amount of PTZ (75 mg/kg body weight) and subsequently recovered from the seizure (Fig. 6A). In contrast, PTENK13R, D384V mice showed a much shorter latency before starting seizure upon PTZ injection (Fig. 6A). Remarkably, most PTENK13R, D384V mice (7 of 10) died within 5 min after PTZ injection (Fig. 6B). We did not observe PTZ-induced death of control mice. Therefore, these data suggest that PTENK13R, D384V mice have increased susceptibility to seizure.
Figure 6.
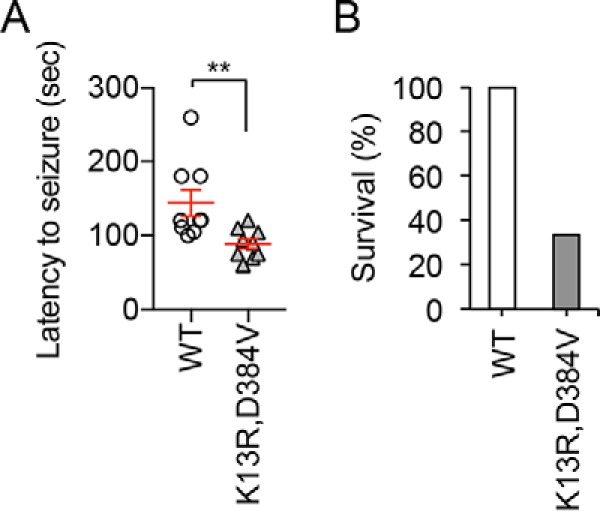
Increased seizure susceptibility in PTENK13R, D384V mice. A and B, mice were subjected to intraperitoneal injection of a standard amount of PTZ (75 mg/kg body weight). Latency to start seizure was determined in A. PTENK13R, D384V mice showed hypersensitivity to PTZ. B, percentage of mice that survived after PTZ injection. Most PTENK13R, D384V mice died after PTZ injection. 10 control and 10 PTENK13R, D384V mice were analyzed. Statistical analysis was performed using Student's t test: **, p < 0.01.
PTENK13R, D384V mice display normal PI3K signaling
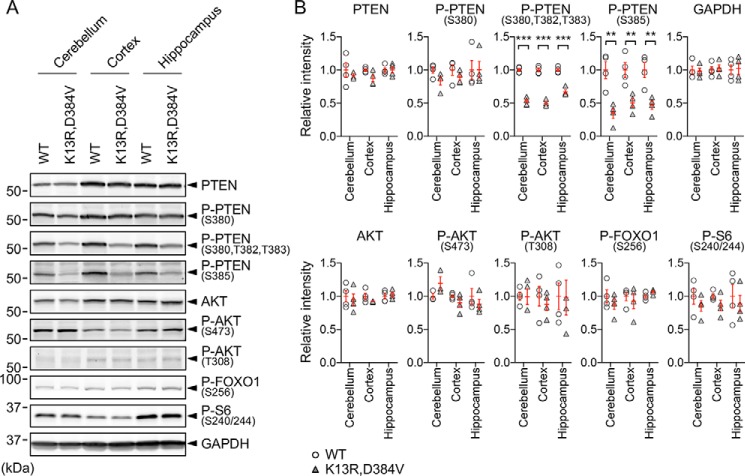
To determine whether decreased levels of nuclear PTEN affect PI3K signaling, we examined the levels of phosphorylation of the serine/threonine kinase AKT at serine 473 and threonine 308, two major downstream events in PI3K signaling (45). Activated AKT by these phosphorylation events, in turn, phosphorylates and activates a crucial downstream transcriptional factor, forkhead box protein O1 (FOXO1). The activation of AKT also leads to phosphorylation of S6 ribosomal protein through mTORC1. Using Western blotting of the isolated cerebellum, cortex, and hippocampus, we found that the phosphorylation levels of AKT (Ser-473 and Thr-308), FOXO1 (Ser-256), and S6 (Ser-240/244) were not changed in PTENK13R, D384V mice (Fig. 7, A and B). As controls, the abundance of PTEN was comparable in PTENK13R, D384V and control mice. Consistent with previous studies showing that mutations in the C terminus of PTEN affect phosphorylation of the serine/threonine cluster in this region (25, 32), we observed decreased PTEN phosphorylation in Western blotting with antibodies that recognize PTEN phosphorylation of serine 380, threonines 382 and 383, and serine 385 (Fig. 7, A and B). These data suggest that nuclear PTEN is not involved in the PI3K signaling pathway, different from the function of PTEN at the plasma membrane. These findings support previous findings showing that the K13R mutation does not affect the enzymatic activity of PTEN or its recruitment to the plasma membrane; therefore leaving PI3K signaling to be intact (25, 32).
Figure 7.
PI3K signaling was not affected in PTENK13R, D384V mice. A, Western blotting of the cerebellum, cortex, and hippocampus isolated from 3-month-old PTENK13R, D384V and littermate control mice using antibodies to PTEN, phospho-PTEN (S380), phospho-PTEN (S380, T382, T383), phospho-PTEN (S385), AKT, phospho-AKT (S473), phospho-AKT (T308), phospho-FOXO1 (S256), phospho-S6 (S240/244), and GAPDH. B, quantification of band intensity. Bars are the mean ± S.E. (n = 4). Statistical analysis was performed using the Student's t test: **, p < 0.01; ***, p < 0.001.
Discussion
Previous studies using a variety of PTEN knockout mice have clearly demonstrated the physiological importance of PTEN (46–48). Because PTEN functions in different intracellular locations, it remains to be determined the specific in vivo functions of the nuclear and membrane PTEN. In this study, we generated and characterized PTENK13R, D384V mice in which the amount of nuclear PTEN is significantly decreased. Importantly, this new mouse model showed normal PI3K signaling, and therefore the function of PTEN at the plasma membrane was not disturbed.
Nuclear PTEN deficiency predominantly affected the brain and caused microcephaly with decreased size of neuronal soma in the cerebellum, cerebral cortex, and hippocampus. These phenotypes were surprising to us because previous studies have shown that the loss of PTEN results in hypertrophy and macrocephaly (1, 26–28, 33–36). The increased neuron and brain sizes in these PTEN knockout mice resulted from increased PI3K signaling at the plasma membrane in the absence of the PIP3 phosphatase function of PTEN. Along with these previous studies, our findings provide a new model that PTEN at the plasma membrane and the nucleus plays opposite roles in the growth of neurons in the brain. We expect that if one could specifically block PTEN function in PIP3 signaling at the plasma membrane, without affecting nuclear PTEN function in the brain, neuron and brain sizes would further increase compared with the loss of total PTEN.
Because we observed no changes in PI3K signaling in PTENK13R, D384V mice, nuclear PTEN regulates neurons through a mechanism distinct from the PI3K signaling pathway. Studies have shown that nuclear PTEN functions in DNA repair, genome integrity, and cell cycle progression (7–11, 15–18). It appears that inhibition of these activities might not necessarily result in decreased neuron size or microcephaly. Further studies are necessary to better understand the mechanisms underlying the physiological consequence of nuclear PTEN deficiency. Our PTENK13R, D384V mice would provide a useful tool to address this key question.
PTENK13R, D384V mice were extremely sensitive to the GABA receptor antagonist PTZ. PTZ induced dramatic, lethal seizure in PTENK13R, D384V mice. Spontaneous seizure has been observed in brain-specific PTEN knockout mice and human patients with PTEN mutations (26, 33). Therefore, it appears that defects in both nuclear and membrane PTEN contribute to seizure susceptibility. It would be interesting to analyze seizure phenotypes in mice where the recruitment of PTEN to the plasma membrane is selectively inhibited to define specific mechanisms of this PTEN function to seizure.
Although the amounts of PTEN in the nucleus are significantly decreased in PTENK13R, D384V mice, these mice are not completely devoid of PTEN in the nucleus. We also noticed that the extent of decreases in nuclear PTEN levels varies depending on neuron types. Therefore, it is likely that multiple mechanisms recruit and maintain PTEN in the nucleus in addition to ubiquitination of lysine 13. These mechanisms may be cell type specific. Additional physiological functions of nuclear PTEN would be revealed if one could further decrease the amount of PTEN in the nucleus by simultaneously targeting such multiple mechanisms underlying the nuclear localization of PTEN.
In summary, our findings advance the current understanding of the function of nuclear PTEN in vivo. Although human diseases associated with PTEN deficiency are complex because of the multiple localizations of PTEN in cells, dissecting PTEN functions by blocking each PTEN localization would provide insights into the underlying disease mechanisms. In future studies, our new mouse model will enable us to further define the role of PTEN in the nucleus.
Experimental procedures
Generation of PTENK13R, D384V mice using CRISPR/Cas9
All of the work with animals was conducted according to the guidelines established by the Johns Hopkins University Committee on Animal Care and Use. To engineer the PTEN gene in mice, sgRNA-encoding sequences (5′-AGATCGTTAGCAGAAACAAA-3′ to target Lys-13 and 5′-ATTCTCTGGATCAGAGTCAG-3′ to target the C-terminal region) were cloned into the BbsI site of pX330+T7 and amplified from pX330+T7 with a leading T7 promoter by PCR. These sgRNAs were in vitro transcribed using the HiScribe T7 Quick High Yield RNA Synthesis Kit (New England Biolabs) and purified using the MEGAclear Kit (Ambion). Cas9 mRNA was in vitro transcribed using NotI-linearized pX330+T7 and the mMESSAGE mMACHINE T7 Ultra Kit (Ambion), and purified by LiCl precipitation. The homology-directed repair oligos (5′-TTCTTCAGCCACAGGCTCCCAGACATGACAGCCATCATCAAAGAGATCGTTAGCAGAAACAGAAGGAGATATCAAGAGGATGGATTCGACTTAGACTTGACCTGTATCCATTTCTGCGGCTGT-3′ for Lys-13 and 5′-ATCAGACTTTTGTAATTTGTGAATGCTGATCTTCATCAAAAGGTTCATTCTCTGGATCAGCGTCAGCGGCGTCAGCATATCTATAATGATCAGGTTCATTGTCACTAACATCTGGAGTCACAGAAGTTGAACTGCT-3′ for the C-terminal region) were purchased from Integrated DNA Technologies (4 nm ultramer). Pronuclear injections of zygotes from B6SJLF1/J mice (The Jackson Laboratory, stock no. 100012) were performed at the Johns Hopkins University Transgenic Facility using a mix of Cas9 mRNA, two sgRNA, and two homology-directed repair oligos in injection buffer (10 mm Tris-HCl, 0.1 mm EDTA filtered with 0.2-μm pore size). Two combinations of concentrations were used: 100 ng/μl Cas9 mRNA, 50 ng/μl each sgRNA, 100 ng/μl each repair oligo and 25 ng/μl Cas9 mRNA, 12.5 ng/μl each sgRNA, 25 ng/μl each repair oligo. The embryos were cultured at 37 °C in the CO2 incubator for 2 h and then transferred into the oviducts of pseudopregnant ICR females (25 embryos per mouse) (Envigo). Twenty-two pups were obtained, and their genotypes were analyzed by DNA sequencing using the following primers: 5′-GCCAAGTCCAGAGCCATTTC-3′ and 5′-CGATCTAGAAATGCGCCCAG-3′ for K13R and 5′-GAAAAGCAGTGCCCTTCAGA-3′ and 5′-GCAGTGCCCTTCAGAATTCA-3′ for the C-terminal region. We identified one founder mouse that carried mutations at both the Lys-13 and the C-terminal region (K13R, D384V). This line was backcrossed to C57BL/6J WT mice (The Jackson Laboratory, stock no. 000664) multiple times before use.
Histology and immunofluorescence microscopy
Mice were anesthetized by intraperitoneal injection of Avertin (200 mg/kg) and fixed by cardiac perfusion of ice-cold 4% paraformaldehyde in PBS (40–50 ml), as previously described (37, 38). The brains were dissected and further fixed in 4% paraformaldehyde in PBS for 2 h at 4 °C. The samples were further incubated in PBS containing 30% sucrose overnight and frozen in O.C.T. compound (Fisher Scientific, 23–730-571) in a Tissue-Tek Cryomold. Frozen tissue blocks were sectioned using a cryostat (Leica, CM 3050S, Nussloch, Germany) and mounted on Superfrost Plus Microscope Slides (Fisher Scientific, 12–550-15).
For histology, frozen sections were H&E stained at Johns Hopkins School of Medicine Pathology Core. The samples were observed using a microscope (Olympus, model BX51) equipped with a DP-70 color camera and 10× (0.3 numerical aperture) UIS2 objectives.
For immunofluorescence microscopy, sections were incubated with antibodies to Car8 (1:500, Frontier Institute, Car8-Go-Af780–1), NeuN (1:200, Proteintech, 26975–1-AP), Aldh1L1 (1:100, EMD Millipore, MABN495), GFAP (1:200, Sigma, G3893), and PTEN (1:100; Cell Signaling Technology, Danvers, MA; 9559) at 4 °C overnight. After washing with PBS, the samples were incubated with fluorescently labeled secondary antibodies at room temperature for 1 h. DAPI was used at 1 μg/ml. Samples were viewed by Zeiss LSM780 confocal scanning microscope equipped with 10× or 63× objectives. The nuclear and cytosolic fluorescent intensity was averaged from three different positions in each neuron. Quantification of the fluorescent signals was performed using NIH ImageJ software.
Statistical analysis
The Student's t test was used to compare PTENK13R, D384V and littermate control mice in all of the experiments.
Western blotting
The cerebellum, cortex, and hippocampus were harvested from mice, flash frozen in liquid nitrogen, and homogenized in RIPA buffer (Cell Signaling Technology) containing phosphatase inhibitor mixtures 2 and 3 (Sigma, P5726 and P0044). Lysates were centrifuged at 14,000 × g for 10 min, and the supernatants were collected. Protein concentrations were determined using a Bio-Rad protein assay. Proteins were separated by SDS-PAGE and transferred onto Immobilon-FL (EMD Millipore, Billerica, MA). After blocking in 3% BSA/PBS/Tween 20 for 1 h at room temperature, the blots were incubated with primary antibodies: PTEN (Cell Signaling Technology; 9559), phospho-PTEN (Ser-380/Thr-382/383; Cell Signaling Technology; 9549), phospho-PTEN (Ser-380; Cell Signaling Technology; 9551), phospho-PTEN (Ser-385; EMD Millipore; 07-890-I), AKT (Cell Signaling Technology; 9272), phospho-AKT (Ser-473; Cell Signaling Technology; 4060), phospho-AKT (Thr-308; Cell Signaling Technology; 13038), phospho-Foxo1 (Ser-256; Cell Signaling Technology; 9461), phospho-S6 (Ser-240/244; Cell Signaling Technology; 5364), and GAPDH (Thermo Fisher; MA5-15738). Immunocomplexes were visualized using a PharosFX Plus Molecular Imager (Bio-Rad) with fluorescently labeled secondary antibodies. Band intensity was determined using NIH ImageJ software (49).
Author contributions
A. I., K. I., H. S., and M. I. conceptualization; A. I. formal analysis; A. I., K. I., T. Y., Y. A., T. K., and D. M. investigation; A. I. visualization; A. I., K. I., T. Y., Y. A., and D. M. methodology; A. I., K. I., H. S., and M. I. writing-original draft; H. S. and M. I. supervision; H. S. and M. I. funding acquisition; H. S. and M. I. project administration.
Supplementary Material
Acknowledgments
We thank members of the Iijima and Sesaki labs for helpful discussions.
This work was supported by National Institutes of Health Grants GM084015 (to M. I.) and GM123266 (to H. S.) and the Allegheny Health Network–Sidney Kimmel Comprehensive Cancer Center (to M. I. and H. S.). The authors declare that they have no conflicts of interest with the contents of this article. The content is solely the responsibility of the authors and does not necessarily represent the official views of the National Institutes of Health.
This article contains Figs. S1 and S2.
- PTEN
- phosphatase and tensin homolog
- PIP3
- phosphatidylinositol (3,4,5)-triphosphate
- PI
- phosphatidylinositide
- PCs
- Purkinje cells
- PTZ
- pentylenetetrazol
- sgRNA
- single guide RNA.
References
- 1. Endersby, R., and Baker, S. J. (2008) PTEN signaling in brain: Neuropathology and tumorigenesis. Oncogene 27, 5416–5430 10.1038/onc.2008.239 [DOI] [PubMed] [Google Scholar]
- 2. Song, M. S., Salmena, L., and Pandolfi, P. P. (2012) The functions and regulation of the PTEN tumour suppressor. Nat. Rev. Mol. Cell Biol. 13, 283–296 10.1038/nrm3330 [DOI] [PubMed] [Google Scholar]
- 3. Fruman, D. A., Chiu, H., Hopkins, B. D., Bagrodia, S., Cantley, L. C., and Abraham, R. T. (2017) The PI3K pathway in human disease. Cell 170, 605–635 10.1016/j.cell.2017.07.029 [DOI] [PMC free article] [PubMed] [Google Scholar]
- 4. Zhou, J., and Parada, L. F. (2012) PTEN signaling in autism spectrum disorders. Curr. Opin. Neurobiol. 22, 873–879 10.1016/j.conb.2012.05.004 [DOI] [PubMed] [Google Scholar]
- 5. Pilarski, R., Burt, R., Kohlman, W., Pho, L., Shannon, K. M., and Swisher, E. (2013) Cowden syndrome and the PTEN hamartoma tumor syndrome: Systematic review and revised diagnostic criteria. J. Natl. Cancer Inst. 105, 1607–1616 10.1093/jnci/djt277 [DOI] [PubMed] [Google Scholar]
- 6. Hobert, J. A., and Eng, C. (2009) PTEN hamartoma tumor syndrome: An overview. Genet. Med. 11, 687–694 10.1097/GIM.0b013e3181ac9aea [DOI] [PubMed] [Google Scholar]
- 7. Planchon, S. M., Waite, K. A., and Eng, C. (2008) The nuclear affairs of PTEN. J. Cell Sci. 121, 249–253 10.1242/jcs.022459 [DOI] [PubMed] [Google Scholar]
- 8. Gil, A., Andrés-Pons, A., and Pulido, R. (2007) Nuclear PTEN: A tale of many tails. Cell Death Differ. 14, 395–399 10.1038/sj.cdd.4402073 [DOI] [PubMed] [Google Scholar]
- 9. Baker, S. J. (2007) PTEN enters the nuclear age. Cell 128, 25–28 10.1016/j.cell.2006.12.023 [DOI] [PubMed] [Google Scholar]
- 10. Leslie, N. R., Kriplani, N., Hermida, M. A., Alvarez-Garcia, V., and Wise, H. M. (2016) The PTEN protein: Cellular localization and post-translational regulation. Biochem. Soc. Trans. 44, 273–278 10.1042/BST20150224 [DOI] [PubMed] [Google Scholar]
- 11. Kreis, P., Leondaritis, G., Lieberam, I., and Eickholt, B. J. (2014) Subcellular targeting and dynamic regulation of PTEN: Implications for neuronal cells and neurological disorders. Front. Mol. Neurosci. 7, 23 10.3389/fnmol.2014.00023 [DOI] [PMC free article] [PubMed] [Google Scholar]
- 12. Chalhoub, N., and Baker, S. J. (2009) PTEN and the PI3-kinase pathway in cancer. Annu. Rev. Pathol. 4, 127–150 10.1146/annurev.pathol.4.110807.092311 [DOI] [PMC free article] [PubMed] [Google Scholar]
- 13. Iijima, M., and Devreotes, P. (2002) Tumor suppressor PTEN mediates sensing of chemoattractant gradients. Cell 109, 599–610 10.1016/S0092-8674(02)00745-6 [DOI] [PubMed] [Google Scholar]
- 14. Iijima, M., Huang, Y. E., and Devreotes, P. (2002) Temporal and spatial regulation of chemotaxis. Dev. Cell 3, 469–478 10.1016/S1534-5807(02)00292-7 [DOI] [PubMed] [Google Scholar]
- 15. Bassi, C., Ho, J., Srikumar, T., Dowling, R. J., Gorrini, C., Miller, S. J., Mak, T. W., Neel, B. G., Raught, B., and Stambolic, V. (2013) Nuclear PTEN controls DNA repair and sensitivity to genotoxic stress. Science 341, 395–399 10.1126/science.1236188 [DOI] [PMC free article] [PubMed] [Google Scholar]
- 16. Song, M. S., Carracedo, A., Salmena, L., Song, S. J., Egia, A., Malumbres, M., and Pandolfi, P. P. (2011) Nuclear PTEN regulates the APC-CDH1 tumor-suppressive complex in a phosphatase-independent manner. Cell 144, 187–199 10.1016/j.cell.2010.12.020 [DOI] [PMC free article] [PubMed] [Google Scholar]
- 17. Chung, J. H., Ostrowski, M. C., Romigh, T., Minaguchi, T., Waite, K. A., and Eng, C. (2006) The ERK1/2 pathway modulates nuclear PTEN-mediated cell cycle arrest by cyclin D1 transcriptional regulation. Hum. Mol. Genet. 15, 2553–2559 10.1093/hmg/ddl177 [DOI] [PubMed] [Google Scholar]
- 18. Shen, W. H., Balajee, A. S., Wang, J., Wu, H., Eng, C., Pandolfi, P. P., and Yin, Y. (2007) Essential role for nuclear PTEN in maintaining chromosomal integrity. Cell 128, 157–170 10.1016/j.cell.2006.11.042 [DOI] [PubMed] [Google Scholar]
- 19. Lindsay, Y., McCoull, D., Davidson, L., Leslie, N. R., Fairservice, A., Gray, A., Lucocq, J., and Downes, C. P. (2006) Localization of agonist-sensitive PtdIns(3,4,5)P3 reveals a nuclear pool that is insensitive to PTEN expression. J. Cell Sci. 119, 5160–5168 10.1242/jcs.000133 [DOI] [PubMed] [Google Scholar]
- 20. Freeman, D. J., Li, A. G., Wei, G., Li, H. H., Kertesz, N., Lesche, R., Whale, A. D., Martinez-Diaz, H., Rozengurt, N., Cardiff, R. D., Liu, X., and Wu, H. (2003) PTEN tumor suppressor regulates p53 protein levels and activity through phosphatase-dependent and -independent mechanisms. Cancer Cell 3, 117–130 10.1016/S1535-6108(03)00021-7 [DOI] [PubMed] [Google Scholar]
- 21. Moncalero, V. L., Costanzo, R. V., Perandones, C., and Radrizzani, M. (2011) Different conformations of phosphatase and tensin homolog, deleted on chromosome 10 (PTEN) protein within the nucleus and cytoplasm of neurons. PLoS One 6, e18857 10.1371/journal.pone.0018857 [DOI] [PMC free article] [PubMed] [Google Scholar]
- 22. Veleva-Rotse, B. O., and Barnes, A. P. (2014) Brain patterning perturbations following PTEN loss. Front. Mol. Neurosci. 7, 35 10.3389/fnmol.2014.00035 [DOI] [PMC free article] [PubMed] [Google Scholar]
- 23. Song, M. S., Salmena, L., Carracedo, A., Egia, A., Lo-Coco, F., Teruya-Feldstein, J., and Pandolfi, P. P. (2008) The deubiquitinylation and localization of PTEN are regulated by a HAUSP-PML network. Nature 455, 813–817 10.1038/nature07290 [DOI] [PMC free article] [PubMed] [Google Scholar]
- 24. Trotman, L. C., Wang, X., Alimonti, A., Chen, Z., Teruya-Feldstein, J., Yang, H., Pavletich, N. P., Carver, B. S., Cordon-Cardo, C., Erdjument-Bromage, H., Tempst, P., Chi, S. G., Kim, H. J., Misteli, T., Jiang, X., and Pandolfi, P. P. (2007) Ubiquitination regulates PTEN nuclear import and tumor suppression. Cell 128, 141–156 10.1016/j.cell.2006.11.040 [DOI] [PMC free article] [PubMed] [Google Scholar]
- 25. Nguyen, H. N., Yang, J. M., Miyamoto, T., Itoh, K., Rho, E., Zhang, Q., Inoue, T., Devreotes, P. N., Sesaki, H., and Iijima, M. (2015) Opening the conformation is a master switch for the dual localization and phosphatase activity of PTEN. Sci. Rep. 5, 12600 10.1038/srep12600 [DOI] [PMC free article] [PubMed] [Google Scholar]
- 26. Backman, S. A., Stambolic, V., Suzuki, A., Haight, J., Elia, A., Pretorius, J., Tsao, M. S., Shannon, P., Bolon, B., Ivy, G. O., and Mak, T. W. (2001) Deletion of Pten in mouse brain causes seizures, ataxia and defects in soma size resembling Lhermitte-Duclos disease. Nat. Genet. 29, 396–403 10.1038/ng782 [DOI] [PubMed] [Google Scholar]
- 27. Knobbe, C. B., Lapin, V., Suzuki, A., and Mak, T. W. (2008) The roles of PTEN in development, physiology and tumorigenesis in mouse models: A tissue-by-tissue survey. Oncogene 27, 5398–5415 10.1038/onc.2008.238 [DOI] [PubMed] [Google Scholar]
- 28. Kwon, C. H., Luikart, B. W., Powell, C. M., Zhou, J., Matheny, S. A., Zhang, W., Li, Y., Baker, S. J., and Parada, L. F. (2006) Pten regulates neuronal arborization and social interaction in mice. Neuron 50, 377–388 10.1016/j.neuron.2006.03.023 [DOI] [PMC free article] [PubMed] [Google Scholar]
- 29. Nguyen, H. N., Afkari, Y., Senoo, H., Sesaki, H., Devreotes, P. N., and Iijima, M. (2014) Mechanism of human PTEN localization revealed by heterologous expression in Dictyostelium. Oncogene 33, 5688–5696 10.1038/onc.2013.507 [DOI] [PMC free article] [PubMed] [Google Scholar]
- 30. Nguyen, H.-N., Yang, J.-M., Afkari, Y., Park, B. H., Sesaki, H., Devreotes, P. N., and Iijima, M. (2014) Engineering ePTEN, an enhanced PTEN with increased tumor suppressor activities. Proc. Natl. Acad. Sci. U.S.A. 111, E2684–E2693 10.1073/pnas.1409433111 [DOI] [PMC free article] [PubMed] [Google Scholar]
- 31. Nguyen, H. N., Yang, J. M., Jr, Rahdar, M., Keniry, M., Swaney, K. F., Parsons, R., Park, B. H., Sesaki, H., Devreotes, P. N., and Iijima, M. (2015) A new class of cancer-associated PTEN mutations defined by membrane translocation defects. Oncogene 34, 3737–3743 10.1038/onc.2014.293 [DOI] [PMC free article] [PubMed] [Google Scholar]
- 32. Yang, J.-M., Schiapparelli, P., Nguyen, H., Igarashi, A., Zhang, Q., Abbadi, S., Amzel, L., Sesaki, H., Quiñones-Hinojosa, A., and Iijima, M. (2017) Characterization of PTEN mutations in brain cancer reveals that pten mono-ubiquitination promotes protein stability and nuclear localization. Oncogene 36, 3673–3685 10.1038/onc.2016.493 [DOI] [PMC free article] [PubMed] [Google Scholar]
- 33. Kwon, C. H., Zhu, X., Zhang, J., Knoop, L. L., Tharp, R., Smeyne, R. J., Eberhart, C. G., Burger, P. C., and Baker, S. J. (2001) Pten regulates neuronal soma size: A mouse model of Lhermitte-Duclos disease. Nat. Genet. 29, 404–411 10.1038/ng781 [DOI] [PubMed] [Google Scholar]
- 34. Groszer, M., Erickson, R., Scripture-Adams, D. D., Dougherty, J. D., Le Belle, J., Zack, J. A., Geschwind, D. H., Liu, X., Kornblum, H. I., and Wu, H. (2006) PTEN negatively regulates neural stem cell self-renewal by modulating G0-G1 cell cycle entry. Proc. Natl. Acad. Sci. U.S.A. 103, 111–116 10.1073/pnas.0509939103 [DOI] [PMC free article] [PubMed] [Google Scholar]
- 35. Cupolillo, D., Hoxha, E., Faralli, A., De Luca, A., Rossi, F., Tempia, F., and Carulli, D. (2016) Autistic-like traits and cerebellar dysfunction in Purkinje cell PTEN knock-out mice. Neuropsychopharmacology 41, 1457–1466 10.1038/npp.2015.339 [DOI] [PMC free article] [PubMed] [Google Scholar]
- 36. Marino, S., Krimpenfort, P., Leung, C., van der Korput, H. A., Trapman, J., Camenisch, I., Berns, A., and Brandner, S. (2002) PTEN is essential for cell migration but not for fate determination and tumourigenesis in the cerebellum. Development 129, 3513–3522 [DOI] [PubMed] [Google Scholar]
- 37. Yamada, T., Adachi, Y., Fukaya, M., Iijima, M., and Sesaki, H. (2016) Dynamin-related protein 1 deficiency leads to receptor-interacting protein kinase 3–mediated necroptotic neurodegeneration. Am. J. Pathol. 186, 2798–2802 10.1016/j.ajpath.2016.06.025 [DOI] [PMC free article] [PubMed] [Google Scholar]
- 38. Kageyama, Y., Hoshijima, M., Seo, K., Bedja, D., Sysa-Shah, P., Andrabi, S. A., Chen, W., Höke, A., Dawson, V. L., Dawson, T. M., Gabrielson, K., Kass, D.A., Iijima, M., and Sesaki, H. (2014) Parkin-independent mitophagy requires Drp1 and maintains the integrity of mammalian heart and brain. EMBO J. 33, 2798–2813 10.15252/embj.201488658 [DOI] [PMC free article] [PubMed] [Google Scholar]
- 39. Sarnat, H. B. (2015) Immunocytochemical markers of neuronal maturation in human diagnostic neuropathology. Cell Tissue Res. 359, 279–294 10.1007/s00441-014-1988-4 [DOI] [PubMed] [Google Scholar]
- 40. Zhang, Y., and Barres, B. A. (2010) Astrocyte heterogeneity: An underappreciated topic in neurobiology. Curr. Opin. Neurobiol. 20, 588–594 10.1016/j.conb.2010.06.005 [DOI] [PubMed] [Google Scholar]
- 41. Ben Haim, L., and Rowitch, D. H. (2017) Functional diversity of astrocytes in neural circuit regulation. Nat. Rev. Neurosci. 18, 31–41 10.1038/nrn.2016.159 [DOI] [PubMed] [Google Scholar]
- 42. Löscher, W., Klitgaard, H., Twyman, R. E., and Schmidt, D. (2013) New avenues for anti-epileptic drug discovery and development. Nat. Rev. Drug Discov. 12, 757–776 10.1038/nrd4126 [DOI] [PubMed] [Google Scholar]
- 43. Dhir, A. (2012) Pentylenetetrazol (PTZ) kindling model of epilepsy. Curr. Protoc. Neurosci. 58, 37 10.1002/0471142301.ns0937s58 [DOI] [PubMed] [Google Scholar]
- 44. De Deyn, P. P., D'Hooge, R., Marescau, B., and Pei, Y. Q. (1992) Chemical models of epilepsy with some reference to their applicability in the development of anticonvulsants. Epilepsy Res. 12, 87–110 10.1016/0920-1211(92)90030-W [DOI] [PubMed] [Google Scholar]
- 45. Manning, B. D., and Toker, A. (2017) AKT/PKB Signaling: Navigating the network. Cell 169, 381–405 10.1016/j.cell.2017.04.001 [DOI] [PMC free article] [PubMed] [Google Scholar]
- 46. Nardella, C., Carracedo, A., Salmena, L., and Pandolfi, P. P. (2010) Faithfull modeling of PTEN loss driven diseases in the mouse. Curr. Top. Microbiol. Immunol. 347, 135–168 10.1007/82_2010_62 [DOI] [PubMed] [Google Scholar]
- 47. Hollander, M. C., Blumenthal, G. M., and Dennis, P. A. (2011) PTEN loss in the continuum of common cancers, rare syndromes and mouse models. Nat. Rev. Cancer 11, 289–301 10.1038/nrc3037 [DOI] [PMC free article] [PubMed] [Google Scholar]
- 48. Worby, C. A., and Dixon, J. E. (2014) PTEN. Annu. Rev. Biochem. 83, 641–669 10.1146/annurev-biochem-082411-113907 [DOI] [PubMed] [Google Scholar]
- 49. Adachi, Y., Itoh, K., Yamada, T., Cerveny, K. L., Suzuki, T. L., Macdonald, P., Frohman, M. A., Ramachandran, R., Iijima, M., and Sesaki, H. (2016) Coincident phosphatidic acid interaction restrains Drp1 in mitochondrial division. Mol. Cell 63, 1034–1043 10.1016/j.molcel.2016.08.013 [DOI] [PMC free article] [PubMed] [Google Scholar]
Associated Data
This section collects any data citations, data availability statements, or supplementary materials included in this article.


