

Abstract
Nicotine and alcohol are often co-abused. Adolescence is a vulnerable period for the initiation of both nicotine and alcohol use, which can lead to subsequent neurodevelopmental and behavioral alterations. It is possible that during this vulnerable period, use of one drug leads to neurobiological alterations that affect subsequent consumption of the other drug. The aim of the present study was to determine the effect of nicotine exposure during adolescence on ethanol intake, and the effect of these substances on brain gene expression. Forty-three adolescent female C57BL/6J mice were assigned to four groups. In the first phase of the experiment, adolescent mice (PND 36–41 days) were exposed to three bottles filled with water or nicotine (200 μg/ml) for 22 h a day and a single bottle of water 2 h a day for six days. In the second phase (PND 42–45 days), the 4-day Drinking-in-the-Dark paradigm consisting of access to 20% v/v ethanol or water for 2h or 4h (the last day) was overlaid during the time when the mice did not have nicotine available. Ethanol consumption (g/kg) and blood ethanol concentrations (BEC, mg %) were measured on the final day and whole brains including the cerebellum, were dissected for RNA sequencing. Differentially expressed genes (DEG) were detected with CuffDiff and gene networks were built using WGCNA. Prior nicotine exposure increased ethanol consumption and resulting BEC. Significant DEG and biological pathways found in the group exposed to both nicotine and ethanol included genes important in stress-related neuropeptide signaling, hypothalamic–pituitary–adrenal (HPA) axis activity, glutamate release, GABA signaling, and dopamine release. These results replicate our earlier findings that nicotine exposure during adolescence increases ethanol consumption and extends this work by examining gene expression differences which could mediate these behavioral effects.
1. Introduction
Nicotine and ethanol are often used concomitantly. Smoking rates among alcoholics are estimated to be higher than in the general population (around 80% vs. 34%) and the prevalence of alcoholism in the United States has been calculated to be 10 times higher in smokers than among non-smokers [1,2]. Adolescence is a vulnerable period for the onset of nicotine and ethanol use [3–5], with evidence linking the risk of smoking during this period with subsequent development of alcohol abuse and dependence [6–8]. Additionally, sex differences have been reported, suggesting a stronger association between concurrent smoking and alcohol use disorders (AUDs) among females as compared to males [9–12]. Because the majority of smokers begin smoking during adolescence [13], these findings suggest that adolescent females may be especially vulnerable to negative consequences of early alcohol and tobacco use.
Nicotine exposure during adolescence has unique effects on the developing brain. Exposure to nicotine during this period produces long-term alterations in developing structures such as the neocortex, hippocampus, and cerebellum [14]. Nicotine alters the function of these brain regions by inducing changes in dendritic spines and neuronal morphology, that are produced by alterations in transcriptional regulators of synapse maintenance [15]. These nicotine-induced neurobiological alterations can produce cognitive impairment, increase risk-taking behaviors [16], and increase risk of future depression [17] or anxiety [18]. These biological and behavioral alterations can predispose certain individuals to develop substance use disorders [19]. Therefore, it is crucial to examine the effects of adolescent nicotine exposure on physiological and behavioral outcomes. One such physiological response is changes in gene expression. These changes could alter normal developmental trajectories, increasing the risk of substance use later in life.
In animal models, age and sex-related differences in nicotine and ethanol consumption have been identified. Adolescent rodents show age-related differences in nicotine sensitivity, reward, tolerance, withdrawal, and nicotinic acetylcholine receptor (nAChRs) function compared to adults [20–23]. Further, adolescent female mice and rats consume more nicotine (adjusted for body weight) than do their male counterparts [24–26]. Moreover, adolescent female mice are more responsive to the rewarding effects of nicotine [27] and more susceptible to binge ethanol drinking compared to males [28,29].
Previous studies have shown that nicotine exposure increases ethanol self-administration in rodents [30,31]. One proposed mechanism by which nicotine increases ethanol self-administration is via the release of stress hormones [32–33]. Nicotine activates the stress-responsive neuroendocrine system (i.e. hypothalamic–pituitary–adrenal (HPA)) and, consequently, induces glucocorticoid release [32]. In adult rodents, glucocorticoids reduce ethanol-induced dopamine signaling through enhancement of GABAergic inhibition on dopamine (DA) neurons in the ventral tegmental area (VTA) [31,34,35]. Further, blunted DA levels have been associated with increased susceptibility to drug and ethanol use [36]. Ethanol can also potentiate GABAA, nACh, and 5-HT3 receptor function, and inhibit the function of glutamatergic receptors [37]. However, these studies in adult animals have focused on either nicotine or ethanol’s specific mechanisms of action rather than the effects of these substances on adolescent brain development and their link to later drug behaviors.
The effect of adolescent nicotine exposure on brain gene expression and ethanol consumption are poorly understood. The aim of this study was to determine the effect of nicotine exposure on ethanol consumption and resulting gene expression in female adolescent C57BL/6J mice. Our findings reveal that nicotine exposure increases ethanol consumption and blood ethanol concentrations (BEC) in female adolescent mice compared to nicotine-naïve animals. Significant differentially expressed genes (DEG) and biological pathways after nicotine and/or ethanol administration were associated with neuropeptide, HPA axis activity, neurogenesis, glutamatergic and GABAergic neurotransmission, and DA release. Our results allow us to hypothesize that nicotine exposure alters stress-related neuroendocrine and reward-associated neurotransmitter systems, which may mediate enhanced ethanol consumption, however, future work is required to test this.
2. Materials and methods
2.1. Animals
Forty-three adolescent (PND 28) female C57BL/6J mice were purchased from The Jackson Laboratory, Bar Harbor, ME. Only female mice were tested due to reported differences in nicotine consumption and ethanol effects observed between sexes [26,38–40]. Mice were singly housed in standard sized Plexiglas cages with bedding (Bed-o’Cobs, The Anderson Agriservices, Inc. Maume, OH) in a temperature-controlled room (20.3°C ± 0.8). Animals were housed on a 12-hour reversed light/dark cycle (lights off at 1000 h). Mice had ad libitum food (Lab Rodent Diet 5001, PMI Nutrition International, Inc., Brentwood, MO) throughout the experiment. All procedures were approved by the Pennsylvania State University Institutional Animal Care and Use Committee (Protocol Number: 45610).
2.2. Behavioral paradigm
2.2.1. Baseline
During the baseline period (PND 33–35; Fig 1), mice had 24 h access to tap water in a single drinking bottle. Body weight and fluid consumption were measured daily.
Fig 1. Experimental timeline.

2.2.2. Nicotine treatment
Mice were randomly assigned into four groups: Water-Water (WW), Water-Ethanol (WE), Nicotine-Water (NW), or Nicotine-Ethanol (NE). A WW and NW group were included to control for the effects of nicotine on overall thirst. There were 10–12 mice per group. During the first six days of the experiment, mice were exposed to 3 glass drinking bottles filled with water or nicotine for 22 h a day, and a single water bottle for 2 h each day (Fig 1). For the WW and WE groups, all 3 bottles were filled with tap water. For the NW and NE groups, all 3 bottles were filled with 200 μg/ml (−)-nicotine freebase (Sigma–Aldrich, St. Louis, MO) dissolved in tap water. This concentration of nicotine was chosen because it is voluntary consumed by adolescent mice without adverse effects [25,41,42] and replicates our prior work [35]. Bottles were placed on the cages at 1500 h and were removed and replaced with the single water bottle at 1300 h the next day. The three bottles were read and nicotine consumption (mg/kg) was calculated for each mouse. The 2 h single bottle was weighed and water consumption (ml) was calculated. Leakage/evaporation was accounted for by tubes on control cages handled using the same protocol, but with no animal present. We subtracted the volume lost in control tubes from individual drinking values. These procedures continued throughout the experiment. However, during the last 4 days (PND 42–45) mice were exposed to ethanol via the drinking-in-the-dark (DID) protocol (see section 2.2.3).
2.2.3. Drinking-in-the-dark (DID) protocol
The DID protocol was performed as previously reported [40,43]. During experimental days (7–10) nicotine exposure continued as detailed above (22 h/day), however, at 1300 h, all 3 bottles (nicotine or water) were removed and replaced with a single 10 ml serological pipette fitted with a ball bearing drinking spout containing either ethanol or water. Ethanol was prepared from ethyl alcohol (200 proof; Koptec 200) diluted in tap water to produce a 20% v/v solution [43,44]. Mice had 2 h access to a single bottle of water or ethanol for three days (PND 42–44). On the final day (PND 45), mice had 4 h access to the ethanol bottle. Leakage/evaporation was accounted for by tubes on control cages as described above. At the end of the 4 h drinking session on the final day, blood samples were collected from the tail vein (10μl) and mice were sacrificed via cervical dislocation, whole brains including the cerebellum were dissected and placed into RNAlater® for subsequent RNA extraction.
2.3. Blood ethanol concentration (BEC) assessment
BEC were examined with an enzymatic assay [45–47]. This assay links the conversion of ethanol to acetaldehyde together with the conversion of NAD to NADH by the addition of alcohol dehydrogenase (ADH). NADH production was quantified with a spectrophotometer (340nm). Individual BEC values were determined using a standard curve run in parallel with the samples [47].
2.4. Statistical analysis of behavioral data
Nicotine, ethanol, and water consumption as well as BEC were dependent variables. Group and experimental day were used as independent factors. A repeated measure ANOVA was performed to analyze nicotine consumption throughout the experiment, followed by a Tukey’s post hoc test (day 6 was not analyzed because of missing data). Based on our previous results [35], a one-tailed t-test was conducted to analyze differences in BEC and ethanol consumption between groups with alpha set at 0.05 because we predicted that nicotine would increase ethanol consumption. These analyses were conducted in Statistical Program for Social Sciences (SPSS, Chicago, IL) or in R (version 3.2.2, R Core Team, 2015).
2.5. RNA extraction
RNA was extracted from a randomly selected subset of mice (16 total; 4 samples from each experimental group). Total RNA was extracted with an RNeasy® Midi Kit (QIAGEN, Valencia, CA). RNA quality was assessed using an Agilent 2100 BioAnalyzer™ (Agilent Technologies, Santa Clara, CA). RNA Integrity Number (RIN) was on average 8.23 ± 0.26 for all samples, suggesting high RNA integrity and quality [48].
2.6. Library preparation RNA-sequencing
An Illumina TruSeq® Stranded mRNA Library Prep Kit (Illumina, San Diego, CA) was used for cDNA library preparation following the manufacturers’ protocol [49]. An Agilent 2100 BioAnalyzerTM was used for library sizing, cDNA quantification, and quality measurement. Finally, libraries were sequenced using an Illumina HiSeq 2500 (Illumina, San Diego, CA). On average, 43 million, 150 base pair single end reads were generated for each sample and used in the analysis. Sequencing data are available from the NCBI GEO database (experimental series accession number: GSE115188).
2.7. Transcript assembly, quantification, and differential expression analysis
Trimmomatic was used to remove sequencing adapters and low-quality ends [50]. The cleaned dataset was analyzed with the Tuxedo pipeline. Subsequently, readings were mapped to the mouse reference genome (Ensembl GRCm38, mm10) using TopHat2 software (http://tophat.cbcb.umd.edu/). The ‘—library_type’ parameter was set to ‘fr-firststrand’. Default settings were preserved for all other TopHat2 parameters. The resulting alignments files from TopHat2 (average mapping rate of 87.4%) were used to generate a transcriptome assembly. Gene expression was calculated for each condition using the Cufflinks (http://cufflinks.cbcb.umd.edu/) and Cuffmerge utilities. Due to the relatively small sample size of each group (N = 4), Cuffdiff2 with default settings was used to identify transcripts that were differentially expressed between each treatment group compared to the water only control group. This analysis strategy was chosen based on a previous research with a similar research design [51]. The significance threshold was set at q < 0.05 (FDR corrected) [52]. Finally, a Fisher’s exact test was performed using the GeneOverlap R package to test the significance of DEG overlaps [53].
2.8. Weighted Gene Co-expression Network Analysis (WGCNA)
Gene co-expression networks were identified using the Weighted Gene Co-expression Network Analysis (WGCNA) package [54]. Briefly, genes were removed if at least one value of the sixteen samples had FPKM <1. The remaining genes were log-transformed using the Log2(X+1) function. Following this, 12,679 genes were used to build a co-expression similarity matrix based on Pearson correlations and transformed into a signed adjacency matrix using the soft thresholding power of β = 18 [54]. Genes were hierarchically clustered, signed gene networks were built using minModuleSize = 20, deepSplit = 4, and similar modules were merged using mergeCutHeight = 0.1. The resulting modules were assigned to arbitrary color names. To identify modules associated with the experimental conditions, one-way ANOVAs were performed using the module eigengene (ME) value for each of the resulting modules. Correction for multiple testing was applied using false discovery rate (FDR- adjusted q-value < 0.05). Finally, Tukey’s post hoc test was performed to identify significant differences between experimental groups and the WW group.
2.9. Functional enrichment
To obtain information about possible underlying biological processes pertinent to the study, the DEG and significant WGCNA module gene lists were uploaded to Ingenuity Pathway Analysis software (IPA; Ingenuity Systems, Inc, Redwood City, California, USA, http://www.ingenuity.com). Functional enrichment for pathways restricted to mouse nervous system were performed, and scores for upstream regulators, mechanistic networks, causal networks, and downstream effects were obtained [55]. Each IPA network is scored based on the fit of significant genes in each dataset using the Fisher exact test [56].
3. Results
3.1. Behavior
3.1.1. Nicotine phase
Analysis of nicotine consumption (mg/kg) across study days revealed a significant main effect of day (F 9,180 = 8.02, p<0.01; Fig 2). Post hoc analyses revealed a significant increase in nicotine consumption on days 2, 4, and 9 (all p<0.05) compared to day 1. No significant main effect or interactions with group were observed. No significant main effect of day, nicotine treatment, or day x nicotine treatment interaction were detected for the 2h water intake between days 1 to 5 in this experimental phase. Further, no significant differences in body weight were observed between groups.
Fig 2. Nicotine consumption increased after the first day but remained similar between groups.

Data shows 22 h nicotine consumption (mg/kg) for NW and NE mice on days 1 to 10. * represents significantly (p< 0.05) different than day 1.
3.1.2. Drinking in the dark (DID)
Mice with access to nicotine during adolescence consumed significantly more ethanol and had higher BEC than mice with access to water only (Fig 3). For this analysis, we focused on the 4-hour exposure of the last experimental day, commonly used as a measure of binge-like ethanol consumption [57–61]. Replicating our prior results [35], mice exposed to nicotine consumed significantly more ethanol (t 14 = 1.69, p<0.05; Fig 3A) and had significantly higher BEC (t 14 = 2.89, p<0.05; Fig 3B) than nicotine naïve mice. No significant differences were found in ethanol consumption on days 7–9 (Mean ± Standard Error of Mean; Day 7: WE = 0.34 ± 0.02, NE = 0.35 ± 0.03; Day 8: WE = 0.31 ± 0.03, NE = 0.35 ± 0.05; Day 9: WE = 0.41 ± 0.06, NE = 0.42 ± 0.06). Further, no significant differences in water consumption were detected between the WW and NW groups on the last day of the experiment (1.05 ± 0.20; 1.50 ± 0.21 respectively), nor were differences in body weight between groups observed.
Fig 3. Nicotine exposure during adolescence increases ethanol consumption and resulting BEC.
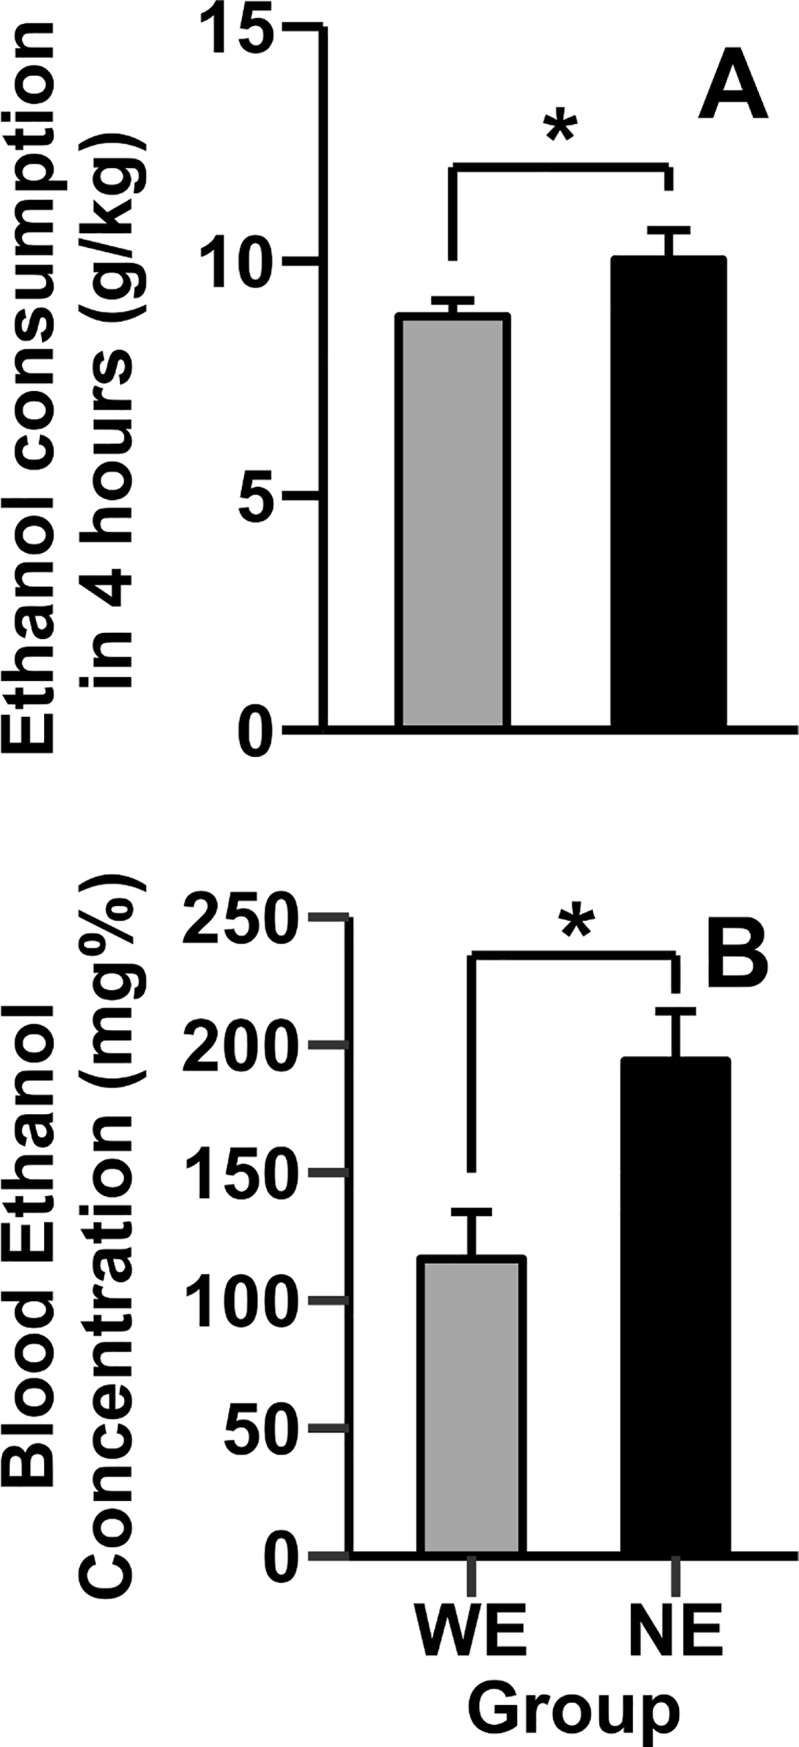
Data (mean ± SE) represents (A) 4h ethanol consumption (g/kg) on the final experimental day and (B) Blood Ethanol Concentration (BEC) in the WE and NE animals. * represents p<0.05.
3.2. Differentially expressed genes (DEG)
We examined DEG in each of the three drug treatments groups compared to the water only control group. Sixteen DEG were shared between the NW and WE groups, 17 DEG were shared between both groups exposed to nicotine, and 86 DEG overlapped between both groups exposed to ethanol (Fig 4). Twelve DEG were shared across all treatment groups. All overlapping DEG were significant (p<0.01).
Fig 4. The ethanol group showed the highest number of DEG compared to the nicotine only and nicotine-ethanol groups.

Venn diagram of differentially expressed genes (DEG) among three treatment groups compared to water only (FDR< 0.05) and their overlap. Sixteen DEG were shared between NW and WE groups, 17 DEG between NW and NE, and 86 DEG between WE and NE. Only 12 genes were shared among all treatment groups.
Exposure to only nicotine (NW) resulted in 99 DEG (Fig 4 and S1 Table) at FDR < 0.05, of which 84 were downregulated and 15 were upregulated. Expression changes ranged from a logarithmic fold change (LFC) of -4.38 to 3.90 (Fig 5). Among notable genes previously associated to nicotine consumption we found an upregulation of the Pro-opiomelanocortin (Pomc) gene which mediates the anorectic effects of nicotine through activation of acetylcholine receptors [62,63] and the vasopressin (Avp) gene, involved in the facilitation of stress-induced neuronal activation and regulation of hypothalamic adrenocorticotropic hormone (ACTH) release [64]. Additionally, we observed a downregulation of the Activity Regulated Cytoskeleton-Associated Protein (Arc) gene, Fos Proto-Oncogene (Fos) gene, and Nuclear Receptor Subfamily 4 Group A Member 1 (Nr4a1) gene. These genes have been previously associated with neurogenesis, cell proliferation, cell differentiation, and cell transformation [65–68].
Fig 5. Notable genes differentially expressed between the WW and NW group.

(A- C) The Arc, Fos, and Nr4a1 genes showed a downregulation in the NW group compared to the WW group. (D-E) Inversely, Avp and Pomc genes were upregulated in the NW group. (F) The log-fold change (LFC) values are presented in the Nicotine-Water table.
Using the NW DEG, IPA identified an enrichment of the corticotrophin releasing hormone signaling pathway (4 genes, p<0.05: Fig 6). Relevant upstream regulators included the Corticotropin-Releasing Hormone Receptor 1 (Crhr1), CAMP Responsive Element Binding Protein 1 (Creb1), Brain-Derived Neurotrophic Factor (Bdnf), and dopamine release such as Dopamine Receptor D2 (Drd2) (Table 1). These genes have been associated to nicotine exposure in prior studies [69–73].
Fig 6. IPA network shows the associations of genes affected by nicotine exposure in adolescent C57BL/6J mice.

This figure highlights genes enriched for the stress-related pathways: corticotrophin releasing hormone signaling and glucocorticoid receptor signaling (pink bold nodes corresponding to NW DEG and upstream regulators). This figure shows a direct effect of the upstream regulator gene Creb1 on Nr4a1, Bdnf, Fos, Arc, and Avp genes involved in neuroplasticity and stress response. Indirect relationships are indicated for Bdnf on Fos, Arc, and Pomc. Up (light red) and down (light green) regulated genes are shown. Direct (bold arrow) and indirect (dashed arrow) relationships are displayed. IPA functional categories are shown in node key.
Table 1. Upstream regulators of NW DEG identified by IPA.
| DEG Nicotine-Water: IPA functional over-representation | ||
|---|---|---|
| Upstream Regulators | p-value of overlap | Target molecules |
| Creb1 | 8.23E-08 | ↑ Avp, ↓ Arc, ↓ Fos, ↓ Egr2 |
| Drd2 | 1.15E-04 | ↑ Cshl1, ↑ Pomc, ↓ Fos |
| Bdnf | 4.05E-04 |
↑
Pomc, ↓
Fos, ↓
Arc, ↓
Cav2, ↓
Egr2, ↓ Nr4a1 |
| Crhr1 | 6.17E-03 | ↑ Avp |
This table contains the upstream regulators identified using IPA and their target molecules, corresponding to genes present in the list of DEG following nicotine treatment (↑ = upregulated; ↓ = downregulated).
Exposure to only ethanol (WE) resulted in 353 DEG (Fig 4 and S2 Table) of which 268 were downregulated and 85 were upregulated with an LFC ranging from -1.68 to 4.61. Notable DEG identified for the ethanol only group were associated with neurogenesis (FosB), voltage-gated ion channels (Kcnt1 and Kcnb2), immune system (Il16 and Il20rb), and glutamatergic neurotransmission (Grin2a, Grin2b and Grm3). We observed increased expression of the FBJ Murine Osteosarcoma Viral Oncogene Homolog B (FosB), the Potassium Sodium-Activated Channel Subfamily T Member 1 (Kcnt1), the Interleukin 16 (Il16), and Interleukin-20 receptor subunit beta precursor (Il20rb) genes, implicated in immune responses and cytokine signaling (Fig 7A–7D). There was decreased expression of the Subfamily B Member 2 (Kcnb2), Glutamate Metabotropic Receptor 3 (Grm3), Glutamate Ionotropic Receptor NMDA-Type Subunit 2A (Grin2a), and Subunit B (Grin2b) genes (Fig 7E–7H). These genes have been previously reported to be altered by ethanol exposure and involved in ethanol sensitivity [74–80].
Fig 7. Notable genes differentially expressed between the WW and WE groups.

(A-D) The Grin2b, Kcnb2, Grm3 and Grin2a genes were downregulated in the WE group compared to the WW group. (E-H) Il16, Kcnt1, FosB and Il20rb genes were upregulated in the WE group. (I) The log-fold change (LFC) values are presented in the Water-Ethanol table.
The WE DEG were enriched for pathways involved in hepatic stellate cell activation (10 genes, p<0.05) and intrinsic prothrombin activation (3 genes, p<0.05). Relevant upstream regulators for the WE group were Glutamate Metabotropic Receptor 2 (Grm2), Grin2a, Serum/Glucocorticoid-Regulated Kinase (Sgk1), Adenylate Cyclase Activating Polypeptide 1 (Adcyap1), Adenylate Cyclase 5 (Adcy5), and Bdnf (Table 2). These genes have been previously reported to be altered by ethanol [81–84].
Table 2. Upstream regulators of WE DEG identified by IPA.
| DEG Water- Ethanol: IPA functional over-representation | ||
|---|---|---|
| Upstream Regulators | Overlap p-value | Target molecules |
| Gmr2 | 1.22E-03 | ↓ Grin2a, ↓ Grm3 |
| Adcyap1 | 2.03E-03 | ↑ Col5a1 |
| Adcy5 | 3.96E03 | ↑ Adcy6, ↑ FosB |
| Sgk1 | 2.39E-03 | ↓ Grin2a, ↓ Grin2b |
| Bdnf | 2.70E-02 | ↓ Grin2a |
This table contains the upstream regulators identified by IPA and their target molecules, corresponding to genes differentially expressed following ethanol administration (↑ = upregulated; ↓ = downregulated).
Nicotine and ethanol exposure (NE) resulted in 122 DEG (Fig 4 and S3 Table), of which 46 genes were downregulated and 76 upregulated, with an LFC range of -2.44 to 1.40. There was an upregulation of relevant DEG previously implicated in both nicotine and ethanol consumption such as Avp [85–87] and the Metabotropic glutamate receptor 4 (Grm4) gene [33,74]. Additionally, the Solute Carrier Family 6 (Neurotransmitter Transporter, GABA) Member 13 (Slc6a13) gene was downregulated in this group (Fig 8).
Fig 8. Notable genes differentially expressed between the WW and NE groups.

(A-B) The Slc6a13 gene was downregulated in the NE group compared to the WW group. (C-D) Grm4, Irs2 and Avp genes were upregulated in the NE group. (E) The log-fold change (LFC) values are presented in the Nicotine-Ethanol table.
IPA of DEG from the NE group identified enrichment of dendritic cell maturation (6 genes, p<0.05) and synaptic long-term depression (4 genes, p<0.05) pathways. The upstream regulator genes had similar function to those identified for our nicotine only and ethanol only groups. These genes were associated with HPA-axis function such as Crhr1 and Corticotrophin Releasing Hormone Binding Protein (Crhbp). Moreover, they were implicated in transcription regulation including Transcription Factor 7 Like 2 (Tcf7l2), Neurogenic Locus Notch Homolog Protein 3 (Notch3), and Notch1. Finally, we observed upstream regulator genes associated with immune response such as Interleukin 10 (Il10) and oxidative deamination of dopamine, norepinephrine, and serotonin such as Monoamine Oxidase A (Maoa) gene (Table 3).
Table 3. Upstream regulators of NE DEG identified by IPA.
| DEG Nicotine- Ethanol: IPA functional over-representation | ||
|---|---|---|
| Upstream Regulators | Overlap p-value | Target molecules |
| Notch3 | 7.76E-03 | ↓ Fabp7 |
| Notch1 | 7.76E-03 | ↓ Fabp7 |
| Crhr1 | 7.76E-03 | ↑ Avp |
| Crhbp | 1.55E-02 | ↑ Avp |
| Tcf7l2 | 2.49E-02 | ↓ Mal |
| Maoa | 4.57E-02 | ↑ Avp |
| Il10 | 4.57E-02 | ↓ Mrc1 |
This table contains the upstream regulators identified by IPA and their target molecules, corresponding to genes differentially expressed after NE treatment (↑ = upregulated; ↓ = downregulated).
3.3. Weighted Gene Co-expressed Network Analysis (WGCNA)
All sixteen samples produced 140 modules in a single WGCNA analysis. The gray module contained 263 unassigned genes. The remaining 139 modules contained between 20 and 957 genes. To identify relevant modules, the ME was calculated for each experimental group. A one-way ANOVA with multiple testing correction (q<0.05) identified 15 modules significantly different between experimental conditions (S5 Table), containing between 23 and 741 genes (S6 Table). Tukey’s post hoc analysis revealed significant differences between specific groups for each module (S7 Table), with the majority of significant modules significantly different when comparing WE to WW.
Functional overrepresentation analysis using IPA found enrichment in our 15 significant modules (detailed information in S8–S22 Tables). Enriched functional pathways were associated with synaptic signaling (blue, palevioletred3, lightcyan, paleturquoise, darkred, steelblue, powderblue, darkgray, salmon and black module), immune response (lighcyan module), transcription and methylation (powederblue, black and antiquewhite1 module), amino acid biosynthesis (brown4 and antiquewhite4 module), prothrombin activation pathways (salmon module), and cell cycle regulation (salmon and black module).
There were three modules (Blue, Midnightblue and Darkred) containing genes previously associated with addiction and brain development that are described below. The Blue module, containing 741 genes was significantly different between groups (F(3,12) = 8.16, q<0.05). The post hoc analysis revealed that the NW group had less expression compared to the WW group (Fig 9A). This module contained genes such as Gamma-Aminobutyric Acid Type A Receptor Subunit Beta 2 and Alpha 1 (Gabrb2 and Gabra1), Serotonin 5-HT-2C Receptor (Htr2c), Voltage-Sensitive Potassium Channel (Kcnd2) and Insulin-Like Growth Factor 1 (Igf1). GABA signaling-related genes have been identified as susceptibility loci and genes for nicotine dependence and alcoholism [88]. Functional enrichment using IPA, revealed Ephrin receptor signaling (p = 0.0003), ERK/MAPK signaling (p = 0.001), TGF-β Signaling (p = 0.002) and, BMP signaling pathways (p = 0.002). The top network was enriched in genes associated with pathways involved in neuroinflammation, dopamine receptor signaling, and corticotrophin releasing hormone (Fig 10).
Fig 9. Nicotine, ethanol and their combination alter module eigengene expression values compared to controls (WW).
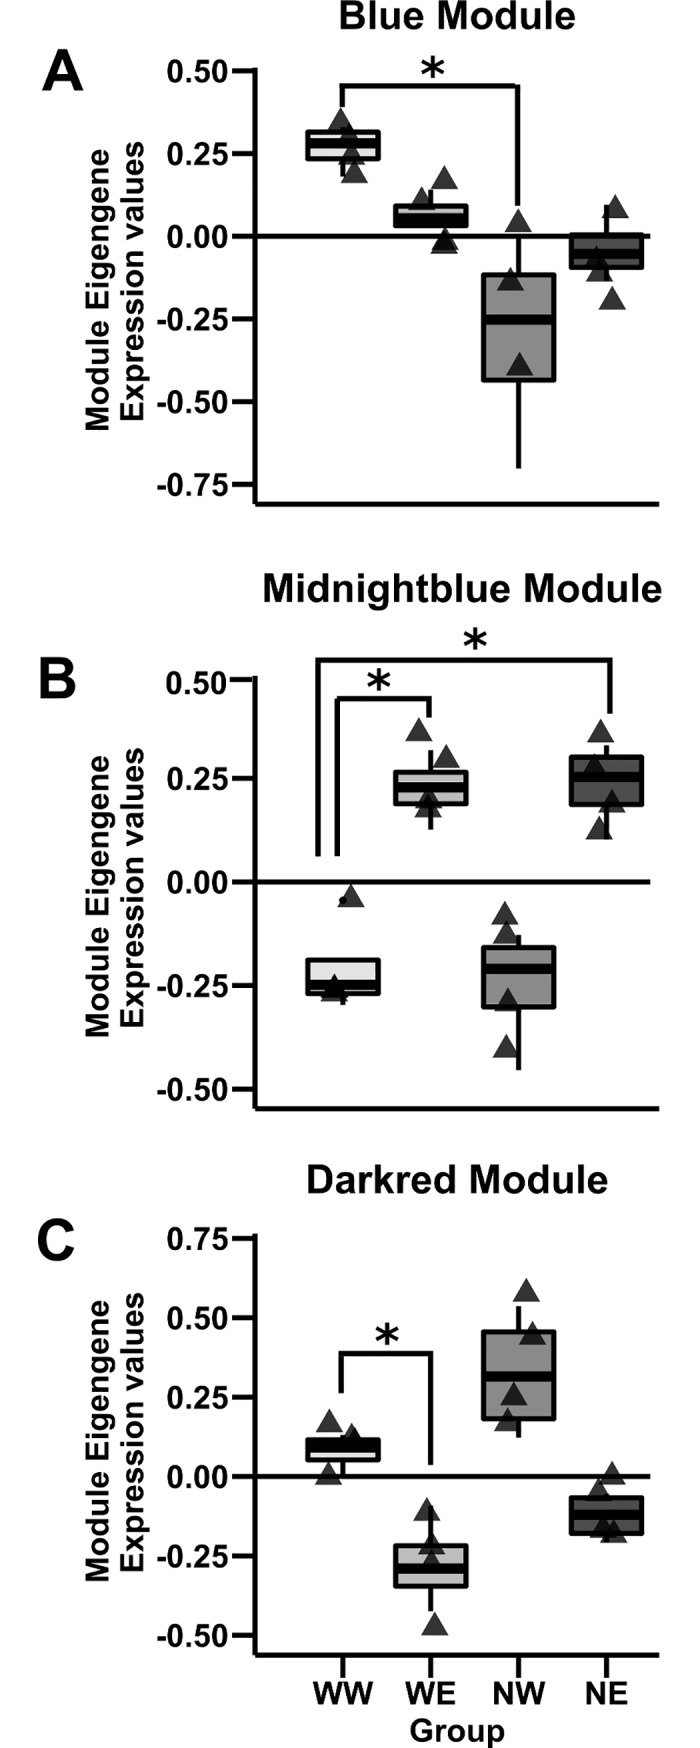
(A) The Blue module shows a significant decrease in module eigengene expression in the NW group compared to the WW group. (B) The Midnightblue module showed a significant increase in the module eigengene for the ethanol groups (WE and NE) compared to our control group. (C) The Darkred module showed a significant decrease in WE module eigengene value compare to the WW group. * = p<0.05.
Fig 10. IPA enrichment of Blue module network shows the relationships of genes involved in neuroinflammation, dopamine receptor signaling, and corticotrophin hormone release pathways.

This figure highlights genes (pink bold nodes) enriched for neuroinflammation signaling pathway (Bdnf, Gabra1, Gabra2, Tgfb1 and Tgfbr1), dopamine receptor signaling (Drd2 and Th), and corticotrophin releasing hormone pathway (Bdnf and Campk4). This figure shows as main nodes the Bdnf and Adcyap1 (PACAP) genes involved in neurogenesis and mediators of neuroendocrine stress responses, respectively. Indirect relationships of Bdfn are indicated for Campk4, Th and Drd2. Adcyap1 shows indirect association with Gabra1 on Gabra2 genes. Direct (bold arrow) and indirect (dashed arrow) relationships are displayed. IPA functional categories are shown in node key.
The Midnightblue module containing 168 genes, was significantly different between groups (F(3,12) = 22.53, q<0.05). Tukey’s post hoc test revealed an increase in gene expression in both of the ethanol groups (WE and NE) compared to our control group (WW) (Fig 9B). This module contained genes such FBJ Murine Osteosarcoma Viral Oncogene Homolog (Fosb) previously shown to be induced by ethanol exposure [80]. Sodium/potassium/calcium exchanger (Slc24a4) and Cysteine-Rich Angiogenic Inducer 61 (Cyr61) involved in cholinergic regulation of synaptic plasticity [89] were observed here. Furthermore, Adrenoceptor Alpha 1A (Adra1a) previously reported in animal models of addiction and considered to be directly involved in substance use and dependence [90, 91] was found in this module. Finally, we observed the Autism Susceptibility Candidate 2 (Auts2) gene reported to be associated to alcohol sensitivity [91]. IPA enrichment of functional groups for the Midnightblue module indicated apoptosis receptor signaling (p = 0.003) pathway.
Finally, the Darkred module containing 119 genes was significantly different between groups (F(3,12) = 16.22, q<0.05). Post hoc analysis revealed a decrease in WE module eigengene value compare to the WW group. Relevant genes contained in this module were the Glutamate Metabotropic Receptor 2 (Grm2) previously reported as a candidate gene in nicotine and ethanol exposure [92], RNA Polymerase I Subunit E (Polr1e), and G Protein Subunit Alpha O1 (Gnao1), which have both been shown to be altered by psychostimulants [93] (Fig 9C).
4. Discussion
The current study found that adolescent nicotine exposure alters later drug behavior and the expression of genes involved in glutamate and GABA neurotransmission, neuroplasticity, and the HPA-axis stress response. Our results replicate and extend previous findings, showing that nicotine exposure in adolescent C57BL/6J female mice increases binge-like ethanol consumption and resulting BEC compared to nicotine-naïve mice [35]. Furthermore, our transcriptome analyses suggest that nicotine and ethanol exposure results in alterations of brain neuroendocrine- (e.g. Avp, Pomc, and Crhr1), neuroplasticity- (e.g. Arc, Fos, FosB, Nr4a1 and Bdnf), and neurotransmitter-related (e.g. Drd2, Grin2a, Grin2b, Grm3, Grm4, and Kcnt1) genes. These findings contribute additional evidence on the role of nicotine-induced changes in stress hormone signaling and nicotine-induced neuroadaptations that may lead to increased ethanol self-administration [32]. Moreover, our WGCNA analysis allowed us to contextualize the effects of early nicotine or/and ethanol consumption on biological pathways associated to brain development and function. This research provides information about possible underlying transcriptional changes and biological mechanisms associated with nicotine and/or ethanol consumption during adolescence, that should be further examined.
We found that nicotine exposure increases binge-like ethanol consumption and BEC in female adolescent C57BL/6J mice. Further, no significant differences in water consumption were detected between the NW and WW groups, indicating that nicotine exposure does not globally increase thirst. Our results are consistent with previous studies that have reported a significant increase in ethanol consumption after nicotine exposure in adolescent C57BL/6J male [94,95] and female [35] mice, adult C57BL/6J mice [94], male rats [24,30–32,96–98], and human smokers [99]. While two studies did not find a relationship between nicotine consumption and ethanol intake [100,101], the preponderance of evidence suggests that this relationship exists. Our data provides further evidence for this association. One mechanism proposed to explain the increase in ethanol intake following nicotine exposure is stress-hormone signaling in the mesolimbic dopamine (DA) system. Corticosterone in response to nicotine has been shown to increase GABAergic inhibition onto VTA DA neurons leading to attenuated ethanol-induced DA signaling and augmented ethanol self-administration [32]. Gene expression results observed in this study are consistent with this hypothesis (see Conclusions section).
Genes influenced by nicotine exposure
Among humans, nicotine use usually begins during adolescence [102]. This developmental period represents a window of time where normal brain development occurs, which may be altered by nicotine exposure. Alterations to normal neuronal development can increase the risk of future drug use [32,87,103]. During this time, many systems undergo changes, including the mesocorticolimbic DA system [104] and the hypothalamic-pituitary-adrenal (HPA) axis [105].
Perturbations of HPA axis developmental trajectories may contribute to altered stress-reactivity [105]. Nicotine activates the HPA system which stimulates stress-related hormones [106], that can modulate synaptic transmission in the mesolimbic DA system [37]. Both the DA and HPA-axis have been linked to drug use and addiction [107]. Here we showed that nicotine exposure in C57BL/6J adolescent females increased the expression of genes involved in neurotransmission (Pomc) and in neuropeptide activity (Avp) relative to animals that had access to water; both genes linked to HPA axis activity. Further, Crhr1 gene was identified as upstream regulator of the NW DEG.
Our results are consistent with previous studies that have identified increased expression of these genes following nicotine exposure [87,108–110], but opposite results have also been reported [111,112]. For example, Pomc upregulation has been observed in the arcuate nucleus of the hypothalamus after chronic nicotine treatment [108,110]. However, a decrease or no effect in Pomc mRNA expression has been observed in the same brain region after chronic nicotine treatment [112,113] and acute nicotine treatment [111,112]. These discrepant findings may be explained by differences in the nicotine administration protocol. For example, in our experiment 200 μg/ml (−)nicotine was available in the drinking solution for ten days, compared to one-time [111] or daily [112] injections of nicotine utilized in the experiments reporting decreased Pomc expression. Further, we choose to examine whole brain gene expression, therefore it is possible that brain region-specific expression changes for the Pomc gene [114] were washed out. Finally, in this work we analyzed the brain transcriptome of C57BL/6J adolescent female mice; therefore, our results might not be comparable due to differences in species, sex or age of animal tested. In contrast to the mixed results with Pomc, Avp was upregulated in our nicotine treated animals, a finding that is consistent with previous literature [69,87,109]. Together these data suggest that nicotine alters HPA-axis activity through increases in Avp and Pomc gene expression, however the later seems to be susceptible to treatment protocol and/or brain region examined.
In addition to our results which demonstrate that nicotine alters genes associated with HPA axis activity, we also found that nicotine alters GABAergic transmission. Further, it has been reported that stress signaling alters GABAergic neurotransmission [103]. This is supported by the identification of the stress-related gene Crhr1 gene as upstream regulator and a decreased expression of relevant genes in the Blue module (Gabrb2 and Gabra1) in the NW group. Therefore, our findings contribute additional evidence to the hypothesis that nicotine utilizes neuroendocrine mechanisms to influence neurotransmitter activity [32,69].
We observed decreased Arc and Fos expression in the NW group relative to controls. These genes have been implicated in synaptic plasticity [115] and associated with addiction [113]. Our results are not consistent with previous research that has reported increased Arc and Fos expression in the prefrontal cortex (PFC) following an acute injection of nicotine in adolescent male rats [113] and rat pups [116]. It is possible that we observed a different pattern of gene expression due to the brain region studied. Particularly, Arc and Fos brain region expression depends on region-specific neuronal activation [117]. On the other hand, these gene expression patterns could be explained due to treatment protocol (i.e. chronic), or as a result of the 4h nicotine withdrawal on the final experimental day.
A possible explanatory mechanism to our results is that AMPA glutamate receptors activation have shown to negatively regulate Arc gene expression, through a mechanism involving a pertussis toxin-sensitive G proteins [118]. Interestingly, nicotine stabilizes ionotropic glutamate receptors leading to increased AMPA function in rats [119,120]. Thus, we could hypothesize that decreased Arc expression could be a result of nicotine increasing AMPA receptor function and resulting in decreased Arc expression. This negative feedback mechanism may only be apparent with chronic nicotine exposure. Further work measuring Arc gene expression after acute and chronic nicotine exposure is required to test this hypothesis.
Genes influenced by ethanol exposure
Mice that consumed only ethanol had more DEG compared to any other treatment group. The DEG found in this group were generally consistent with previous research that examined genes related to ethanol consumption and/or BEC in C57BL/6J mice utilizing DID. Importantly this consistency comes with many differences in study design. For example, we used female mice compared to male mice in previous work. Additionally, we used whole-brain samples while prior work focused on specific brain regions such as the hippocampus, striatum, cerebellum, frontal cortex [121,122], olfactory bulb, and VTA [123]. Even with these methodological differences overlap in DEG were observed and these genes (e.g. Cav2, Hbb-b1, Col6a1 and Col7a1) could represent key drivers of ethanol intake.
Among our notable results, the transcriptome results showed decreased expression of glutamate receptor genes such as Grm3 (encoding the metabotropic receptor subunit mGluR3), Grin2a, and Grin2b (NMDA type, encoding for GluN2A and GluN2B respectively) compared to controls. Glutamate is responsible for normal brain function during development [124] and has an important role in synaptic plasticity and excitatory synaptic neurotransmission [74]. Long-term exposure to ethanol alters the gene expression, the availability and function of glutamate receptors, and its transporters [125]. Further, impairment in glutamate homeostasis has been associated with alcohol tolerance, dependence, and relapse [75]. Our results are consistent with previous studies in human embryonic stem cells (hESCs) [75] and human post mortem brain tissue of chronic alcoholics [126]. However, opposite results have been reported as well. Particularly, the upregulation of the NMDA receptor subunit genes GRIN2A and GRIN2B have been reported in the hippocampus of human alcoholics [74], in hESC-derived cortical neurons [75], in mouse cortex [127], and in rats cortex [128] and amygdala [129] after long-term ethanol intake. It has been proposed that acute ethanol exposure reduces glutamatergic transmission, while prolonged exposure upregulates NMDA receptor function [130] and transcription [131,132]. Therefore, it is possible that a 4-day DID treatment was not long enough to observe the switch between reduced transmission and upregulation of NMDA receptor expression.
We observed that ethanol consumption induced FosB transcription in our experiment. This gene was found in both the WE DEG and Midnightblue module. FosB has been associated with addiction-related neural plasticity [133]. Long-lasting induction of FosB is related to chronic stress [134], drug abuse [78] as well as, ethanol exposure [80,135]. Our results are consistent with previous studies in animal models after chronic voluntary ethanol intake, showing an upregulation of FosB gene expression [80]. However, opposite results have been reported regarding FosB differential expression in the striatum and mPFC after forced ethanol exposure [80,134]. This could suggest that FosB is sensitive to ethanol exposure protocols.
Finally, our WGCNA results revealed that the majority of the significant modules were related to ethanol exposure (S7 Table). A few of these ethanol-responsive modules had axonal guidance signaling functionally overrepresented. Disruption of axon outgrowth has been reported in the developing hippocampus. These changes have been associated altered functional properties of synaptic circuitry, linked to cognitive and behavioral problems [136].
Genes influenced by both nicotine and ethanol exposure
Mice that consumed both nicotine and ethanol showed an upregulation of the stress-related gene Avp. Nicotine stimulates the HPA-axis by inducing the co-expression of Crf and Avp [87]. The activation of the stress pathways is mediated by the CHR-R1, CHR-R2 and AVP V1b receptors [69], located in the amygdala, hypothalamus, anterior pituitary, and hippocampus [137]. Additionally, AVP has been implicated in ethanol drinking [85] and the AVP V1b receptor has been shown to modulate ethanol self-administration [137]. Our results are consistent with our DEG results in the NW group and with previous studies reporting an upregulation of Avp mRNA after nicotine exposure [87]. Conversely, no effect of acute ethanol injection [138] or decreased Avp mRNA levels after chronic ethanol exposure in rats (6 or 10 months) [139], provide evidence of long-term effects of ethanol on Avp gene expression. Therefore, we hypothesize that nicotine induced Avp gene expression as 4 days of ethanol exposure might not have been long enough to cause decreased Avp mRNA as reported in previous studies.
We observed decreased expression of the GABA transporter gene Slc6a13 (encoding for GAT2) after both nicotine and ethanol exposure. A downregulation of other GABA-related genes (Gabra1 and Gabrb2) was also observed in our WGCNA results (in the Blue module). Although there is not much evidence regarding the functional importance of GAT2 in the brain, it has been suggested to regulate cerebrospinal fluid GABA concentration [140]. A previous study reported an association between Slc6a13 upregulation in the striatum and ethanol consumption [141]. Our results are not consistent with this study, however we observed decrease in Slc6a13 mRNA following both nicotine and ethanol exposure. Further research regarding the function of Slc6a13 in substance use is needed.
The WE group had the highest number of DEG (N = 353) compared to the NW (N = 99) and NE (N = 122) groups. It has been proposed that nicotine exposure blunts ethanol-induced synaptic function and excitatory neuron firing through stress hormone signaling [32]. We hypothesize that the decreased neuronal firing in response to nicotine exposure may also block induction of gene expression by ethanol. In such the animals exposed to nicotine would have less of a physiological response to ethanol, which would explain the significant increase of ethanol consumption observed in the NE compared to the WE group. On the other hand, it is possible that differences in the number of DEG between the NE and WE groups could be a result of ethanol consumption. However, it is important to highlight that the NE group consumed more ethanol than the WE group, but had fewer DEG.
In the current study, we also found interesting novel genes. For example, an upregulation of interleukin-like genes (Il16 and Il20rb) and potassium channel genes (Kcnt1 and Kcnb2, up and downregulated respectively) in the ethanol-only group. These genes could be interesting new candidate genes because of the suggested role of neuroinflammation in ethanol consumption [77]. Additionally it has been reported that potassium channels are direct targets of ethanol [76,77] and a GWAS study has found an association between a Kcnb2 single nucleotide polymorphism (SNP) and maximum number of drinks in a human population study [76].
Limitations
The limitations of this study were: (1) the use of whole brain tissue for RNA-Seq. This did not allow us to associate specific transcriptional changes to specific brain regions or cell types. Therefore, the inferences regarding gene expression changes and associations with behaviors are limited. Additionally, differences or the absence of DEG previously reported as highly associated with nicotine and ethanol consumption (e.g. nAChRs, glucocorticoid receptors, etc.) might due to complex gene expression patterns (up or downregulation) in different brain regions. However, it is important to highlight that we have been able to observe relevant DEG in whole brain tissue demonstrating the importance and extending the relevance of these genes across brain regions. (2) Only female adolescent C57BL/6J mice were used, due to their reported increased susceptibility to binge drinking during adolescence. However, future studies comparing C57BL/6J mice with ethanol avoiding strains could yield valuable insight into the molecular changes associated with susceptibility to drinking. (3) Ethanol exposure occurred during the 4 hours prior to brain dissection while no nicotine was present. This could explain why we observed less DEG in the NW group compared to the WE and NE groups and why the majority of the WGCNA modules were related to ethanol exposure. Further studies could include a nicotine minipump during ethanol exposure to test if the differences in the number of DEG or WGCNA modules between groups are related to time-dependent effects or more interestingly, corresponds to different actions of each of these substances. Finally, it is possible that effects observed in the nicotine group represent genes associated with withdrawal from nicotine rather than effects of nicotine intake per se. (4) While we randomly selected the mice for the RNA-Seq analysis, the small sample size in each group (N = 4), could be prone to sampling bias. Previous work has shown robust results with a similar samples sizes [142,143]. However, for WGCNA, 16 samples are just above the recommended sample size and could have resulted in noise in the network construction. Further study and validation of these results is warranted.
5. Conclusions
This study is one of the first to describe the effects of adolescent nicotine exposure on ethanol intake and the combined effect of both substances on brain gene expression. Here we observed that nicotine exposure increases ethanol consumption and resulting BEC in female adolescent C57BL/6J mice. Based on our results, we hypothesize that nicotine-induced upregulation of stress-related genes (Crhr1, Avp and Pomc) could be affecting GABAergic, DAergic, and glutamatergic neurotransmission in the mesolimbic pathway. This would increase glutamatergic activity and would reduce the inhibitory control of GABA on DAergic transmission [32], resulting in increased ethanol consumption observed in the NE group. Nonetheless, mechanistic experiments are required to test this hypothesis. Given the limitations of this study, validation of these findings is warranted.
Supporting information
(XLSX)
(XLSX)
(XLSX)
(XLSX)
(XLSX)
(XLSX)
Signif. codes: ‘***’ 0.001; ‘**’ 0.01; ‘*’ 0.05. Treatments with the same letter are not significantly different.
(XLSX)
(XLSX)
(XLSX)
(XLSX)
(XLSX)
(XLSX)
(XLSX)
(XLSX)
(XLSX)
(XLSX)
(XLSX)
(XLSX)
(XLSX)
(XLSX)
(XLSX)
(XLSX)
Acknowledgments
This work was supported by the National Institutes of Health grants AA019447 (National Institute on Alcohol Abuse and Alcoholism grant to HMK) and P50 DA039838 (National Institute on Drug Abuse grant to Linda Collins). Additional support came from The Pennsylvania State University Huck Institutes of the Life Sciences, the Broadhurst Career Development Professorship for the Study of Health Promotion and Disease Prevention, and the Comisión Nacional de Investigación Científica y Tecnológica de Chile (CONICYT)/ BECAS CHILE fellowship program. The funders had no role in study design, data collection and analysis, decision to publish, or preparation of the manuscript. The content is solely the responsibility of the authors and does not necessarily represent the official views of the funding institutions as mentioned above.
Data Availability
Sequencing data are available from the NCBI GEO database (experimental series accession number: GSE115188).
Funding Statement
This work was supported by the National Institutes of Health grants AA019447 (National Institute on Alcohol Abuse and Alcoholism grant to HMK) and P50 DA039838 (National Institute on Drug Abuse grant to Linda Collins; Dr. Helen Kamens is a co-investigator). Additional support came from The Pennsylvania State University Huck Institutes of the Life Sciences, the Broadhurst Career Development Professorship for the Study of Health Promotion and Disease Prevention, and the Comisión Nacional de Investigación Científica y Tecnológica de Chile (CONICYT)/ BECAS CHILE fellowship program. The funders had no role in study design, data collection and analysis, decision to publish, or preparation of the manuscript. The content is solely the responsibility of the authors and does not necessarily represent the official views of the funding institutions as mentioned above.
References
- 1.DiFranza JR, Guerrera MP. Alcoholism and smoking. J Stud Alcohol. 1990;51: 130–135. [DOI] [PubMed] [Google Scholar]
- 2.Romberger DJ, Grant K. Alcohol consumption and smoking status: the role of smoking cessation. Biomed Pharmacother. 2004;58: 77–83. doi: 10.1016/j.biopha.2003.12.002 [DOI] [PubMed] [Google Scholar]
- 3.Barron S, White A, Swartzwelder HS, Bell RL, Rodd ZA, Slawecki CJ, et al. Adolescent Vulnerabilities to Chronic Alcohol or Nicotine Exposure: Findings From Rodent Models. Alcohol Clin Exp Res. 2005;29: 1720–1725. doi: 10.1097/01.alc.0000179220.79356.e5 [DOI] [PubMed] [Google Scholar]
- 4.Petit G, Kornreich C, Verbanck P, Cimochowska A, Campanella S. Why is adolescence a key period of alcohol initiation and who is prone to develop long-term problem use?: A review of current available data. Socioaffective Neurosci Psychol. 2013;3 doi: 10.3402/snp.v3i0.21890 [DOI] [PMC free article] [PubMed] [Google Scholar]
- 5.Yamaguchi K, Kandel DB. Patterns of drug use from adolescence to young adulthood: II. Sequences of progression. Am J Public Health. 1984;74: 668–672. [DOI] [PMC free article] [PubMed] [Google Scholar]
- 6.Griffin KW, Botvin GJ, Epstein JA, Doyle MM, Diaz T. Psychosocial and behavioral factors in early adolescence as predictors of heavy drinking among high school seniors. J Stud Alcohol. 2000;61: 603–606. doi: 10.15288/jsa.2000.61.603 [DOI] [PubMed] [Google Scholar]
- 7.Jensen MK, Sørensen TIA, Andersen AT, Thorsen T, Tolstrup JS, Godtfredsen NS, et al. A prospective study of the association between smoking and later alcohol drinking in the general population. Addict Abingdon Engl. 2003;98: 355–363. [DOI] [PubMed] [Google Scholar]
- 8.Grant BF. Age at smoking onset and its association with alcohol consumption and DSM-IV alcohol abuse and dependence: results from the National Longitudinal Alcohol Epidemiologic Survey. J Subst Abuse. 1998;10: 59–73. [DOI] [PubMed] [Google Scholar]
- 9.Buu A, Dabrowska A, Mygrants M, Puttler LI, Jester JM, Zucker RA. Gender Differences in the Developmental Risk of Onset of Alcohol, Nicotine, and Marijuana Use and the Effects of Nicotine and Marijuana Use on Alcohol Outcomes. J Stud Alcohol Drugs. 2014;75: 850–858. [DOI] [PMC free article] [PubMed] [Google Scholar]
- 10.Hoffman JH, Welte JW, Barnes GM. Co-occurrence of alcohol and cigarette use among adolescents. Addict Behav. 2001;26: 63–78. [DOI] [PubMed] [Google Scholar]
- 11.Husky MM, Paliwal P, Mazure CM, McKee SA. Gender differences in association with substance use diagnoses and smoking. J Addict Med. 2007;1: 161–164. doi: 10.1097/ADM.0b013e318142d06c [DOI] [PubMed] [Google Scholar]
- 12.Weitzman ER, Chen Y-Y. The co-occurrence of smoking and drinking among young adults in college: National survey results from the United States. Drug Alcohol Depend. 2005;80: 377–386. doi: 10.1016/j.drugalcdep.2005.05.008 [DOI] [PubMed] [Google Scholar]
- 13.Simons-Morton B, Crump AD, Haynie DL, Saylor KE, Eitel P, Yu K. Psychosocial, School, and Parent Factors Associated with Recent Smoking among Early-Adolescent Boys and Girls. Prev Med. 1999;28: 138–148. doi: 10.1006/pmed.1998.0404 [DOI] [PubMed] [Google Scholar]
- 14.Dwyer JB, McQuown SC, Leslie FM. The Dynamic Effects of Nicotine on the Developing Brain. Pharmacol Ther. 2009;122: 125–139. doi: 10.1016/j.pharmthera.2009.02.003 [DOI] [PMC free article] [PubMed] [Google Scholar]
- 15.Jung Y, Hsieh LS, Lee AM, Zhou Z, Coman D, Heath CJ, et al. An epigenetic mechanism mediates developmental nicotine effects on neuronal structure and behavior. Nat Neurosci. 2016;19: 905–914. doi: 10.1038/nn.4315 [DOI] [PMC free article] [PubMed] [Google Scholar]
- 16.Counotte DS, Smit AB, Pattij T, Spijker S. Development of the motivational system during adolescence, and its sensitivity to disruption by nicotine. Dev Cogn Neurosci. 2011;1: 430–443. doi: 10.1016/j.dcn.2011.05.010 [DOI] [PMC free article] [PubMed] [Google Scholar]
- 17.Muhammad A, Mychasiuk R, Nakahashi A, Hossain SR, Gibb R, Kolb B. Prenatal nicotine exposure alters neuroanatomical organization of the developing brain. Synap N Y N. 2012;66: 950–954. doi: 10.1002/syn.21589 [DOI] [PubMed] [Google Scholar]
- 18.Blood-Siegfried J, Rende EK. The long-term effects of prenatal nicotine exposure on neurologic development. J Midwifery Womens Health. 2010;55: 143–152. doi: 10.1016/j.jmwh.2009.05.006 [DOI] [PMC free article] [PubMed] [Google Scholar]
- 19.Anthony JC, Petronis KR. Early-onset drug use and risk of later drug problems. Drug Alcohol Depend. 1995;40: 9–15. [DOI] [PubMed] [Google Scholar]
- 20.Kota D, Martin BR, Robinson SE, Damaj MI. Nicotine Dependence and Reward Differ between Adolescent and Adult Male Mice. J Pharmacol Exp Ther. 2007;322: 399–407. doi: 10.1124/jpet.107.121616 [DOI] [PubMed] [Google Scholar]
- 21.Kota D, Robinson SE, Imad Damaj M. Enhanced nicotine reward in adulthood after exposure to nicotine during early adolescence in mice. Biochem Pharmacol. 2009;78: 873–879. doi: 10.1016/j.bcp.2009.06.099 [DOI] [PubMed] [Google Scholar]
- 22.Nesil T, Kanit L, Collins AC, Pogun S. Individual differences in oral nicotine intake in rats. Neuropharmacology. 2011;61: 189–201. doi: 10.1016/j.neuropharm.2011.03.027 [DOI] [PMC free article] [PubMed] [Google Scholar]
- 23.Lopez M, Simpson D, White N, Randall C. Age- and sex-related differences in alcohol and nicotine effects in C57BL/6J mice. Addict Biol. 2003;8: 419–427. doi: 10.1080/13556210310001648176 [DOI] [PubMed] [Google Scholar]
- 24.Smith BR, Horan JT, Gaskin S, Amit Z. Exposure to nicotine enhances acquisition of ethanol drinking by laboratory rats in a limited access paradigm. Psychopharmacology (Berl). 1999;142: 408–412. doi: 10.1007/s002130050906 [DOI] [PubMed] [Google Scholar]
- 25.Klein LC, Stine MM, Vandenbergh DJ, Whetzel CA, Kamens HM. Sex differences in voluntary oral nicotine consumption by adolescent mice: a dose-response experiment. Pharmacol Biochem Behav. 2004;78: 13–25. doi: 10.1016/j.pbb.2004.01.005 [DOI] [PubMed] [Google Scholar]
- 26.Perkins KA, Donny E, Caggiula AR. Sex differences in nicotine effects and self-administration: Review of human and animal evidence. Nicotine Tob Res. 1999;1: 301–315. doi: 10.1080/14622299050011431 [DOI] [PubMed] [Google Scholar]
- 27.Isiegas C, Mague SD, Blendy JA. Sex differences in response to nicotine in C57Bl/6:129SvEv mice. Nicotine Tob Res Off J Soc Res Nicotine Tob. 2009;11: 851–858. doi: 10.1093/ntr/ntp076 [DOI] [PMC free article] [PubMed] [Google Scholar]
- 28.Middaugh LD, Kelley BM, Bandy A-LE, McGroarty KK. Ethanol Consumption by C57BL/6 Mice: Influence of Gender and Procedural Variables. Alcohol. 1999;17: 175–183. doi: 10.1016/S0741-8329(98)00055-X [DOI] [PubMed] [Google Scholar]
- 29.Strong MN, Yoneyama N, Fretwell AM, Snelling C, Tanchuck MA, Finn DA. “Binge” drinking experience in adolescent mice shows sex differences and elevated ethanol intake in adulthood. Horm Behav. 2010;58: 82–90. doi: 10.1016/j.yhbeh.2009.10.008 [DOI] [PMC free article] [PubMed] [Google Scholar]
- 30.Clark A, Lindgren S, Brooks SP, Watson WP, Little HJ. Chronic infusion of nicotine can increase operant self-administration of alcohol. Neuropharmacology. 2001;41: 108–117. [DOI] [PubMed] [Google Scholar]
- 31.Lê AD, Wang A, Harding S, Juzytsch W, Shaham Y. Nicotine increases alcohol self-administration and reinstates alcohol seeking in rats. Psychopharmacology (Berl). 2003;168: 216. [DOI] [PubMed] [Google Scholar]
- 32.Doyon WM, Dong Y, Ostroumov A, Thomas AM, Zhang TA, Dani JA. Nicotine Decreases Ethanol-Induced Dopamine Signaling and Increases Self-Administration via Stress Hormones. Neuron. 2013;79: 530–540. doi: 10.1016/j.neuron.2013.06.006 [DOI] [PMC free article] [PubMed] [Google Scholar]
- 33.Truitt WA, Hauser SR, Jr GAD, Toalston JE, Wilden JA, Bell RL, et al. Ethanol and nicotine interaction within the posterior ventral tegmental area in male and female alcohol-preferring rats: evidence of synergy and differential gene activation in the nucleus accumbens shell. Psychopharmacology (Berl). 2014;232: 639–649. doi: 10.1007/s00213-014-3702-3 [DOI] [PMC free article] [PubMed] [Google Scholar]
- 34.Larsson A, Engel JA. Neurochemical and behavioral studies on ethanol and nicotine interactions. Neurosci Biobehav Rev. 2004;27: 713–720. doi: 10.1016/j.neubiorev.2003.11.010 [DOI] [PubMed] [Google Scholar]
- 35.Locker AR, Marks MJ, Kamens HM, Klein LC. Exposure to nicotine increases nicotinic acetylcholine receptor density in the reward pathway and binge ethanol consumption in C57BL/6J adolescent female mice. Brain Res Bull. 2016;123: 13–22. doi: 10.1016/j.brainresbull.2015.09.009 [DOI] [PMC free article] [PubMed] [Google Scholar]
- 36.Martinez D, Gil R, Slifstein M, Hwang D-R, Huang Y, Perez A, et al. Alcohol Dependence Is Associated with Blunted Dopamine Transmission in the Ventral Striatum. Biol Psychiatry. 2005;58: 779–786. doi: 10.1016/j.biopsych.2005.04.044 [DOI] [PubMed] [Google Scholar]
- 37.Doyon WM, Thomas AM, Ostroumov A, Dong Y, Dani JA. Potential Substrates for Nicotine and Alcohol Interactions: a Focus on the Mesocorticolimbic Dopamine System. Biochem Pharmacol. 2013;86: 1181–1193. doi: 10.1016/j.bcp.2013.07.007 [DOI] [PMC free article] [PubMed] [Google Scholar]
- 38.Klein LC, Stine MM, Vandenbergh DJ, Whetzel CA, Kamens HM. Sex differences in voluntary oral nicotine consumption by adolescent mice: a dose-response experiment. Pharmacol Biochem Behav. 2004;78: 13–25. doi: 10.1016/j.pbb.2004.01.005 [DOI] [PubMed] [Google Scholar]
- 39.Lopez M, Simpson D, White N, Randall C. Age- and sex-related differences in alcohol and nicotine effects in C57BL/6J mice. Addict Biol. 2003;8: 419–427. doi: 10.1080/13556210310001648176 [DOI] [PubMed] [Google Scholar]
- 40.Revitsky AR. The Neurobiolgical Underpinnings of Nicotine Exposure on Limited Access Ethanol Consumption in Periadolescent Female C57bl/6j Mice. 2014; Available: https://etda.libraries.psu.edu/catalog/22102
- 41.Biondolillo KD, Pearce AR. Availability influences initial and continued ingestion of nicotine by adolescent female rats. Neuropsychobiology. 2007;55: 73–80. doi: 10.1159/000103905 [DOI] [PubMed] [Google Scholar]
- 42.Halder S, Lynch JM, Pearce AR. The multiple bottle effect is overridden in male and female rats by simultaneous presentation of two oral nicotine solutions. Am J Drug Alcohol Abuse. 2013;39: 161–167. doi: 10.3109/00952990.2013.776065 [DOI] [PubMed] [Google Scholar]
- 43.Rhodes JS, Best K, Belknap JK, Finn DA, Crabbe JC. Evaluation of a simple model of ethanol drinking to intoxication in C57BL/6J mice. Physiol Behav. 2005;84: 53–63. doi: 10.1016/j.physbeh.2004.10.007 [DOI] [PubMed] [Google Scholar]
- 44.Rhodes JS, Ford MM, Yu C-H, Brown LL, Finn DA, Garland T, et al. Mouse inbred strain differences in ethanol drinking to intoxication. Genes Brain Behav. 2007;6: 1–18. doi: 10.1111/j.1601-183X.2006.00210.x [DOI] [PubMed] [Google Scholar]
- 45.Kamens HM, Hoft NR, Cox RJ, Miyamoto J, Ehringer MA. The α6 nicotinic acetylcholine receptor subunit influences ethanol-induced sedation. Alcohol Fayettev N. 2012;46: 463–471. doi: 10.1016/j.alcohol.2012.03.001 [DOI] [PMC free article] [PubMed] [Google Scholar]
- 46.Ehringer MA, Hoft NR, Zunhammer M. Reduced alcohol consumption in mice with access to a running wheel. Alcohol Fayettev N. 2009;43: 443–452. doi: 10.1016/j.alcohol.2009.06.003 [DOI] [PubMed] [Google Scholar]
- 47.Smolen A, Marks MJ, Smolen TN, Collins AC. Dose and route of administration alter the relative elimination of ethanol by long-sleep and short-sleep mice. Alcohol Clin Exp Res. 1986;10: 198–204. [DOI] [PubMed] [Google Scholar]
- 48.Schroeder A, Mueller O, Stocker S, Salowsky R, Leiber M, Gassmann M, et al. The RIN: an RNA integrity number for assigning integrity values to RNA measurements. BMC Mol Biol. 2006;7: 3 doi: 10.1186/1471-2199-7-3 [DOI] [PMC free article] [PubMed] [Google Scholar]
- 49.illumina®. TruSeq® Stranded mRNA Sample Preparation Guide [Internet]. 2013 [cited 31 May 2016]. Available: http://support.illumina.com/content/dam/illumina-support/documents/documentation/chemistry_documentation/samplepreps_truseq/truseqstrandedmrna/truseq-stranded-mrna-sample-prep-guide-15031047-e.pdf
- 50.Bolger AM, Lohse M, Usadel B. Trimmomatic: A flexible trimmer for Illumina Sequence Data. Bioinformatics. 2014; btu170. doi: 10.1093/bioinformatics/btu170 [DOI] [PMC free article] [PubMed] [Google Scholar]
- 51.Baker JA, Li J, Zhou D, Yang M, Cook MN, Jones BC, et al. Analyses of differentially expressed genes after exposure to acute stress, acute ethanol, or a combination of both in mice. Alcohol Fayettev N. 2017;58: 139–151. doi: 10.1016/j.alcohol.2016.08.008 [DOI] [PMC free article] [PubMed] [Google Scholar]
- 52.Trapnell C, Roberts A, Goff L, Pertea G, Kim D, Kelley DR, et al. Differential gene and transcript expression analysis of RNA-seq experiments with TopHat and Cufflinks. Nat Protoc. 2012;7: 562–578. doi: 10.1038/nprot.2012.016 [DOI] [PMC free article] [PubMed] [Google Scholar]
- 53.Shen L. GeneOverlap: Test and visualize gene overlaps. In: Bioconductor [Internet]. 2013 [cited 31 Jan 2018]. Available: http://bioconductor.org/packages/GeneOverlap/
- 54.Langfelder P, Horvath S. WGCNA: an R package for weighted correlation network analysis. BMC Bioinformatics. 2008;9: 559 doi: 10.1186/1471-2105-9-559 [DOI] [PMC free article] [PubMed] [Google Scholar]
- 55.Krämer A, Green J, Pollard J, Tugendreich S. Causal analysis approaches in Ingenuity Pathway Analysis. Bioinformatics. 2014;30: 523–530. doi: 10.1093/bioinformatics/btt703 [DOI] [PMC free article] [PubMed] [Google Scholar]
- 56.Malki K, Mineur YS, Tosto MG, Campbell J, Karia P, Jumabhoy I, et al. Pervasive and opposing effects of Unpredictable Chronic Mild Stress (UCMS) on hippocampal gene expression in BALB/cJ and C57BL/6J mouse strains. BMC Genomics. 2015;16 doi: 10.1186/s12864-015-1431-6 [DOI] [PMC free article] [PubMed] [Google Scholar]
- 57.Gilman SE, Rende R, Boergers J, Abrams DB, Buka SL, Clark MA, et al. Parental smoking and adolescent smoking initiation: an intergenerational perspective on tobacco control. Pediatrics. 2009;123: e274–e281. doi: 10.1542/peds.2008-2251 [DOI] [PMC free article] [PubMed] [Google Scholar]
- 58.Kaur S, Li J, Stenzel-Poore MP, Ryabinin AE. Corticotropin releasing factor acting on corticotropin releasing factor receptor type 1 is critical for binge alcohol drinking in mice. Alcohol Clin Exp Res. 2012;36: 369–376. doi: 10.1111/j.1530-0277.2011.01610.x [DOI] [PMC free article] [PubMed] [Google Scholar]
- 59.Rhodes JS, Best K, Belknap JK, Finn DA, Crabbe JC. Evaluation of a simple model of ethanol drinking to intoxication in C57BL/6J mice. Physiol Behav. 2005;84: 53–63. doi: 10.1016/j.physbeh.2004.10.007 [DOI] [PubMed] [Google Scholar]
- 60.Sparrow AM, Lowery-Gionta EG, Pleil KE, Li C, Sprow GM, Cox BR, et al. Central Neuropeptide Y Modulates Binge-Like Ethanol Drinking in C57BL/6J Mice via Y1 and Y2 Receptors. Neuropsychopharmacology. 2012;37: 1409–1421. doi: 10.1038/npp.2011.327 [DOI] [PMC free article] [PubMed] [Google Scholar]
- 61.Thiele TE, Navarro M. “Drinking in the Dark” (DID) Procedures: A Model of Binge-Like Ethanol Drinking in Non-Dependent Mice. Alcohol Fayettev N. 2014;48: 235–241. doi: 10.1016/j.alcohol.2013.08.005 [DOI] [PMC free article] [PubMed] [Google Scholar]
- 62.Silva JP, Lambert G, van Booven D, Wahlestedt C. Epigenomic and metabolic responses of hypothalamic POMC neurons to gestational nicotine exposure in adult offspring. Genome Med. 2016;8 doi: 10.1186/s13073-016-0348-2 [DOI] [PMC free article] [PubMed] [Google Scholar]
- 63.Mineur YS, Abizaid A, Rao Y, Salas R, DiLeone RJ, Gündisch D, et al. Nicotine decreases food intake through activation of POMC neurons. Science. 2011;332: 1330–1332. doi: 10.1126/science.1201889 [DOI] [PMC free article] [PubMed] [Google Scholar]
- 64.Yu G, Chen H, Zhao W, Matta SG, Sharp BM. Nicotine self-administration differentially regulates hypothalamic corticotropin-releasing factor and arginine vasopressin mRNAs and facilitates stress-induced neuronal activation. J Neurosci Off J Soc Neurosci. 2008;28: 2773–2782. doi: 10.1523/JNEUROSCI.3837-07.2008 [DOI] [PMC free article] [PubMed] [Google Scholar]
- 65.Devesa P, Agasse F, Xapelli S, Almengló C, Devesa J, Malva JO, et al. Growth hormone pathways signaling for cell proliferation and survival in hippocampal neural precursors from postnatal mice. BMC Neurosci. 2014;15 doi: 10.1186/1471-2202-15-100 [DOI] [PMC free article] [PubMed] [Google Scholar]
- 66.Arámburo C, Alba-Betancourt C, Luna M, Harvey S. Expression and function of growth hormone in the nervous system: a brief review. Gen Comp Endocrinol. 2014;203: 35–42. doi: 10.1016/j.ygcen.2014.04.035 [DOI] [PubMed] [Google Scholar]
- 67.Bramham CR, Alme MN, Bittins M, Kuipers SD, Nair RR, Pai B, et al. The Arc of synaptic memory. Exp Brain Res Exp Hirnforsch Exp Cerebrale. 2010;200: 125–140. doi: 10.1007/s00221-009-1959-2 [DOI] [PMC free article] [PubMed] [Google Scholar]
- 68.Velazquez FN, Caputto BL, Boussin FD. c-Fos importance for brain development. Aging. 2015;7: 1028–1029. doi: 10.18632/aging.100862 [DOI] [PMC free article] [PubMed] [Google Scholar]
- 69.Lutfy K, Aimiuwu O, Mangubat M, Shin C-S, Nerio N, Gomez R, et al. Nicotine stimulates secretion of corticosterone via both CRH and AVP receptors. J Neurochem. 2012;120: 1108–1116. doi: 10.1111/j.1471-4159.2011.07633.x [DOI] [PMC free article] [PubMed] [Google Scholar]
- 70.Lenz B, Klafki H-W, Hillemacher T, Killisch N, Schaller G, Frieling H, et al. Smoking behaviour is associated with expression and phosphorylation of CREB in human buffy coat. Int J Neuropsychopharmacol. 2010;13: 207–215. doi: 10.1017/S1461145709991052 [DOI] [PubMed] [Google Scholar]
- 71.Brunzell DH, Mineur YS, Neve RL, Picciotto MR. Nucleus accumbens CREB activity is necessary for nicotine conditioned place preference. Neuropsychopharmacol Off Publ Am Coll Neuropsychopharmacol. 2009;34: 1993–2001. doi: 10.1038/npp.2009.11 [DOI] [PMC free article] [PubMed] [Google Scholar]
- 72.Kenny PJ, File SE, Rattray M. Acute nicotine decreases, and chronic nicotine increases the expression of brain-derived neurotrophic factor mRNA in rat hippocampus. Brain Res Mol Brain Res. 2000;85: 234–238. [DOI] [PubMed] [Google Scholar]
- 73.Ducci F, Kaakinen M, Pouta A, Hartikainen A-L, Veijola J, Isohanni M, et al. TTC12-ANKK1-DRD2 and CHRNA5-CHRNA3-CHRNB4 influence different pathways leading to smoking behavior from adolescence to mid-adulthood. Biol Psychiatry. 2011;69: 650–660. doi: 10.1016/j.biopsych.2010.09.055 [DOI] [PMC free article] [PubMed] [Google Scholar]
- 74.Enoch M-A, Rosser AA, Zhou Z, Mash DC, Yuan Q, Goldman D. Expression of glutamatergic genes in healthy humans across 16 brain regions; altered expression in the hippocampus after chronic exposure to alcohol or cocaine. Genes Brain Behav. 2014;13: 758–768. doi: 10.1111/gbb.12179 [DOI] [PMC free article] [PubMed] [Google Scholar]
- 75.Xiang Y, Kim K-Y, Gelernter J, Park I-H, Zhang H. Ethanol upregulates NMDA receptor subunit gene expression in human embryonic stem cell-derived cortical neurons. PloS One. 2015;10: e0134907 doi: 10.1371/journal.pone.0134907 [DOI] [PMC free article] [PubMed] [Google Scholar]
- 76.Pan Y, Luo X, Liu X, Wu L-Y, Zhang Q, Wang L, et al. Genome-wide association studies of maximum number of drinks. J Psychiatr Res. 2013;47: 1717–1724. doi: 10.1016/j.jpsychires.2013.07.013 [DOI] [PMC free article] [PubMed] [Google Scholar]
- 77.Kurschner C, Yuzaki M. Neuronal interleukin-16 (NIL-16): a dual function PDZ domain protein. J Neurosci Off J Soc Neurosci. 1999;19: 7770–7780. [DOI] [PMC free article] [PubMed] [Google Scholar]
- 78.Nestler EJ. Psychogenomics: Opportunities for Understanding Addiction. J Neurosci. 2001;21: 8324–8327. [DOI] [PMC free article] [PubMed] [Google Scholar]
- 79.De Pauli RF, Coelhoso CC, Tesone-Coelho C, Linardi A, Mello LE, Silveira DX, et al. Withdrawal induces distinct patterns of FosB/ΔFosB expression in outbred Swiss mice classified as susceptible and resistant to ethanol-induced locomotor sensitization. Pharmacol Biochem Behav. 2014;117: 70–78. doi: 10.1016/j.pbb.2013.12.007 [DOI] [PubMed] [Google Scholar]
- 80.Li J, Cheng Y, Bian W, Liu X, Zhang C, Ye J-H. Region-Specific Induction of FosB/Delta-FosB by Voluntary Alcohol Intake: Effects of Naltrexone: ALCOHOL DRINKING INDUCED FOSB/DELTA-FOSB. Alcohol Clin Exp Res. 2010;34: 1742–1750. doi: 10.1111/j.1530-0277.2010.01261.x [DOI] [PMC free article] [PubMed] [Google Scholar]
- 81.Costin BN, Dever SM, Miles MF. Ethanol Regulation of Serum Glucocorticoid Kinase 1 Expression in DBA2/J Mouse Prefrontal Cortex. PLOS ONE. 2013;8: e72979 doi: 10.1371/journal.pone.0072979 [DOI] [PMC free article] [PubMed] [Google Scholar]
- 82.Osterndorff-Kahanek EA, Becker HC, Lopez MF, Farris SP, Tiwari GR, Nunez YO, et al. Chronic Ethanol Exposure Produces Time- and Brain Region-Dependent Changes in Gene Coexpression Networks. PLOS ONE. 2015;10: e0121522 doi: 10.1371/journal.pone.0121522 [DOI] [PMC free article] [PubMed] [Google Scholar]
- 83.Procopio DO, Saba LM, Walter H, Lesch O, Skala K, Schlaff G, et al. Genetic Markers of Co-Morbid Depression and Alcoholism in Women. Alcohol Clin Exp Res. 2013;37: 896–904. doi: 10.1111/acer.12060 [DOI] [PMC free article] [PubMed] [Google Scholar]
- 84.Sikela JM, MacLaren EJ, Kim Y, Karimpour-Fard A, Cai W-W, Pollack J, et al. DNA Microarray and Proteomic Strategies for Understanding Alcohol Action. Alcohol Clin Exp Res. 2006;30: 700–708. doi: 10.1111/j.1530-0277.2006.00081.x [DOI] [PMC free article] [PubMed] [Google Scholar]
- 85.Zhou Y, Colombo G, Carai MAM, Ho A, Gessa GL, Kreek MJ. Involvement of arginine vasopressin and V1b receptor in alcohol drinking in Sardinian alcohol-preferring rats. Alcohol Clin Exp Res. 2011;35: 1876–1883. doi: 10.1111/j.1530-0277.2011.01532.x [DOI] [PMC free article] [PubMed] [Google Scholar]
- 86.Rhodes ME, O’Toole SM, Czambel RK, Rubin RT. Male-female differences in rat hypothalamic-pituitary-adrenal axis responses to nicotine stimulation. Brain Res Bull. 2001;54: 681–688. doi: 10.1016/S0361-9230(01)00488-9 [DOI] [PubMed] [Google Scholar]
- 87.Yu G, Chen H, Zhao W, Matta SG, Sharp BM. Nicotine self-administration differentially regulates hypothalamic corticotropin-releasing factor and arginine vasopressin mRNAs and facilitates stress-induced neuronal activation. J Neurosci Off J Soc Neurosci. 2008;28: 2773–2782. doi: 10.1523/JNEUROSCI.3837-07.2008 [DOI] [PMC free article] [PubMed] [Google Scholar]
- 88.Cui W-Y, Seneviratne C, Gu J, Li MD. Genetics of GABAergic signaling in nicotine and alcohol dependence. Hum Genet. 2012;131: 843–855. doi: 10.1007/s00439-011-1108-4 [DOI] [PMC free article] [PubMed] [Google Scholar]
- 89.Albrecht C, von der Kammer H, Mayhaus M, Klaudiny J, Schweizer M, Nitsch RM. Muscarinic Acetylcholine Receptors Induce the Expression of the Immediate Early Growth Regulatory Gene CYR61. J Biol Chem. 2000;275: 28929–28936. doi: 10.1074/jbc.M003053200 [DOI] [PubMed] [Google Scholar]
- 90.Klee EW, Schneider H, Clark KJ, Cousin MA, Ebbert JO, Hooten WM, et al. Zebrafish: a model for the study of addiction genetics. Hum Genet. 2012;131: 977–1008. doi: 10.1007/s00439-011-1128-0 [DOI] [PMC free article] [PubMed] [Google Scholar]
- 91.Mandal C, Park KS, Jung KH, Chai YG. Ethanol-related alterations in gene expression patterns in the developing murine hippocampus. Acta Biochim Biophys Sin. 2015;47: 581–587. doi: 10.1093/abbs/gmv050 [DOI] [PubMed] [Google Scholar]
- 92.Nunez YO, Truitt JM, Gorini G, Ponomareva ON, Blednov YA, Harris RA, et al. Positively correlated miRNA-mRNA regulatory networks in mouse frontal cortex during early stages of alcohol dependence. BMC Genomics. 2013;14: 725 doi: 10.1186/1471-2164-14-725 [DOI] [PMC free article] [PubMed] [Google Scholar]
- 93.Kitanaka N, Kitanaka J, Hall FS, Tatsuta T, Morita Y, Takemura M, et al. Alterations in the levels of heterotrimeric G protein subunits induced by psychostimulants, opiates, barbiturates, and ethanol: Implications for drug dependence, tolerance, and withdrawal. Synapse. 2008;62: 689–699. doi: 10.1002/syn.20543 [DOI] [PMC free article] [PubMed] [Google Scholar]
- 94.Benjamin E, Burns BS, Proctor WR. Tobacco Smoke Exposure Greatly Increases Alcohol Consumption in C57BL/6 Mice. Alcohol Clin Exp Res. 2013;37: E364–E372. doi: 10.1111/j.1530-0277.2012.01911.x [DOI] [PMC free article] [PubMed] [Google Scholar]
- 95.Abreu-Villaça Y, Nunes F, Queiroz-Gomes F do E, Manhães AC, Filgueiras CC. Combined Exposure to Nicotine and Ethanol in Adolescent Mice Differentially Affects Anxiety Levels during Exposure, Short-Term, and Long-Term Withdrawal. Neuropsychopharmacology. 2007;33: 599–610. doi: 10.1038/sj.npp.1301429 [DOI] [PubMed] [Google Scholar]
- 96.Lárraga A, Belluzzi JD, Leslie FM. Nicotine Increases Alcohol Intake in Adolescent Male Rats. Front Behav Neurosci. 2017;11 doi: 10.3389/fnbeh.2017.00025 [DOI] [PMC free article] [PubMed] [Google Scholar]
- 97.Lallemand F, Ward RJ, De Witte P. Nicotine increases ethanol preference but decreases locomotor activity during the initial stages of chronic ethanol withdrawal. Alcohol Alcohol Oxf Oxfs. 2007;42: 207–218. doi: 10.1093/alcalc/agm023 [DOI] [PubMed] [Google Scholar]
- 98.Blomqvist O, Ericson M, Johnson DH, Engel JA, Söderpalm B. Voluntary ethanol intake in the rat: effects of nicotinic acetylcholine receptor blockade or subchronic nicotine treatment. Eur J Pharmacol. 1996;314: 257–267. [DOI] [PubMed] [Google Scholar]
- 99.Barrett SP, Tichauer M, Leyton M, Pihl RO. Nicotine increases alcohol self-administration in non-dependent male smokers. Drug Alcohol Depend. 2006;81: 197–204. doi: 10.1016/j.drugalcdep.2005.06.009 [DOI] [PubMed] [Google Scholar]
- 100.Smith AM, Kelly RB, Chen W-JA. Chronic continuous nicotine exposure during periadolescence does not increase ethanol intake during adulthood in rats. Alcohol Clin Exp Res. 2002;26: 976–979. doi: 10.1097/01.ALC.0000021176.13538.55 [DOI] [PubMed] [Google Scholar]
- 101.Penland S, Hoplight B, Obernier J, Crews FT. Effects of nicotine on ethanol dependence and brain damage. Alcohol Fayettev N. 2001;24: 45–54. [DOI] [PubMed] [Google Scholar]
- 102.Mendel JR, Berg CJ, Windle RC, Windle M. Predicting young adulthood smoking among adolescent smokers and nonsmokers. Am J Health Behav. 2012;36: 542–554. doi: 10.5993/AJHB.36.4.11 [DOI] [PMC free article] [PubMed] [Google Scholar]
- 103.Ostroumov A, Dani JA. Convergent Neuronal Plasticity and Metaplasticity Mechanisms of Stress, Nicotine, and Alcohol. Annu Rev Pharmacol Toxicol. 2017; doi: 10.1146/annurev-pharmtox-010617-052735 [DOI] [PMC free article] [PubMed] [Google Scholar]
- 104.Lüscher C. The Emergence of a Circuit Model for Addiction. Annu Rev Neurosci. 2016;39: 257–276. doi: 10.1146/annurev-neuro-070815-013920 [DOI] [PubMed] [Google Scholar]
- 105.Romeo RD. The Teenage Brain: The Stress Response and the Adolescent Brain. Curr Dir Psychol Sci. 2013;22: 140–145. doi: 10.1177/0963721413475445 [DOI] [PMC free article] [PubMed] [Google Scholar]
- 106.Tweed JO, Hsia SH, Lutfy K, Friedman TC. The endocrine effects of nicotine and cigarette smoke. Trends Endocrinol Metab. 2012;23: 334–342. doi: 10.1016/j.tem.2012.03.006 [DOI] [PMC free article] [PubMed] [Google Scholar]
- 107.Koob G, Kreek MJ. Stress, dysregulation of drug reward pathways, and the transition to drug dependence. Am J Psychiatry. 2007;164: 1149–1159. doi: 10.1176/appi.ajp.2007.05030503 [DOI] [PMC free article] [PubMed] [Google Scholar]
- 108.Huang L z., Winzer-Serhan U h. Nicotine regulates mRNA expression of feeding peptides in the arcuate nucleus in neonatal rat pups. Dev Neurobiol. 2007;67: 363–377. doi: 10.1002/dneu.20348 [DOI] [PubMed] [Google Scholar]
- 109.Yu G, Chen H, Wu X, Matta SG, Sharp BM. Nicotine self-administration differentially modulates glutamate and GABA transmission in hypothalamic paraventricular nucleus to enhance the hypothalamic-pituitary-adrenal response to stress. J Neurochem. 2010;113: 919–929. doi: 10.1111/j.1471-4159.2010.06654.x [DOI] [PMC free article] [PubMed] [Google Scholar]
- 110.Tapinc DE, Ilgin R, Kaya E, Gozen O, Ugur M, Koylu EO, et al. Gene expression of pro-opiomelanocortin and melanocortin receptors is regulated in the hypothalamus and mesocorticolimbic system following nicotine administration. Neurosci Lett. 2017;637: 75–79. doi: 10.1016/j.neulet.2016.11.049 [DOI] [PubMed] [Google Scholar]
- 111.Kramer PR, Kramer SF, Marr K, Guan G, Wellman PJ, Bellinger LL. Nicotine administration effects on feeding and cocaine-amphetamine-regulated transcript (CART) expression in the hypothalamus. Regul Pept. 2007;138: 66–73. doi: 10.1016/j.regpep.2006.08.002 [DOI] [PubMed] [Google Scholar]
- 112.Gudehithlu KP, Duchemin A-M, Tejwani GA, Neff NH, Hadjiconstantinou M. Nicotine-induced changes of brain β-endorphin. Neuropeptides. 2012;46: 125–131. doi: 10.1016/j.npep.2012.03.001 [DOI] [PubMed] [Google Scholar]
- 113.Schochet TL, Kelley AE, Landry CF. Differential Expression of Arc mRNA and Other Plasticity-Related Genes Induced by Nicotine in Adolescent Rat Forebrain. Neuroscience. 2005;135: 285–297. doi: 10.1016/j.neuroscience.2005.05.057 [DOI] [PMC free article] [PubMed] [Google Scholar]
- 114.Padilla SL, Reef D, Zeltser LM. Defining POMC neurons using transgenic reagents: impact of transient Pomc expression in diverse immature neuronal populations. Endocrinology. 2012;153: 1219–1231. doi: 10.1210/en.2011-1665 [DOI] [PMC free article] [PubMed] [Google Scholar]
- 115.Guzowski JF, Lyford GL, Stevenson GD, Houston FP, McGaugh JL, Worley PF, et al. Inhibition of activity-dependent arc protein expression in the rat hippocampus impairs the maintenance of long-term potentiation and the consolidation of long-term memory. J Neurosci Off J Soc Neurosci. 2000;20: 3993–4001. [DOI] [PMC free article] [PubMed] [Google Scholar]
- 116.Schmitt HF, Huang LZ, Son J-H, Pinzon-Guzman C, Slaton GS, Winzer-Serhan UH. Acute nicotine activates c-fos and Arc mRNA expression in limbic brain areas involved in the central stress-response in rat pups during a period of hypo-responsiveness to stress. Neuroscience. 2008;157: 349–359. doi: 10.1016/j.neuroscience.2008.09.018 [DOI] [PMC free article] [PubMed] [Google Scholar]
- 117.Kawashima T, Okuno H, Bito H. A new era for functional labeling of neurons: activity-dependent promoters have come of age. Front Neural Circuits. 2014;8 doi: 10.3389/fncir.2014.00037 [DOI] [PMC free article] [PubMed] [Google Scholar]
- 118.Rao VR, Pintchovski SA, Chin J, Peebles CL, Mitra S, Finkbeiner S. AMPA receptors regulate transcription of the plasticity-related immediate-early gene Arc. Nat Neurosci. 2006;9: 887–895. doi: 10.1038/nn1708 [DOI] [PubMed] [Google Scholar]
- 119.Tang B, Luo D, Yang J, Xu X-Y, Zhu B-L, Wang X-F, et al. Modulation of AMPA receptor mediated current by nicotinic acetylcholine receptor in layer I neurons of rat prefrontal cortex. Sci Rep. 2015;5: 14099 doi: 10.1038/srep14099 [DOI] [PMC free article] [PubMed] [Google Scholar]
- 120.Halff AW, Gómez-Varela D, John D, Berg DK. A Novel Mechanism for Nicotinic Potentiation of Glutamatergic Synapses. J Neurosci. 2014;34: 2051–2064. doi: 10.1523/JNEUROSCI.2795-13.2014 [DOI] [PMC free article] [PubMed] [Google Scholar]
- 121.Mulligan MK, Rhodes JS, Crabbe JC, Mayfield RD, Adron Harris R, Ponomarev I. Molecular Profiles of Drinking Alcohol to Intoxication in C57BL/6J Mice. Alcohol Clin Exp Res. 2011;35: 659–670. doi: 10.1111/j.1530-0277.2010.01384.x [DOI] [PMC free article] [PubMed] [Google Scholar]
- 122.Osterndorff-Kahanek E, Ponomarev I, Blednov YA, Harris RA. Gene Expression in Brain and Liver Produced by Three Different Regimens of Alcohol Consumption in Mice: Comparison with Immune Activation. PLoS ONE. 2013;8 doi: 10.1371/journal.pone.0059870 [DOI] [PMC free article] [PubMed] [Google Scholar]
- 123.Marballi K, Genabai NK, Blednov YA, Harris RA, Ponomarev I. Alcohol consumption induces global gene expression changes in VTA dopaminergic neurons. Genes Brain Behav. 2016;15: 318–326. doi: 10.1111/gbb.12266 [DOI] [PMC free article] [PubMed] [Google Scholar]
- 124.Brolese G, Lunardi P, Souza DF de, Lopes FM, Leite MC, Gonçalves C-A. Pre- and Postnatal Exposure to Moderate Levels of Ethanol Can Have Long-Lasting Effects on Hippocampal Glutamate Uptake in Adolescent Offspring. PLoS ONE. 2015;10 doi: 10.1371/journal.pone.0127845 [DOI] [PMC free article] [PubMed] [Google Scholar]
- 125.Chandrasekar R. Alcohol and NMDA receptor: current research and future direction. Front Mol Neurosci. 2013;6 doi: 10.3389/fnmol.2013.00014 [DOI] [PMC free article] [PubMed] [Google Scholar]
- 126.Ridge JP, Ho AM-C, Innes DJ, Dodd PR. The Expression of NMDA Receptor Subunit mRNA in Human Chronic Alcoholics. Ann N Y Acad Sci. 2008;1139: 10–19. doi: 10.1196/annals.1432.053 [DOI] [PMC free article] [PubMed] [Google Scholar]
- 127.Follesa P, Ticku MK. NMDA receptor upregulation: molecular studies in cultured mouse cortical neurons after chronic antagonist exposure. J Neurosci Off J Soc Neurosci. 1996;16: 2172–2178. [DOI] [PMC free article] [PubMed] [Google Scholar]
- 128.Nagy J, Horváth C, Farkas S, Kolok S, Szombathelyi Z. NR2B subunit selective NMDA antagonists inhibit neurotoxic effect of alcohol-withdrawal in primary cultures of rat cortical neurones. Neurochem Int. 2004;44: 17–23. [DOI] [PubMed] [Google Scholar]
- 129.Floyd DW, Jung K-Y, McCool BA. Chronic ethanol ingestion facilitates N-methyl-D-aspartate receptor function and expression in rat lateral/basolateral amygdala neurons. J Pharmacol Exp Ther. 2003;307: 1020–1029. doi: 10.1124/jpet.103.057505 [DOI] [PubMed] [Google Scholar]
- 130.Nagy J. Alcohol related changes in regulation of NMDA receptor functions. Curr Neuropharmacol. 2008;6: 39–54. doi: 10.2174/157015908783769662 [DOI] [PMC free article] [PubMed] [Google Scholar]
- 131.Kalluri H, Mehta A, Ticku M. Up-regulation of NMDA receptor subunits in rat brain following chronic ethanol treatment.—PubMed—NCBI [Internet]. 1998 [cited 30 Nov 2017]. Available: https://www.ncbi.nlm.nih.gov/pubmed/9685652 [DOI] [PubMed]
- 132.Henniger MSH, Wotjak CT, Hölter SM. Long-term voluntary ethanol drinking increases expression of NMDA receptor 2B subunits in rat frontal cortex. Eur J Pharmacol. 2003;470: 33–36. [DOI] [PubMed] [Google Scholar]
- 133.Robison AJ, Nestler EJ. Transcriptional and epigenetic mechanisms of addiction. Nat Rev Neurosci. 2011;12: 623–637. doi: 10.1038/nrn3111 [DOI] [PMC free article] [PubMed] [Google Scholar]
- 134.Perrotti LI, Weaver RR, Robison B, Renthal W, Maze I, Yazdani S, et al. Distinct Patterns of ΔFosB Induction in Brain by Drugs of Abuse. Synap N Y N. 2008;62: 358–369. doi: 10.1002/syn.20500 [DOI] [PMC free article] [PubMed] [Google Scholar]
- 135.Ding WQ, Fried U, Larsson C, Alling C. Ethanol exposure potentiates fosB and junB expression induced by muscarinic receptor stimulation in neuroblastoma SH-SY5Y cells. Alcohol Clin Exp Res. 1998;22: 225–230. [PubMed] [Google Scholar]
- 136.Lindsley TA, Miller MW, Littner Y, Bearer CF. Signaling Pathways Regulating Cell Motility: A Role in Ethanol Teratogenicity? Alcohol Clin Exp Res. 2006;30: 1445–1450. doi: 10.1111/j.1530-0277.2006.00173.x [DOI] [PMC free article] [PubMed] [Google Scholar]
- 137.Edwards S, Guerrero M, Ghoneim OM, Roberts E, Koob GF. Evidence that vasopressin V1b receptors mediate the transition to excessive drinking in ethanol-dependent rats. Addict Biol. 2012;17: 76–85. doi: 10.1111/j.1369-1600.2010.00291.x [DOI] [PMC free article] [PubMed] [Google Scholar]
- 138.Lee S, Selvage D, Hansen K, Rivier C. Site of action of acute alcohol administration in stimulating the rat hypothalamic-pituitary-adrenal axis: comparison between the effect of systemic and intracerebroventricular injection of this drug on pituitary and hypothalamic responses. Endocrinology. 2004;145: 4470–4479. doi: 10.1210/en.2004-0110 [DOI] [PubMed] [Google Scholar]
- 139.Silva SM, Madeira MD, Ruela C, Paula-Barbosa MM. Prolonged alcohol intake leads to irreversible loss of vasopressin and oxytocin neurons in the paraventricular nucleus of the hypothalamus. Brain Res. 2002;925: 76–88. [DOI] [PubMed] [Google Scholar]
- 140.Conti F, Minelli A, Melone M. GABA transporters in the mammalian cerebral cortex: localization, development and pathological implications. Brain Res Brain Res Rev. 2004;45: 196–212. doi: 10.1016/j.brainresrev.2004.03.003 [DOI] [PubMed] [Google Scholar]
- 141.Darlington TM, McCarthy RD, Cox RJ, Miyamoto-Ditmon J, Gallego X, Ehringer MA. Voluntary wheel running reduces voluntary consumption of ethanol in mice: identification of candidate genes through striatal gene expression profiling. Genes Brain Behav. 2016;15: 474–490. doi: 10.1111/gbb.12294 [DOI] [PMC free article] [PubMed] [Google Scholar]
- 142.Darlington T, Ehringer M, Larson C, Phang T, Radcliffe R. Transcriptome analysis of Inbred Long Sleep and Inbred Short Sleep mice. Genes Brain Behav. 2013;12: 263–274. doi: 10.1111/gbb.12018 [DOI] [PMC free article] [PubMed] [Google Scholar]
- 143.Morud J, Ashouri A, Larsson E, Ericson M, Söderpalm B. Transcriptional profiling of the rat nucleus accumbens after modest or high alcohol exposure. PLoS ONE. 2017;12 doi: 10.1371/journal.pone.0181084 [DOI] [PMC free article] [PubMed] [Google Scholar]
Associated Data
This section collects any data citations, data availability statements, or supplementary materials included in this article.
Supplementary Materials
(XLSX)
(XLSX)
(XLSX)
(XLSX)
(XLSX)
(XLSX)
Signif. codes: ‘***’ 0.001; ‘**’ 0.01; ‘*’ 0.05. Treatments with the same letter are not significantly different.
(XLSX)
(XLSX)
(XLSX)
(XLSX)
(XLSX)
(XLSX)
(XLSX)
(XLSX)
(XLSX)
(XLSX)
(XLSX)
(XLSX)
(XLSX)
(XLSX)
(XLSX)
(XLSX)
Data Availability Statement
Sequencing data are available from the NCBI GEO database (experimental series accession number: GSE115188).