

Abstract
Aims
Extra virgin olive oil lowers postprandial glycaemia. We investigated if oleuropein, a component of extra virgin olive oil, exerts a similar effect on postprandial glycaemia and the underlying mechanism.
Methods
Twenty healthy subjects were randomly allocated in a cross‐over design to 20 mg oleuropein or placebo immediately before lunch. Postprandial glycaemia along with blood insulin, dipeptidyl‐peptidase‐4 (DPP‐4) and glucagon‐like peptide‐1 and oxidative stress, which included soluble NADPH oxidase‐derived peptide activity (sNox2‐dp), 8‐iso‐prostaglandin‐2α and platelet p47phox phosphorylation, were analysed before and 2 h after meal.
Results
After 2 h, subjects who assumed oleuropein had significantly lower blood glucose, DPP‐4 activity and higher insulin and glucagon‐like peptide‐1 compared to placebo. Furthermore, sNox2‐dp, 8‐iso‐PGF2α and platelet p47phox phosphorylation were significantly lower in oleuropein‐ compared to placebo‐treated subjects. DPP‐4 significantly correlated with sNox2‐dp [Spearman's rho (Rs) = 0.615; P < 0.001], p47phox phosphorylation (Rs = 0.435; P < 0.05) and 8‐iso‐ prostaglandin‐2α (Rs = 0.33; P < 0.05). In vitro study demonstrated that hydroxytyrosol, a metabolite of oleuropein, significantly reduced p47phox phosphorylation and isoprostane formation.
Conclusions
These findings indicate that oleuropein improves postprandial glycaemic profile via hampering Nox2‐derived oxidative stress.
Keywords: Nox2, oxidative stress, glycaemia, oleuropein
What is Already Known about this Subject
It is known that postprandial phase is associated with an abrupt formation of reactive oxidant species and glycaemia profile.
Extra virgin olive oil (EVOO) exerts a positive effect on postprandial glycaemia and oxidative stress by its antioxidant property.
Oleuropein possesses antioxidant property, which could be implicated in improving postprandial glycaemia and oxidative stress by EVOO.
What this Study Adds
Oleuropein, a component of EVOO, improves postprandial glycaemia by reducing glucose and increasing insulin and dipeptidyl‐peptidase‐4 activity in healthy subjects.
Oleuropein, improves postprandial oxidative stress by reduction of Nox2 activity in healthy subjects.
Oleuropein may be a novel candidate for improving glycaemic profile in patients with diabetes mellitus.
Introduction
Observational as well as intervention studies have demonstrated that Mediterranean diet is associated with a lower risk of cardiovascular events 1, 2. Mediterranean diet is rich in fruits and vegetables, has low content of meat and dairy and includes extra virgin olive oil (EVOO) and a small amount of wine 3. Recent studies demonstrated that, among the typical nutrients of Mediterranean diet, EVOO possess beneficial effects as documented by reduction of cardiovascular events in patients at risk of atherosclerosis given a Mediterranean diet supplemented with EVOO 1. Prevention of new onset diabetes has been suggested as a mechanism potentially retarding atherosclerotic progression and its clinical sequelae by EVOO 4. We and others have recently demonstrated that EVOO has positive effects on postprandial glycaemia, which may have deleterious effects on vascular disease by promoting and/or aggravating the atherosclerotic process 5, 6. Thus, postprandial glucose has been associated with increased oxidative stress and a higher incidence of cardiovascular events in patients with and without diabetes 7, 8, 9. EVOO exerts its positive effect on postprandial glycaemia by GPL1‐mediated insulin secretion, an effect that is related to downregulation of dipeptidyl‐peptidase‐4 (DPP‐4), an inhibitor of glucagon‐like peptide‐1 (GLP1) 5. The beneficial effect on postprandial glycaemia was attributed to its antioxidant property and seemed to be specific for EVOO as supplementing a meal with corn oil did not result in changes of postprandial glycaemia 5. As this finding would suggest that specific components of EVOO affect postprandial glycaemia, we focused our attention on oleuropein, which is one of the most common active compounds in the leaves of olive tree and consists of hydroxytyrosol (3,4′‐dihydroxyphenylethanol, HT), elenolic acid and glucose. Of note, oleuropein possess antioxidant property 10, 11, which could be implicated in improving postprandial glycaemia by EVOO, but data in humanS are still lacking 5. Thus, we performed an interventional study to investigate the effects of oleuropein on postprandial glycaemia and Nox2‐related oxidative stress in healthy subjects.
Methods
Study population and recruitment
Twenty healthy subjects (10 male and 10 female, age 33.9 ± 6.9 years) gave informed consent to participate in the interventional study, which was performed between July and September 2016 at Policlinico Umberto I ‐ Rome. Clinical and demographics characteristics of HS as well as nutrient lunch are reported in Tables 1 and 2, respectively.
Table 1.
Baseline characteristics of healthy subjects
| Variables | Healthy subjects (n = 20) |
|---|---|
| Age (years) | 33.9 ± 6.9 |
| Males, n (%) | 10 (50) |
| Body mass index (kg m –2 ) | 20.7 ± 3.7 |
| Systolic BP (mmHg) | 124 ± 5.0 |
| Diastolic BP (mmHg) | 72 ± 7.4 |
| Total cholesterol (mg dl –1 ) | 171 ± 13.3 |
| Low‐density lipoprotein (mg dl –1 ) | 81 ± 11.3 |
| Fasting glycaemia (mg dl –1 ) |
BP, blood pressure
Table 2.
Bromatological composition of the meal
| Amount | Proteins | Lipids | Carbohydrates | |
|---|---|---|---|---|
| Pasta (g) | 100 | 10.8 | 0.3 | 82.8 |
| Chicken breast (g) | 150 | 35.4 | 2.1 | 0 |
| Salad (g) | 80 | 1.44 | 0.32 | 1.76 |
| Bread (g) | 80 | 6.56 | 0.4 | 54 |
| Apple (g) | 200 | 0.4 | 0.6 | 22 |
| Total (g) | 54.6 | 3.72 | 160.56 | |
| Calories | 218.4 | 33.48 | 642.24 |
Study design
The design was a randomized, double blind, placebo controlled, crossover study (Figure 1). Participants were randomized to receive 20 mg oleuropein or 20 mg placebo immediately before lunch. The randomization was carried out by a procedure based on a random numeric sequence. Placebo and active capsules were identical in appearance and both were odourless. The quality control on both capsules was performed confirming their safety. None of the participants were receiving any vitamin or antioxidant supplements, statin or antiplatelet drugs in the month preceding the beginning of the study. Others exclusion criteria were: i) presence of malignancy; ii) presence of chronic inflammatory diseases; iii) alcohol intake; iv) smoking; v) pregnant or breast‐feeding; and vi) age <18 years. After a 10 days washout phase, participants crossed over to take the opposite intervention. Participants were assessed at baseline (T0) and 2 h after lunch (T120). Glycaemic profile, which included glucose, insulin, DPP‐4 activity and GLP‐1 and oxidative stress, which included soluble NADPH oxidase‐derived peptide (sNox2‐dp), 8‐iso‐ prostaglandin (PGF)2α and platelet p47phox phosphorylation, were analysed before and 2 h after meal. Every blood determination was performed blind.
Figure 1.
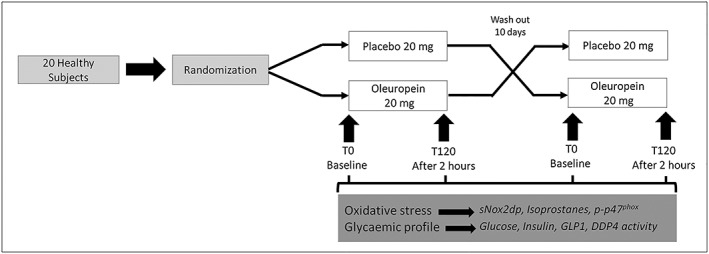
Simplified flow chart of the crossover study design
The study was conformed to the declaration of Helsinki and approved by the Ethical Committee of Sapienza University of Rome (No. 509/16).
Serum Nox2
Serum Nox2 activity was measured as sNOX2‐dp with an enzyme‐linked immunosorbent assay (ELISA) method, which was modified in comparison to that previously reported 12.
The assay is based on: 1) coating reference standards of known concentrations of sNox2‐dp and serum samples (1 μg of protein) into ELISA 96‐well plate overnight at 4°C; 2) washing away of unbound materials from samples; 3) addition in each well of anti‐sNox2‐dp‐horseradish peroxidase monoclonal antibody against the amino acidic sequence (224–268) of the extracellular membrane portion of Nox2; and 4) quantitation of immobilized antibody enzyme conjugates by monitoring horseradish peroxidase activities in the presence of the substrate 3,3′,5,5′‐tetramethylbenzidine. The enzyme activity is measured spectrophotometrically by the increased absorbency at 450 nm after acidification of formed products (2 mol l–1 sulfuric acid). Since the increase in absorbency is directly proportional to the amount of sNox2‐dp of the unknown sample, the latter can be derived by interpolation from a reference curve generated in the same assay with reference standards of known concentrations of sNox2‐dp (0–200 pg ml–1). Values were expressed as pg ml–1; intra‐assay and interassay coefficients of variation were < 10%.
8‐Iso‐PGF2α assays
Serum and platelets isoprostanes (8‐iso‐PGF2α ‐III) were measured by the enzyme immunoassay method (DRG International) and are expressed as pmol l–1. Intra‐assay and interassay coefficients of variation were < 10%.
Serum glucose and insulin concentration
Glucose and insulin were measured in serum samples using ELISA commercial Kit (Arbor Assay and DRG International, respectively). Glucose values are expressed as mg dl–1 and insulin values as μIU ml–1.
Serum GLP1 concentration
Commercial ELISA Kit (DRG International) was used for the quantitative determination of bioactive GLP1 (7–36) and (9–36) levels in serum. GLP1 values are expressed as pmol l–1.
DPP‐4 activity
DDP‐4 activity was evaluated in serum samples by a commercial assay (Sigma Aldrich). In this assay, DPP‐4 cleaves a non‐fluorescent substrate, H‐Gly‐Pro‐AMC, to release a fluorescent product, 7‐amino‐4‐methyl coumarin. DDP4 activity was expressed as μU ml–1, where one unit of DPP‐4 is the amount of enzyme that will hydrolyse the DPP‐4 substrate to yield 1.0 μmole of 7‐amino‐4‐methyl coumarin per min at 37°C.
HPLC analysis of plasma levels of HT
Stock solutions of HT were prepared at a concentration of 1 mg ml–1 in milli‐Q water and diluted to 100 μg ml–1 for working stock solution. A stock solution of 3‐(4‐hydroxyphenyl)‐propanol used as internal standard (ISTD) was prepared and diluted to 150 μg ml–1. Standard solutions were prepared in mobile phase over the range 10–1000 ng ml–1 and ISTD was spiked to achieve a constant concentration of 100 ng ml–1.
Before analysis, the samples were subjected to β‐glucuronidase treatment (an enzyme that has sulfuronidase activity) in order to cleave glucuronide and sulphate moieties.
Sodium acetate (500 μl) and β‐glucuronidase (12.5 μl) were added to 500 μl of plasma samples and incubated for 1 h at 37°C. After incubation, samples were extracted with acetonitrile‐etylacetate (1:3) and the tubes were mixed at 100 cycles min–1 for 30 min and centrifuged for 5 min at 300 g. The upper layer was removed and was evaporated to dryness. The residue was dissolved in 500 μl of mobile phase and 25 μl were injected into the column and analysed using an Agilent 1200 Infinity series high‐performance liquid chromatography system equipped with an Eclipse Plus C18 reversed‐phase column (4.6 × 100 mm, 5 μm) and with diode array UV–visible detector. The mobile phase consisted of acetonitrile–milli‐Q water (including 2% acetic acid; 15:85, v/v) and pH adjusted to 1.97 with 5.0 mol l–1 hydrochloric acid with a flow rate of 1.2 ml min–1.
The chromatograms were obtained according to the retention time with detection at 280 nm, at which the absorbance of HT presents a maximum. Peak identification of this compound was carried out by comparison of the retention time and its UV spectra (from 200 to 400 nm) with those of a standard.
In vitro study
Citrated blood samples were taken between 08.00 and 09.00 from healthy subjects who had fasted for at least 12 h. To obtain platelet‐rich plasma (PRP), citrated blood samples were centrifuged for 15 minutes at 180 g. To avoid leucocyte contamination, only the top 75% of the PRP was collected according to Pignatelli et al. 11. Before activation, PRP samples were incubated (20 min at 37°C) with scalar doses of HT (0.25, 0.5, 1 μg ml–1). After incubation, samples were treated with arachidonic acid (AA, 0.5 mmol l–1; Sigma Aldrich) for 10 minutes at 37°C. Supernatants and pellets were stored at –80°C for analysis of p47phox phosphorylation and isoprostanes.
Western blot analysis of p47phox phosphorylation
p47phox phosphorylation was analysed in platelets prepared as previously described 13. Platelet pellets were suspended in a 2× lysis buffer (5 mmol l–1 EDTA, 0.15 mol NaCl, 0.1 mol Tris pH 8.0, 1% triton and 10 μg ml–1 of protease and phosphatase inhibitors cocktail). Equal amounts of protein (30 μg per lane) estimated by Bradford protein assay were solubilized in a 2× Laemmli sample buffer containing 20% 2‐mercaptoethanol. Proteins were separated by sodium dodecyl sulfate–10% polyacrylamide gel electrophoresis and then electrotransferred to nitrocellulose membranes. After blocking, membranes were incubated with rabbit polyclonal anti p47phox antibody to phosphoserine (Abcam, Cambridge, UK) or mouse monoclonal anti‐β‐actin antibody (Santa Cruz Biotechnology, Dallas, TX, USA) and incubated overnight at 4°C. The membranes were then incubated with secondary antibody (Santa Cruz Biotechnology; 1:5000) and the immune complexes were detected by enhanced chemiluminescence substrate. Densitometric analysis of the bands was performed using Image J software.
Sample size
The minimum number of participants to be included in this cross‐over study was calculated considering: 1) relevant difference of postprandial sNOX2‐dp levels between the two groups (treated with oleuropein vs. placebo; after 120 minutes) ≥12 pg ml–1; 2) standard deviations (SDs) homogeneous between the groups (=11) and 3) type I error probability α = 0.05 and power 1 – β = 0.90. The minimum sample size for this crossover study was 20 subjects.
Statistical methods
Categorical variables (such as sex) are reported as counts (percentage) and continuous variables as means ± SD unless otherwise indicated. Independence of categorical variables was tested by chi‐square test. Comparisons between groups were carried out by Student t test and were replicated as appropriate with nonparametric tests [Kolmogorov–Smirnov (z) test in case of nonhomogeneous variances as verified by Levene's test]. The cross‐over study data were analysed for the assessment of treatment and period effects, by performing a split‐plot ANOVA with one between‐subject factor (treatment sequence) and two within‐subject factors (pre‐ vs post‐treatment). The analysis was performed separately to compare a meal with and without oleuropein. Results were expressed as means ± SD. Bivariate analysis was performed by Spearman rank correlation test. A value of P < 0.05 was considered statistically significant. All analyses were carried out with SPSS V.18.0 (SPSS Statistics v. 18.0, SPSS Inc., Chicago, IL, USA).
Results
Postprandial oxidative stress
Clinical characteristics of the population are reported in Table 1.
Baseline blood variables were similar in the two groups (Figure 2 Panels A‐C).
Figure 2.
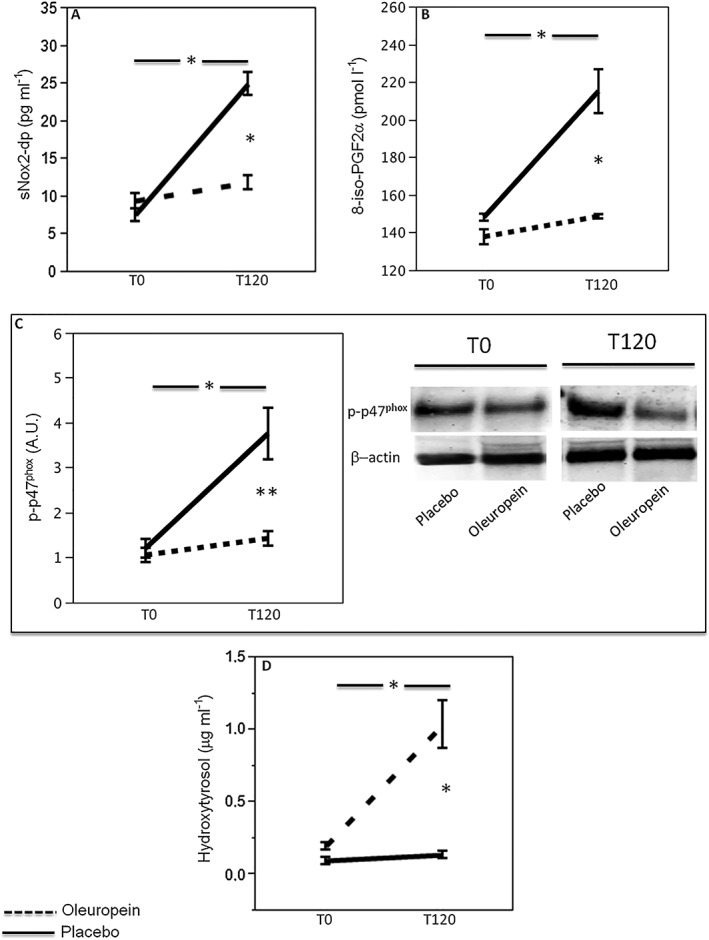
Effect of oleuropein on oxidative stress biomarkers. sNox2‐dp (n = 20; A), 8‐iso‐PGF2a (n = 20; B), platelet p47phox phosphorylation (n = 5) densitometry with a representative western blot band (C) and plasma concentration of hydroxytyrosol (D) before (T0) and 2 h after meal (T120) in healthy subjects supplemented with 20 mg oleuropein (black dotted line) or 20 mg placebo (black line; *P < 0.001; **P < 0.05)
A significant difference between the treatments (oleuropein vs placebo) was found with respect to sNox2‐dp (F = 38, P < 0.001; Figure 2A), 8‐iso‐PGF2α (F = 19, P < 0.001; Figure 2B), platelet p47phox phosphorylation (F = 12, P = 0.001; Figure 2C) and HT (F = 24, P < 0.001) from the ANOVA performed on crossover study data. Data adjusted with sphericity assumed are reported in Table S1.
Compared to baseline, placebo‐treated subjects showed increased of sNox2‐dp (226%), 8‐iso‐PGF2α (45%) and platelet p47phox phosphorylation (212%; Figure 2A–C). Conversely, compared to baseline, oleuropein‐treated subjects showed a less increase of sNox2‐dp (25%), 8‐iso‐PGF2α (8%) and platelet p47phox phosphorylation (42%; Figure 2A–C). Plasma HT was 0.12 ± 0.02 μg ml–1 at baseline and increased to 1.05 ± 0.52 μg ml–1 in oleuropein‐treated subjects; conversely, no HT changes were detected in placebo‐treated subjects (Figure 2D).
Postprandial glycaemic profile
Baseline blood variables were similar in the two groups (Figure 3). A significant difference between meal with oleuropein or placebo was found with respect to glucose (F = 5.8, P = 0.02; Figure 3A), insulin (F = 7.3, P = 0.01; Figure 3B), GLP1 (F = 62, P < 0.001; Figure 3C) and DPP‐4 activity (F = 16, P < 0.001; Figure 3D) from the ANOVA performed on crossover study data. Data adjusted with sphericity assumed are reported in Table S1.
Figure 3.
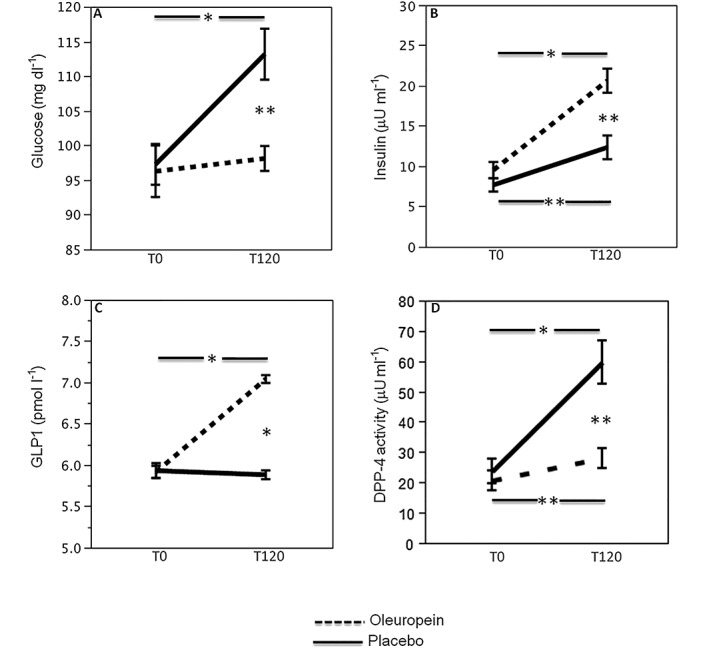
Effect of oleuropein on glycaemic profile. Blood glucose (A), insulin (B), GLP1 (C), DPP‐4 activity (D) before (T0) and 2 h after meal (T120) in healthy subjects (n = 20) supplemented with 20 mg oleuropein (black dotted line) or 20 mg placebo (black line; *P < 0.001; **P < 0.05)
Compared to baseline, placebo‐treated subjects showed increased levels of glucose (16%) and insulin (61%; Figure 3A,B); conversely, compared to baseline, in subjects given oleuropein, a lower increase of blood glucose (2%) and a more marked increase of blood insulin (116%) was observed (Figure 3A,B). Compared to baseline, GLP1 significantly increased in oleuropein‐treated subjects (19%) but did not change after placebo (–1%). Furthermore, DPP‐4 activity showed a marked increase in placebo‐treated subjects (150%) and a lower increase in oleuropein‐treated ones (35%; Figure 3C,D). Change (∆; expressed by difference of values between before and after treatment) of GLP1 correlated with ∆ of DPP‐4 activity [Spearman's rho (Rs): –0.558; P < 0.001] and ∆ insulin (Rs: 0.330; P < 0.05). ∆ of DPP‐4 activity correlated with ∆ sNox2‐dp (Rs: 0.615; P < 0.001), ∆ 8‐iso‐PGF2α (Rs: 0.33; P < 0.05) and ∆ platelet p47phox phosphorylation (Rs: 0.435; P < 0.05).
In vitro study
Platelets from healthy volunteers (n = 3, two male, one female, age 41.3 ± 9.0 years) were incubated with scalar concentrations of HT (0.25–1 μg ml–1). These doses were in the same range of blood HT concentration detected in the circulation after oleuropein administration. HT‐treated platelets stimulated with collagen showed a dose‐dependent decrease of p47phox phosphorylation and 8‐iso‐PGF2α production compared to untreated platelets (Figure 4).
Figure 4.
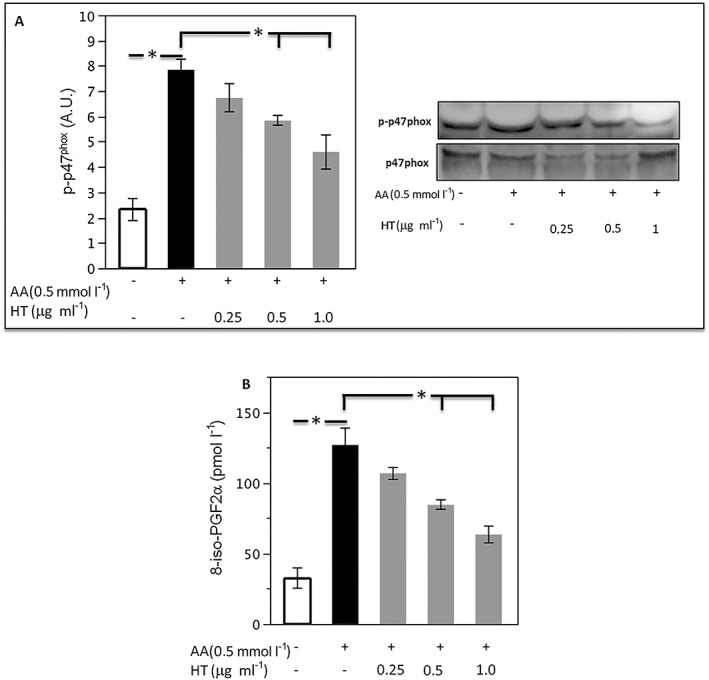
In vitro study. Platelet p47phox phosphorylation densitometry with a representative western blot band (A) and 8‐iso‐PGF2α production (B) were evaluated in platelets incubated with scalar dose of hydroxytyrosol (HT, 0.25–1 μg ml–1) and stimulated with arachidonic acid (AA, 0.5 mmol l–1; n = 3, *P < 0.05)
Discussion
The study provides evidence that oleuropein, a component of EVOO, lowers postprandial glycaemia with a Nox2‐mediated mechanism.
There is a growing body of evidence to suggest that postprandial phase is associated with an abrupt formation of reactive oxidant species (ROS), which are implicated in systemic inflammation, endothelial dysfunction and eventually cardiovascular disease 14, 15. Analysis of Nox2 activity, which is among the most important cellular producer of ROS 16, allowed us to demonstrate that postprandial formation of ROS was attributable to Nox2 activation and that 10 g EVOO counteracted this phenomenon by downregulating Nox2 activation; this effect seemed to be attributable to specific components of EVOO as corn oil was unable to protect against postprandial oxidative stress 15.
EVOO is a source of different phenolic compounds, such as tyrosol, HT and oleuropein 17, 18, 19, 20. This complex phenol exerts different biological effects; in particular, it has been found that oleuropein is a potent scavenger of oxygen free radicals 11 and nitrogen species 21 and inhibits low‐density lipoprotein oxidation 22. Oleuropein is hydrolysed in the digestive system into HT, which is then absorbed in the blood stream. Oleuropein has been identified as the most suitable precursor of HT for incorporation into foods due to its greater stability during digestion and consequently higher bioavailability 23. According to Servili et al. 24, 10 g of freshly olive stoning includes approximately 20 mg oleuropein, which was, therefore, administered to healthy subjects to assess if it was responsible for the antioxidant and glycaemic properties of EVOO. In particular, we showed that 20 mg of oleuropein downregulated Nox2 activation, as demonstrated by the reduction of sNox2‐dp and platelet p47phox phosphorylation, the cytosolic subunit of Nox2 that activates the catalytic site after translocation to the cell membrane 23; moreover, the reduction of oxidative stress was corroborated by a decreased production of 8‐iso‐PGF2α.
ROS formation during the postprandial phase may have potential deleterious effect on glycaemic metabolism as ROS interfere with incretin production by the gastrointestinal tract. Thus, the incretins GLP1 and GIP are secreted by distal small intestine in response to its stimulation bind receptors in the endocrine pancreas so eliciting insulin secretion and lowering postprandial blood glucose 24. ROS are important regulator of this phenomenon by activating DPP‐4, which rapidly inactivates incretin activity so impairing insulin secretion 25, 26. Supplementation of a meal with 10 g EVOO had positive effects on postprandial glycaemic profile as it was associated with an increase of incretins coincidentally with a decrease of DPP‐4 activity; this led to the suggestion that EVOO behaves as a DPP‐4 inhibitor and that EVOO was responsible for improved postprandial glycaemia via an oxidative stress‐mediated mechanism and eventually incretin upregulation 5. Based on this, we investigated if oleuropein shared similar effects on incretins and eventually glycaemic profile. To address this issue, we compared the effect of 20 mg oleuropein vs. placebo on postprandial glycaemic profile of healthy subjects and documented that oleuropein treatment was associated with an average 14 mg dl–1 reduction of glucose. As this effect was coincident with a significant increase of insulin, we speculated that oleuropein could be responsible for incretin upregulation. In accordance with this, blood activity of GLP1 was increased after oleuropein treatment while DPP‐4 activity decreased suggesting that oleuropein might behave as a DDP4 inhibitor via lowering Nox2‐derived oxidative stress.
To investigate the antioxidant effect observed after oleuropein administration, we measured the circulating levels of HT, which is a result of oleuropein biotransformation in the human body and is characterized by free radical scavenging 27. Thus, we performed in vitro study using platelets as a cellular source of Nox2‐derived ROS and demonstrated that HT‐treated platelets stimulated with collagen displayed impaired Nox2‐derived oxidative stress as documented by lowered p47phox phosphorylation and isoprostane production.
The study has implications and limitations. The fact that oleuropein reduces postprandial glycaemia provided further insight into the antidiabetic effects by EVOO, which was previously reported to lower the risk of new onset diabetes 1. The study has been performed in healthy subjects and warrants further investigation in diabetic subjects. The study is also limited by its methodological approach, which precludes analysis of oleuropein efficacy in a long‐term follow‐up.
In conclusion, oleuropein, a component of EVOO, improves postprandial glycaemia in healthy subjects via an oxidative stress‐mediated mechanism. This preliminary report warrants further investigation to see if oleuropein may be a novel candidate for improving glycaemic profile in patients with diabetes mellitus.
Competing Interests
There are no competing interests to declare.
Contributors
R.C. and F.V. designed the research, analysed data, made critical revisions to the manuscript for intellectual content and wrote the manuscript; R.S. provided raw material for the preparation of the capsules; L.L. performed the statistical analysis; C.N., V.Cam., V.Cas., M.N. and S.B. collected samples and performed the experiments; All authors read and approved the final manuscript.
Supporting information
Table S1 Tests of within‐subjects effects with sphericity assumed
Carnevale, R. , Silvestri, R. , Loffredo, L. , Novo, M. , Cammisotto, V. , Castellani, V. , Bartimoccia, S. , Nocella, C. , and Violi, F. (2018) Oleuropein, a component of extra virgin olive oil, lowers postprandial glycaemia in healthy subjects. Br J Clin Pharmacol, 84: 1566–1574. doi: 10.1111/bcp.13589.
References
- 1. Salas‐Salvadó J, Bulló M, Estruch R, Ros E, Covas MI, Ibarrola‐Jurado N, et al Prevention of diabetes with Mediterranean diets: a subgroup analysis of a randomized trial. Ann Intern Med 2014; 160: 1–10. [DOI] [PubMed] [Google Scholar]
- 2. Reboredo‐Rodríguez P, Figueiredo‐González M, González‐Barreiro C, Simal‐Gándara J, Salvador MD, Cancho‐Grande B, et al State of the art on functional virgin olive oils enriched with bioactive compounds and their properties. Int J Mol Sci 2017; 18: 668. [DOI] [PMC free article] [PubMed] [Google Scholar]
- 3. Gerber M, Hoffman R. The Mediterranean diet: health, science and society. Br J Nutr 2015; 113 (Suppl 2): S4–S10. [DOI] [PubMed] [Google Scholar]
- 4. Babio N, Toledo E, Estruch R, Ros E, Martinez‐Gonzalez MA, Castaner O, et al Mediterranean diets and metabolic syndrome status in the PREDIMED randomized trial. Can Med Assoc J 2014; 186: E649–E657. [DOI] [PMC free article] [PubMed] [Google Scholar]
- 5. Violi F, Loffredo L, Pignatelli P, Angelico F, Bartimoccia S, Nocella C, et al Extra virgin olive oil use is associated with improved post‐prandial blood glucose and LDL cholesterol in healthy subjects. Nutr Diabetes 2015; 5: e172. [DOI] [PMC free article] [PubMed] [Google Scholar]
- 6. Bozzetto L, Alderisio A, Giorgini M, Barone F, Giacco A, Riccardi G, et al Extra‐virgin olive oil reduces glycemic response to a high‐glycemic index meal in patients with type 1 diabetes: a randomized controlled trial. Diabetes Care 2016; 39: 518–524. [DOI] [PubMed] [Google Scholar]
- 7. Cavalot F, Petrelli A, Traversa M, Bonomo K, Fiora E, Conti M, et al Postprandial blood glucose is a stronger predictor of cardiovascular events than fasting blood glucose in type 2 diabetes mellitus, particularly in women: lessons from the San Luigi Gonzaga Diabetes Study. J Clin Endocrinol Metab 2006; 91: 813–819. [DOI] [PubMed] [Google Scholar]
- 8. O'Keefe JH, Gheewala NM, O'Keefe JO. Dietary strategies for improving post‐prandial glucose, lipids, inflammation, and cardiovascular health. J Am Coll Cardiol 2008; 51: 249–255. [DOI] [PubMed] [Google Scholar]
- 9. O'Keefe JH, Bell DSH. Postprandial hyperglycemia/hyperlipidemia (postprandial dysmetabolism) is a cardiovascular risk factor. Am J Cardiol 2007; 100: 899–904. [DOI] [PubMed] [Google Scholar]
- 10. Manna C, D'Angelo S, Migliardi V, Loffredi E, Mazzoni O, Morrica P, et al Protective effect of the phenolic fraction from virgin olive oils against oxidative stress in human cells. J Agric Food Chem 2002; 50: 6521–6526. [DOI] [PubMed] [Google Scholar]
- 11. Barbaro B, Toietta G, Maggio R, Arciello M, Tarocchi M, Galli A, et al Effects of the olive‐derived polyphenol oleuropein on human health. Int J Mol Sci 2014; 15: 18508–18524. [DOI] [PMC free article] [PubMed] [Google Scholar]
- 12. Pignatelli P, Carnevale R, Cangemi R, Loffredo L, Sanguigni V, Stefanutti C, et al Atorvastatin inhibits gp91phox circulating levels in patients with hypercholesterolemia. Arterioscler Thromb Vasc Biol 2010; 30: 360–367. [DOI] [PubMed] [Google Scholar]
- 13. Carnevale R, Bartimoccia S, Nocella C, Di Santo S, Loffredo L, Illuminati G, et al LDL oxidation by platelets propagates platelet activation via an oxidative stress‐mediated mechanism. Atherosclerosis 2014; 237: 108–116. [DOI] [PubMed] [Google Scholar]
- 14. Lahera V, Goicoechea M, de Vinuesa SG, Miana M, de las Heras N, Cachofeiro V, et al Endothelial dysfunction, oxidative stress and inflammation in atherosclerosis: beneficial effects of statins. Curr Med Chem 2007; 14: 243–248. [DOI] [PubMed] [Google Scholar]
- 15. Carnevale R, Pignatelli P, Nocella C, Loffredo L, Pastori D, Vicario T, et al Extra virgin olive oil blunt post‐prandial oxidative stress via NOX2 down‐regulation. Atherosclerosis 2014; 235: 649–658. [DOI] [PubMed] [Google Scholar]
- 16. Violi F, Carnevale R, Loffredo L, Pignatelli P, Gallin JI. NADPH oxidase‐2 and atherothrombosis: insight from chronic granulomatous disease. Arterioscler Thromb Vasc Biol 2017; 37: 218–225. [DOI] [PubMed] [Google Scholar]
- 17. Reboredo‐Rodríguez P, Rey‐Salgueiro L, Regueiro J, González‐Barreiro C, Cancho‐Grande B, Simal‐Gándara J. Ultrasound‐assisted emulsification‐microextraction for the determination of phenolic compounds in olive oils. Food Chem 2014; 150: 128–136. [DOI] [PubMed] [Google Scholar]
- 18. Reboredo‐Rodríguez P, Valli E, Bendini A, Di Lecce G, Simal‐Gándara J, Gallina Toschi T. A widely used spectrophotometric assay to quantify olive oil biophenols according to the health claim (EU Reg. 432/2012). Eur J Lipid Sci Technol 2016; 118: 1593–1599. [Google Scholar]
- 19. Mora‐Ruiz ME, Reboredo‐Rodríguez P, Salvador MD, González‐Barreiro C, Cancho‐Grande B, Simal‐Gándara J, et al Assessment of polar phenolic compounds of virgin olive oil by NIR and mid‐IR spectroscopy and their impact on quality. Eur J Lipid Sci Technol 2017; 119: 1600099. [Google Scholar]
- 20. Perri E, Raffaelli A, Sindona G. Quantitation of oleuropein in virgin olive oil by ionspray mass spectrometry‐selected reaction monitoring. J Agric Food Chem 1999; 47: 4156–4160. [DOI] [PubMed] [Google Scholar]
- 21. de la Puerta R, Martínez Domínguez ME, Ruíz‐Gutíerrez V, Flavill JA, Hoult JR. Effects of virgin olive oil phenolics on scavenging of reactive nitrogen species and upon nitrergic neurotransmission. Life Sci 2001; 69: 1213–1222. [DOI] [PubMed] [Google Scholar]
- 22. Carluccio MA, Siculella L, Ancora MA, Massaro M, Scoditti E, Storelli C, et al Olive oil and red wine antioxidant polyphenols inhibit endothelial activation: antiatherogenic properties of Mediterranean diet phytochemicals. Arterioscler Thromb Vasc Biol 2003; 23: 622–629. [DOI] [PubMed] [Google Scholar]
- 23. El Benna J, Han J, Park JW, Schmid E, Ulevitch RJ, Babior BM. Activation of p38 in stimulated human neutrophils: phosphorylation of the oxidase component p47phox by p38 and ERK but not by JNK. Arch Biochem Biophys 1996; 334: 395–400. [DOI] [PubMed] [Google Scholar]
- 24. Seino Y, Fukushima M, Yabe D. GIP and GLP‐1, the two incretin hormones: similarities and differences. J Diabetes Investig 2010; 1: 8–23. [DOI] [PMC free article] [PubMed] [Google Scholar]
- 25. Rhee NA, Østoft SH, Holst JJ, Deacon CF, Vilsbøll T, Knop FK. The impact of dipeptidyl peptidase 4 inhibition on incretin effect, glucose tolerance, and gastrointestinal‐mediated glucose disposal in healthy subjects. Eur J Endocrinol 2014; 171: 353–362. [DOI] [PubMed] [Google Scholar]
- 26. Smilowitz NR, Donnino R, Schwartzbard A. Glucagon‐like peptide‐1 receptor agonists for diabetes mellitus: a role in cardiovascular disease. Circulation 2014; 129: 2305–2312. [DOI] [PubMed] [Google Scholar]
- 27. Ahmad Farooqi A, Fayyaz S, Silva A, Sureda A, Nabavi S, Mocan A, et al Oleuropein and cancer chemoprevention: the link is hot. Molecules 2017; 22: 705. [DOI] [PMC free article] [PubMed] [Google Scholar]
Associated Data
This section collects any data citations, data availability statements, or supplementary materials included in this article.
Supplementary Materials
Table S1 Tests of within‐subjects effects with sphericity assumed