

Abstract
Aims
To explore if there is a difference between patients and healthcare professionals (HCPs) in time to reporting drug–adverse drug reaction (ADR) associations that led to drug safety signals.
Methods
This was a retrospective comparison of time to reporting selected drug–ADR associations which led to drug safety signals between patients and HCPs. ADR reports were selected from the World Health Organization Global database of individual case safety reports, VigiBase. Reports were selected based on drug–ADR associations of actual drug safety signals. Primary outcome was the difference in time to reporting between patients and HCPs. The date of the first report for each individual signal was used as time zero. The difference in time between the date of the reports and time zero was calculated. Statistical differences in timing were analysed on the corresponding survival curves using a Mann–Whitney U test.
Results
In total, 2822 reports were included, of which 52.7% were patient reports, with a median of 25% for all included signals. For all signals, median time to signal detection was 10.4 years. Overall, HCPs reported earlier than patients: median 7.0 vs. 8.3 years (P < 0.001).
Conclusions
Patients contributed a large proportion of reports on drug–ADR pairs that eventually became signals. HCPs reported 1.3 year earlier than patients. These findings strengthen the evidence on the value of patient reporting in signal detection and highlight an opportunity to encourage patients to report suspected ADRs even earlier in the future.
Keywords: adverse drug reaction, drug safety, patient reporting, pharmacovigilance, signal detection
What is Already Known about this Subject
Adverse drug reaction (ADR) reporting by patients has been shown to contribute to the detection of new drug safety signals.
What this Study Adds
Overall, healthcare professionals (HCPs) reported ADRs that led to drug safety signals slightly earlier than patients.
A difference in time to reporting between patients and HCPs was found for signals classified as important as well as nonimportant medical events.
A difference in time to reporting between patients and HCPs was present for reports from the USA, which has a long history of reporting ADRs by patient, but was negligible for reports from Europe, where patients were able to report since 2012, with some countries being earlier.
Analysis of the individual signals demonstrated that the difference in median time to reporting between patients and HCPs compared to the total time to signal detection was small for most signals.
Introduction
Pharmacovigilance centres around the world have an important role to monitor the safety of drugs in the postmarketing phase. They collect information about adverse drug reactions (ADRs) spontaneously reported by healthcare professionals and patients, for example by the Yellow Card Scheme in the UK. Having patients directly reporting to the national pharmacovigilance centres is relatively new in most areas of the world. In 2012 in the European Union, it became mandatory by law for countries to give patients the opportunity to report possible ADRs directly to the competent authority, although several countries introduced reporting by patients earlier 1, 2. In some countries, such as the USA, patients have already been able to report for decades. Reports from patients are a well‐established source of information in drug safety 3. Despite patient participation gaining more and more attention worldwide, this does not necessarily mean that countries have fully embraced patient reporting 4, 5. More experience and sharing of information between countries is needed to fully understand its value.
Studies already demonstrated that reports by patients positively contribute to pharmacovigilance. Patients generally give an adequate description of the course of clinical symptoms and they seem more likely to report on the impact of ADRs on their daily life compared to healthcare professionals 6, 7. Some studies found that patients are likely to report more serious ADRs compared to healthcare professionals, while others demonstrate the opposite 8, 9, 10, 11, 12. There are also studies that demonstrated no difference in seriousness between both groups 6, 7, 13, 14. Although there have been concerns about the quality of patient reports in the past, it has recently been shown that the clinical quality of information reported by patients is comparable to that of healthcare professionals 15. Concerning the detection of new drug safety signals, it was demonstrated that reports by patient are taken into account 16, 17, 18, 19. These signals include ADRs not listed in the Summary of Product Characteristics (SmPC) and new aspects of known ADRs. A recent study in the Netherlands exploring signals detected from 2010 to 2015 showed that the number of reports directly from patients in the signals rose from 16 (10% of total) in 2010 to 161 (28.3% of total) in 2015 16. There were 137 serious reports in all examined signals (30.8% of all patient reports) compared to 224 healthcare professional reports (19.2% of total reports).
Less is known about the difference in timing of reporting by patients and healthcare professionals. It has been suggested that reporting by patients contributes to an earlier detection of drug safety signals 20, 21. Indeed, a certain number of reports is necessary to generate new drug safety signals and reports by patients provide an additional source of information. In addition, patients may report earlier on certain ADRs compared to healthcare professionals; for the latter group one of the reasons for not reporting a possible ADR to a pharmacovigilance centre may be the uncertainty that it actually concerns an ADR.
Little is known about the extent to which patient reports might impact on timely signal detection and whether this is different for ADRs classified as so called important medical events (IMEs), defined as those events that result in death or require (prolonged) hospitalization, and those not classified as IMEs 22, 23. Furthermore, comparing the USA and Europe may provide additional insights given the extensive experience with patient reporting in the USA, vs. Europe where patient reporting is relatively new. In the USA there has been a relatively constant flow of patient reports over time, while in most European countries the number of patient reports continues to rise 3, 24, 25. Also, in the USA patient reports are mostly received through pharmaceutical companies, while in Europe patients mostly report directly to the national pharmacovigilance centre 2.
This study aims to explore if there is a difference between patients and healthcare professionals in time to reporting drug–ADR associations that led to drug safety signals. The secondary aims are to explore if there is a difference in time to reporting between patients and healthcare professionals for drug safety signals characterized as IMEs, and if there is a difference for reports from those regions with a long history of patient reporting (USA) vs. a region with a short history of patient reporting (Europe).
Method
Study design and data source
This was a retrospective comparison of time to reporting selected drug–ADR associations that led to drug safety signals between patients and healthcare professionals.
ADR reports were selected from the World Health Organization (WHO) global database of individual case safety reports, VigiBase. As of June 2017, this database contained over 15 million ADR reports received from over 120 member countries of the WHO programme for international drug monitoring 26.
We selected all reports of drug–ADR associations present in all drug safety signals detected by the Netherlands Pharmacovigilance Centre Lareb between 2011 and 2015. At Lareb, reports by patients were handled in the same way as those from healthcare professionals and they were fully integrated into the process of signal detection. During signal detection, qualitative aspects as well as quantitative aspects (disproportionality analysis) are taken into account 27, 28. Signals covered a wide range of different ADRs. We excluded signals on drug interactions, multiple suspected drugs, and dosing or administration errors. All signals are publicly accessible on the Lareb website 29, 30. In total, 60 signals were included in this study.
Based on the drug–ADR associations present in the selected signals, ADR reports were selected from a frozen VigiBase version as of October 2015. Selection of reports in VigiBase was based on the WHO drug classification system, the ATC‐5 code or the drug's brand name 31 and the Medical Dictionary for Regulatory Activities MedDRA Preferred term coding 32, depending on the drug–ADR association described in the signal. The drug needed to be classified as ‘suspected’ or ‘interacting’ on the reports. Reports had to be filed in the database before dissemination of the drug safety signals.
Only reports that had the E2B structure, an international standard for transmitting ADR reports, were included. Only reports that were either pure patient reports (E2B reports with a single reporter whose qualification was Consumer or other non‐health professional) or pure healthcare professional reports (E2B reports with a single reporter whose qualification was Physician, Pharmacist or Other health professional) were included. There was no exclusion of duplicate reports; in case the event had been reported by different sources, these were all take into account.
We only included data from countries if they accepted reports from patients at the time of the first report for the specific drug–ADR association in VigiBase. Start date of patient reporting in the specific countries was obtained from literature 2 or through personal contacts with the national pharmacovigilance centres. This was to ensure that countries not only formally accepted patient reports but actually did so in practice. We excluded data from countries with no patient reports in VigiBase. See Figure 1 for a flowchart of the Methods of data collection.
Figure 1.

Flowchart of the methods of data collection. Signals' exclusion criteria concerned: drug interactions, multiple suspected drugs, and dosing or administration errors. ADR, adverse drug reaction; IME, important medical event
Outcomes
The primary outcome was the difference in time to reporting between patients and healthcare professionals. The secondary outcomes were the differences in time to reporting between patients or healthcare professionals for (i) IMEs vs. non‐IMEs, according to the European Medicines Agency (EMA)‐list of Important Medical Events, according to MedDRA terminology 18, and (ii) for the USA vs. Europe. For Europe, we included countries within the European Union, as well as Iceland and Norway because they participate in EMA regulatory decision making. Although Switzerland does not participate in EMA regulatory decision making, this country accepts reports directly from patients since 2002 and share a similar culture with the rest of Europe. For this reason, we decided to take Switzerland into account as well.
Analysis
The date of the first report for each individual signal was used as time zero. All reports on the same drug–ADR association from time zero until signal detection were included. We calculated the difference in time between time zero and the following reports from patients and healthcare professionals for each signal individually. Subsequently, data for all signals were pooled. The percentage of reports originating from patients was calculated and it was determined whether a healthcare professional or a patient made the first report for each signal.
Kaplan–Meier plots were used to visualize the reporting over time by patients and healthcare professionals, respectively. Statistical differences in time to reporting between patients and healthcare professionals were explored on the corresponding survival curves using Mann–Whitney U tests. To investigate the secondary outcomes, subanalyses were made for signals classified as (non‐)IMEs and reports from the USA and Europe. In addition, time to reporting was analysed for healthcare professionals in the USA vs. Europe, and patients in the USA vs. Europe. Statistical significance was based on a P value <0.05. Data were analysed using the statistical software program SPSS Statistics, version 22.0 (SPSS, Chicago, IL, USA).
There may be a large difference between reporting of the first report and the time to signal detection for the individual signals. To explore the meaning of the obtained difference in time to reporting between patients and healthcare professionals, relative differences defined as the difference in median time to reporting by patients and healthcare professionals divided by the total time until signal detection, were analysed. The difference in median between both groups was plotted against the total number of days until signal detection. For calculating the median, all signals with at least three patients and three healthcare professional reports were included.
Results
Characteristics of included signals
In total, 60 signals were included (Table 1). The median time to signal detection, calculated from the date of the first report for each individual signal, was 10.4 years, with an interquartile range of 7.6–13.6 years. The signals included a total number of 2822 reports, of which 1488 (52.7%) were reported by patients and 1334 (47.3%) by healthcare professionals. The proportion of patient reports in the individual signals ranged from 0% to 84.4%, with a median of 25.0%. A total of 13 signals (21.7%) did not contain any reports from patients. For 12 signals (20.0%), the first report was made by a patient, for 48 (80.0%) by a healthcare professional.
Table 1.
Description of the 60 drug safety signals
| Drug | ADR | Total number of reports | Number of healthcare professional reports | Number of patient reports | Mann–Whitney U test, P value | Ratio a |
|---|---|---|---|---|---|---|
| Signals with ADRs classified as IMEs | ||||||
| Olanzapine | Cerebrovascular accident | 185 | 83 | 102 | 0.058 | 0.06 |
| Ciclosporin | Posterior reversible encephalopathy syndrome | 127 | 98 | 29 | 0.126 | –0.08 |
| Gabapentin | Blood glucose decreased and hypoglycaemia | 76 | 58 | 18 | 0.026 | 0.39 |
| Aripiprazole | Hypothyroidism | 28 | 14 | 14 | 0.016 | 0.68 |
| Natalizumab | Cervical dysplasia | 17 | 14 | 3 | 0.591 | n.a. |
| Medroxyprogesterone | Injection site necrosis and injection site atrophy | 30 | 28 | 2 | 1.00 | n.a. |
| Proguanil hydrochloride/Atovaquone | Psychotic disorder | 11 | 9 | 2 | 0.036 | n.a. |
| Aripiprazole | Psychosis aggravated | 13 | 12 | 1 | 0.667 | n.a. |
| Clindamycin | Acute generalised exanthematous pustulosis | 8 | 7 | 1 | 0.250 | n.a. |
| Ceftriaxone | Hepatitis | 15 | 14 | 1 | 0.400 | n.a. |
| Clarithromycin | Angioedema | 26 | 25 | 1 | 0.077 | n.a. |
| Hydroquinine | Hypoglycaemia | 2 | 1 | 1 | 1.00 | n.a. |
| Iobitridol | Ventricular fibrillation | 1 | 1 | 0 | n.a. | n.a. |
| Adalimumab | Neuroendocrine carcinoma of the skin | 5 | 5 | 0 | n.a. | n.a. |
| Nitrofurantoin | Cutaneous vasculitis | 1 | 1 | 0 | n.a. | n.a. |
| Tocilizumab | Necrotising fasciitis | 6 | 6 | 0 | n.a. | n.a. |
| Omeprazole | Subacute cutaneous lupus erythematosus | 4 | 4 | 0 | n.a. | n.a. |
| Signals with ADRs classified as non‐IMEs | ||||||
| Fumaric acid | Progressive multifocal leucoencephalopathy | 2 | 2 | 0 | n.a. | n.a. |
| Lamotrigine | Alopecia | 453 | 88 | 365 | 0.912 | n.a. |
| Paroxetine | Migraine | 176 | 35 | 141 | 0.002 | –0.10 |
| Tamsulosin | Vision blurred, visual acuity reduced and visual impairment | 151 | 39 | 112 | 0.250 | 0.05 |
| Escitalopram | Headache | 235 | 128 | 107 | 0.140 | 0.06 |
| Fluticasone | Palpitations | 118 | 19 | 99 | 0.568 | –0.01 |
| Quetiapine | Paraesthesia | 165 | 84 | 81 | <0.001 | 0.20 |
| Lamotrigine | Nightmare | 77 | 12 | 65 | 0.099 | –0.16 |
| Levonorgestrel | Galactorrhoea | 75 | 23 | 52 | 0.228 | 0.07 |
| Quetiapine | Sleep apnoea syndrome | 69 | 31 | 38 | 0.062 | 0.10 |
| Omeprazole | Faeces discoloured | 54 | 17 | 37 | <0.001 | 0.35 |
| Isotretinoin | Erectile dysfunction | 59 | 28 | 31 | 0.331 | 0.12 |
| Tamsulosin | Dry mouth | 49 | 21 | 28 | 0.437 | –0.05 |
| Rivastigmine | Nightmare and abnormal dreams | 33 | 13 | 20 | 0.137 | 0.20 |
| Tamsulosin | Depression and depressed mood | 30 | 12 | 18 | 0.368 | 0.08 |
| Doxycycline | Paraesthesia | 49 | 32 | 17 | 0.179 | –0,15 |
| Sitagliptin | Dyspnoea | 135 | 121 | 14 | <0.001 | 0,25 |
| Dutasteride | Testicular pain | 20 | 6 | 14 | 0.659 | –0,11 |
| Metronidazole | Oedema peripheral | 35 | 24 | 11 | 0.958 | 0,00 |
| Doxycycline | Skin discolouration, skin hyperpigmentation and pigmentation disorder | 18 | 8 | 10 | 0.122 | 0,09 |
| Terbinafine | Anosmia, parosmia, hyposmia | 43 | 36 | 7 | 0.392 | –0,14 |
| Trazodone | Urinary incontinence | 24 | 18 | 6 | 1.00 | –0,56 |
| Isotretinoin | Anal fissure | 15 | 9 | 6 | 0.864 | –0,12 |
| Omeprazole | Erectile dysfunction | 14 | 9 | 5 | 0.518 | 0,01 |
| Azathioprine | Chromaturia | 12 | 8 | 4 | 0.683 | 0,16 |
| Metronidazole | Tongue discolouration | 8 | 4 | 4 | 1.00 | 0.06 |
| Azathioprine | Photosensitivity reaction | 13 | 9 | 4 | 0.825 | 0,04 |
| Tramadol | Anorgasmia | 6 | 2 | 4 | 0.267 | n.a. |
| Fluconazole | Drug eruption | 31 | 28 | 3 | 0.875 | 0.04 |
| Tramadol | Hiccups | 12 | 9 | 3 | 0.282 | 0.04 |
| Methylphenidate | Epistaxis | 19 | 17 | 2 | 0.140 | n.a. |
| Pandemrix | Injection site discolouration | 4 | 3 | 1 | 1.00 | n.a. |
| Duloxetine | Electric shock sensation | 6 | 5 | 1 | 0.667 | n.a. |
| Lenalidomide | Psoriasis | 4 | 3 | 1 | 1.00 | n.a. |
| Mirtazapine | Urinary retention | 27 | 26 | 1 | 0.296 | n.a. |
| Nadroparin | Headache | 10 | 9 | 1 | 0.200 | n.a. |
| Terbinafine | Hyperacusis | 1 | 1 | 0 | n.a. | n.a. |
| Desloratadine | Increased appetite | 3 | 3 | 0 | n.a. | n.a. |
| Mercaptopurine | Photosensitivity reaction | 2 | 2 | 0 | n.a. | n.a. |
| Buprenorphine | Skin depigmentation | 2 | 2 | 0 | n.a. | n.a. |
| Prednisolone | Hiccups | 4 | 4 | 0 | n.a. | n.a. |
| Betahistine | Hallucination | 2 | 2 | 0 | n.a. | n.a. |
| Terbinafine | Erectile dysfunction | 3 | 3 | 0 | n.a. | n.a. |
Signals are sorted from IME signals to non‐IME signals. And within the IME and non‐IME signals they are sorted from highest to number of patient reports to lowest.
Ratio calculated by: the difference in median days between reports by patients and healthcare professionals divided to the number of days until signal detection
Signals in italic: classified as important medical events (IMEs)
Signals in bold: first ADR reports was made by a patient.
In case of P < 0.05 the group of reporters that reported earlier is made bold.
ADR, adverse drug reaction; n.a., not applicable
A total of 18 (30.0%) signals were classified as IME (Table 1, signals in italic) 18. Overall, IMEs included fewer reports from patients compared to healthcare professionals, range 0–55.1% (median of 7.2%) vs. non‐IMEs 0–84.4% (median of 34.0%). The first report was made by a patient for four IMEs (22.2%) and eight non‐IMEs (19.0%).
Patient reports were from 24 different countries: Belgium, Bulgaria, Canada, the Democratic Republic of the Congo, Croatia, Czech Republic, Denmark, Estonia, France, Germany, Greece, Hungary, Iceland, Morocco, the Netherlands, Norway, Peru, Portugal, Slovakia, Sweden, Switzerland, Turkey, UK and USA. A total of 2124 reports came from the USA (61.9% patient reports) and 430 from Europe (21.9% patient reports) and 268 from non‐European countries. For reports from the USA, 26.8% of the healthcare professional reports were classified as IMEs and 7.2% of the patient reports. For reports from Europe, 25.4% of the healthcare professional reports were classified as IMEs, and 37.2% of the patient reports.
Comparison in time to reporting
The overall cumulative distribution of time to reporting of patients and healthcare professionals is shown in Figure 2. The corresponding Mann–Whitney U test suggested that there was a statistically significant difference between these distributions (P < 0.001) Healthcare professionals generally reported earlier than patients with a median time to reporting of 7.0 vs. 8.3 years, and corresponding interquartile ranges of respectively 3.9–9.5 and 6.2–10.4 years. For IMEs, healthcare professionals and patients took a median time to reporting of 6.9 vs. 8.1 years and for non‐IMEs 7.0 vs. 8.2 years (Figure 3a, b). In both cases, there was an overall statistically significant difference in the time distribution (P < 0.001). The cumulative distributions of reports from the USA and Europe are shown in Figure 4a, b. For the USA, median time to reporting for healthcare professionals and patients was 6.0 vs. 8.1 years and for Europe 7.8 vs. 7.9 years. The corresponding tests for distribution differences were both significant, P < 0.001 and P = 0.03, respectively. In addition, healthcare professionals in the USA reported earlier compared to those in Europe (P < 0.001). For patients, no statistically significant difference was shown (P = 0.531).
Figure 2.

The cumulative distribution of time of adverse drug reaction (ADR) reports, after the first ADR report, coming from patients and healthcare professionals, Mann–Whitney U P < 0.001
Figure 3.

The cumulative distribution of time of adverse drug reaction (ADR) reports, after the first ADR report, coming from patients and healthcare for: a) important medical events, Mann–Whitney U P < 0.001, b) non‐ important medical events, Mann–Whitney U P value of <0.001
Figure 4.
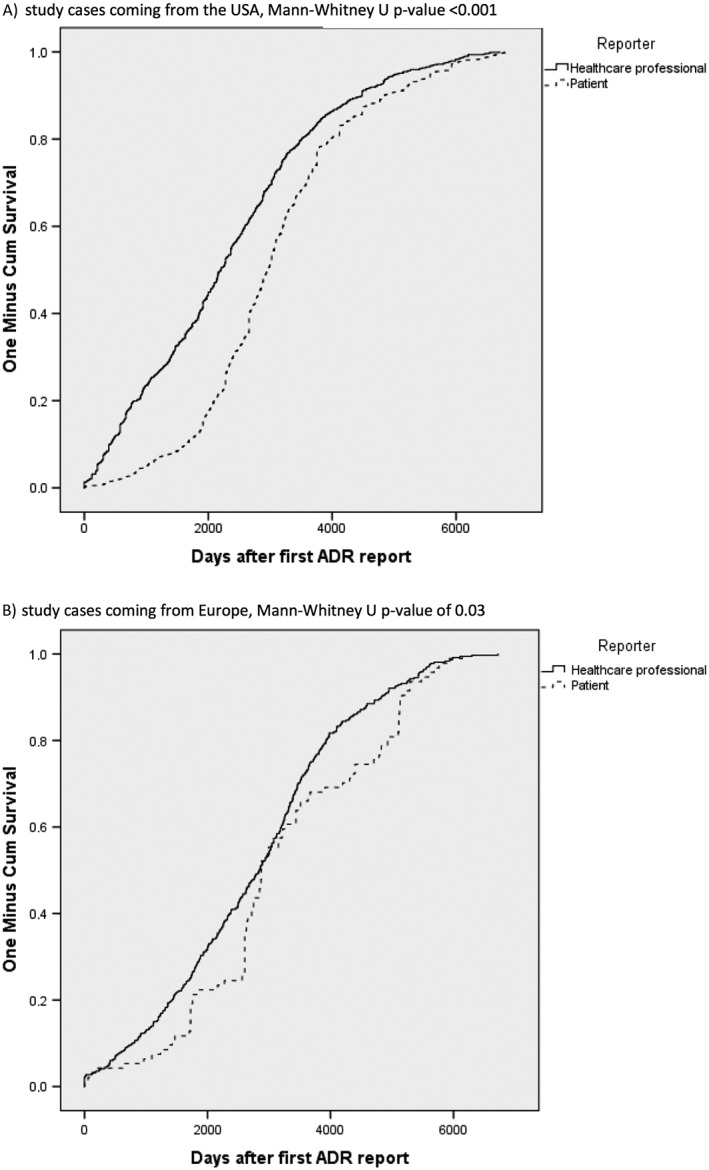
The cumulative distribution of time of adverse drug reaction (ADR) reports, after the first ADR reports, coming from patients and healthcare for: a) study cases coming from the USA, Mann–Whitney U P < 0.001, b) study cases coming from Europe, Mann–Whitney U P = 0.03
Individual signals
The analysis of the individual signals showed that for seven signals a statistically significant difference in time to reporting between the two groups was present (Table 1). For two of these signals, patients reported significantly earlier than healthcare professionals: ‘paroxetine associated with migraine’ (P = 0.002) and ‘proguanil hydrochloride/atovaquone associated with psychotic disorder’ (P = 0.036).
To explore the meaning of the differences in time to reporting between patients and healthcare professionals, the difference in median days between reports by patients and healthcare professionals divided by the number of days until signal detection, was plotted against the number of days until signal detection (see Figure 5). A positive ratio means earlier reporting by healthcare professionals and a negative ratio earlier reporting by patients. The ratio‐lines in the figure give an indication of the meaning of the difference in median between both groups. A small ratio in combination with a high number of days until signal detection indicated little clinical relevance, while a high ratio in combination with a small number of days until signal detection indicated a higher level of clinical relevance. In total, 34 signals were included in the scatter plot; of those, five were classified as IMEs and 29 as non‐IMEs. 19 out of 34 signals had a ratio between –0.1 and 0.1; three of those signals were classified as IMEs and 16 as non‐IMEs. For one signal, there was no difference between patients and healthcare professionals, for 11 signals, patients reported earlier and for 22 healthcare professionals reported earlier. For patients, there was one signal with a ratio of less than –0.3. For healthcare professionals, there were three signals with a ratio over 0.3, including two classified as IMEs.
Figure 5.

Scatterplot of the difference in median days between reports by patients and healthcare professionals divided by the number of days until signal detection, plotted against the number of days until signal detection. Closed bullet = signal classified as non‐IME; open bullet = signal classified as IME, The ratio was calculated by the difference in median divided to the number of days until signal detection. A positive ratio means earlier reporting by healthcare professionals and a negative ratio earlier reporting by patients
Discussion
With the increasing interest in patients as stakeholders in pharmacovigilance, it is important to explore the impact of patient reporting on early detection of new drug safety signals in pharmacovigilance. We demonstrated that ADRs that led to drug safety signals were generally reported earlier by healthcare professionals than patients, with an overall median difference of 1.3 years. This difference was present for ADRs classified as IMEs as well as non‐IMEs. Although a difference in timing between both groups was present for the USA, the difference was negligible for Europe. The ratios in time to reporting were small, indicating that the difference in time to reporting ADRs between patients and healthcare professionals had limited impact on the overall time to signal detection for most signals.
It has been suggested that patient reports might enable earlier signal detection 20, 21. In 1996, Egberts et al. 21 compared information obtained from patients and healthcare professionals on the, at the time, new antidepressant paroxetine. At that time in the Netherlands, patients were not yet able to report directly to the pharmacovigilance centre but could consult a telephone medicines information service maintained by pharmacists. Comparing the timing of reports by healthcare professionals to the national pharmacovigilance centre with questions by patients to the telephone service, showed that patients posted questions to this telephone service earlier as compared to healthcare professionals, with a mean time lag for all suspected reactions of 229 days. Hammond et al. 33 explored time to signal detection for four randomly selected GlaxoSmithKline marketed drugs, for reports of patients and healthcare professionals combined and as separate groups. Using disproportionality analysis, 23 signals of disproportionate reporting were identified, of which 52.2% (12 of 23) at an earlier stage when the patient reports were included, 34.8% (eight of 23) in the same year and 13% (three of 23) later when patient reports were included. The aforementioned studies focussed on time‐aspects of statistical drug–ADR reporting associations not necessarily representing safety signals. To our knowledge, including actual drug safety signals to compare time to reporting between patients and healthcare professionals has not been explored before.
To find a new drug safety signal, a certain number of reports is necessary. The introduction of direct patient reporting introduced a growth in the number of reports by patients. This growth also reflects in the amount of patient reports that contributed to new drug safety signals 16. In the current study, we found a relatively high proportion of patient reports in the included signals; 52.7% of all reports and a range of 0% to 84.4% for the individual signals. Reports by patients are more represented in ADRs classified as non‐IMEs than IMEs; range of 0–84.4% vs. 0–55.1% respectively. Analysing signals individually, we demonstrated that, for some, patients were earlier in reporting and, for others, healthcare professionals were earlier. It is therefore plausible that reports by patients can contribute to earlier signal detection. There are some points to consider concerning the data used for this study. In our study, >60% of the reports from the USA originated from patients. This was higher than in another analysis from the USA, which showed that from 2006 to 2014 an average of 47% of all reports were from patients 3. This may be explained by the nature of the selected signals. It was furthermore striking that the percentage reports classified as IME was higher for patient reports from Europe compared to those coming from the USA. The percentage of IMEs included in all patient reports was in line with previous results of a study on Dutch drug safety signals by van Hunsel et al. 16. They showed that of all reports by patients that contributed to a signal in the Netherlands from 2010 to 2015, 30.5% included an ADR classified as IME. This was a higher percentage than reports by healthcare professionals (22.5%) 16.
By selecting reports from the international database VigiBase, we could include a high number of reports which allowed us to analyse signals by importance of the event and by region of origin. It must be kept in mind that data pooling can influence the outcome. On average, the median time to signal detection, calculated from time zero, was 10.4 years. Given the large variation in number of reports per signal, signals with many reports contributed to a larger extent to the overall outcome. To place our results in perspective, we therefore also explored all signals individually.
The reporting rate may vary over time and may differ between patients and healthcare professionals. It can be influenced by factors, such as media attention or discussions on the internet 34, 35. As far as we know, there was no specific media attention for the drug–ADR associations included in our study, but differences in timing due to external factors cannot be ruled out. In addition, for Europe due to changes in the pharmacovigilance legislation in 2012 it is possible that this legal change caused a steeper growth in patient reporting compared to healthcare professional reporting. This may have contributed to the difference in time to reporting we found between healthcare professional reports from the USA vs. Europe.
Conclusion
Patients contributed a large proportion of reports on drug–ADR pairs that eventually became drug safety signals; 53% overall, with a median of 25%. This corroborates earlier findings on the contribution of patient reports to signal detection in pharmacovigilance. For all signals, median time to signal detection was 10.4 years. Healthcare professionals generally reported 1.3 years earlier than patients. This was the case for ADRs classified as IMEs as well as non‐IMEs. This highlights an opportunity to further increase the value of patient reporting in the future, by encouraging patients to report suspected ADRs earlier.
Competing Interests
The authors have no competing interests to declare.
The authors are indebted to the national centres who make up the WHO Programme for International Drug Monitoring and contribute reports to VigiBase. However, the opinions and conclusions of this study are not necessarily those of the various centres nor of the WHO.
Rolfes, L. , van Hunsel, F. , Caster, O. , Taavola, H. , Taxis, K. , and van Puijenbroek, E. (2018) Does patient reporting lead to earlier detection of drug safety signals? A retrospective comparison of time to reporting between patients and healthcare professionals in a global database. Br J Clin Pharmacol, 84: 1514–1524. doi: 10.1111/bcp.13576.
References
- 1. The EU Pharmacogivilance system [online]. 2015. Available from: http://ec.europa.eu/health/human-use/pharmacovigilance/index_en.htm (last accessed 12 October 2016)
- 2. van Hunsel F, Härmark L, Pal S, Olsson S, van Grootheest K. Experiences with adverse drug reaction reporting by patients; an 11‐country survey. Drug Saf 2012; 35: 45–60. [DOI] [PubMed] [Google Scholar]
- 3. Food and Drug Administration . FAERS reporting by healthcare providers and consumers by year. 2016. Available from: http://www.fda.gov/Drugs/GuidanceComplianceRegulatoryInformation/Surveillance/AdverseDrugEffects/ucm070456.htm (last accessed 23 December 2016)
- 4. The EU Pharmacogivilance system [online]. 2012. Available from: http://ec.europa.eu/health/human-use/pharmacovigilance/index_en.htm (last accessed 28 March 2017)
- 5. Harmark L, Raine J, Leufkens H, Edwards IR, Moretti U, Sarinic VM, et al Patient‐reported safety information: a renaissance of pharmacovigilance? Drug Saf 2016; 39: 883–890. [DOI] [PubMed] [Google Scholar]
- 6. Aagaard L, Nielsen LH, Hansen EH. Consumer reporting of adverse drug reactions: a retrospective analysis of the Danish adverse drug reaction database from 2004 to 2006. Drug Saf 2009; 32: 1067–1074. [DOI] [PubMed] [Google Scholar]
- 7. de Langen J, van Hunsel F, Passier A, De Jong‐van den Berg LTW, van Grootheest AC. Adverse drug reaction reporting by patients in the Netherlands, three years of experience. Drug Saf 2008; 31: 515–524. [DOI] [PubMed] [Google Scholar]
- 8. Chebane L, Abadie D, Bagheri H, Durrieu G, Montastruc J. Patient reporting of adverse drug reactions; experience of Toulouse regional pharmacovigilance center (abstract ISOP 2012). Drug Saf 2012; 35: 877–970. [Google Scholar]
- 9. Clothier HJ, Selvaraj G, Easton ML, Lewis G, Crawford NW, Buttery JP. Consumer reporting of adverse events following immunization. Hum Vaccin Immunother 2014; 10: 3726–3730. [DOI] [PMC free article] [PubMed] [Google Scholar]
- 10. Durrieu G, Palmaro A, Pourcel L, Caillet C, Faucher A, Jacquet A, et al First French experience of ADR reporting by patients after a mass immunization campaign with influenza A (H1N1) pandemic vaccines: a comparison of reports submitted by patients and healthcare professionals. Drug Saf 2012; 35: 845–854. [DOI] [PubMed] [Google Scholar]
- 11. McLernon DJ, Bond CM, Hannaford PC, Watson MC, Lee AJ, Hazell L, et al Adverse drug reaction reporting in the UK: a retrospective observational comparison of yellow card reports submitted by patients and healthcare professionals. Drug Saf 2010; 33: 775–788. [DOI] [PubMed] [Google Scholar]
- 12. van Grootheest A, Passier J, van Puijenbroek E. Direct reporting of side effects by the patient: favourable experience in the first year (article in Dutch). Ned Tijdschr Geneeskd 2005; 149: 529–533. [PubMed] [Google Scholar]
- 13. Leone R, Moretti U, D'Incau P, Conforti A, Magro L, Lora R, et al Effect of pharmacist involvement on patient reporting of adverse drug reactions: first Italian study. Drug Saf 2013; 36: 267–276. [DOI] [PubMed] [Google Scholar]
- 14. Rolfes L, van Hunsel F, Wilkes S, van Grootheest K, van Puijenbroek E. Adverse drug reaction reports of patients and healthcare professionals‐differences in reported information. Pharmacoepidemiol Drug Saf 2014; 24: 152–158. [DOI] [PubMed] [Google Scholar]
- 15. Rolfes L, van Hunsel F, van der Linden L, Taxis K, van Puijenbroek E. The quality of clinical information in adverse drug reaction reports by patients and healthcare professionals: a retrospective comparative analysis. Drug Saf 2017; 40: 607–614. [DOI] [PMC free article] [PubMed] [Google Scholar]
- 16. van Hunsel F, de Waal S, Harmark L. The contribution of direct patient reported ADRs to drug safety signals in the Netherlands from 2010 to 2015. Pharmacoepidemiol Drug Saf 2017. May 19; 26: 977–983. [DOI] [PubMed] [Google Scholar]
- 17. Foy M, Gandhi S, Cumber S, Jadeja MM. The yellow card scheme: patient reporting of adverse drug reactions and signals they have generated (abstract OP40). Drug Saf 2011; 34: 903. [Google Scholar]
- 18. Hazell L, Cornelius V, Hannaford P, Shakir S, Avery AJ. How do patients contribute to signal detection? A retrospective analysis of spontaneous reporting of adverse drug reactions in the UK's Yellow Card Scheme. Drug Saf 2013; 36: 199–206. [DOI] [PubMed] [Google Scholar]
- 19. Kheloufi F, Default A, Rouby F, Blin O, Micallef J. Comment on “Patient reporting in the EU: analysis of EudraVigilance data”. Drug Saf 2017; 40: 935–936. [DOI] [PubMed] [Google Scholar]
- 20. Mitchell AS, Henry DA, Sanson‐Fisher R, O'Connell DL. Patients as a direct source of information on adverse drug reactions. BMJ 1988; 297: 891–893. [DOI] [PMC free article] [PubMed] [Google Scholar]
- 21. Egberts TC, Smulders M, de Koning FH, Meyboom RH, Leufkens HG. Can adverse drug reactions be detected earlier? A comparison of reports by patients and professionals. BMJ 1996; 313: 530–531. [DOI] [PMC free article] [PubMed] [Google Scholar]
- 22. European Medicines Agency . Inclusion/exclusion criteria for the “Important Medical Events” list. http://www.ema.europa.eu/docs/en_GB/document_library/Other/2016/08/WC500212100.pdf 2016. August 16 (last accessed 22 February 2017)
- 23. European Medicines Agency . Important medical event term list (MedDRA version 19.1). http://www.almp.hr/fdsak3jnFsk1Kfa/ostale_stranice/IME-List-19-1.xlsx 2016. September 2 (last accessed 15 October 2016).
- 24. European Commission . Pharmacovigilance related activities of Member States and the European Medicines Agency concerning medicinal products for human use (2012–2014). 2016. August 8 Available from: http://ec.europa.eu/health/sites/health/files/files/pharmacovigilance/pharmacovigilance-report-2012-2014_en.pdf (last accessed 8 February 2017).
- 25. Banovac M, Candore G, Slattery J, Houyez F, Haerry D, Genov G, et al Patient reporting in the EU: analysis of EudraVigilance data. Drug Saf 2017; 40: 629–645. [DOI] [PubMed] [Google Scholar]
- 26. Uppsala Monitoring Centre . http://www.who-umc.org/ 2016. (last accessed 1 January 2016).
- 27. Rolfes L, Kolfschoten J, van Hunsel F, van Puijenbroek E. The validity and reliability of a signal impact assessment tool. Pharmacoepidemiol Drug Saf 2016. Jul; 25 (7): 815–819. [DOI] [PubMed] [Google Scholar]
- 28. Watson S, Chandler RE, Taavola H, Harmark L, Grundmark B, Zekarias A, et al Safety concerns reported by patients identified in a collaborative signal detection workshop using VigiBase: results and reflections from Lareb and Uppsala Monitoring Centre. Drug Saf 2017; 41: 203–212. [DOI] [PMC free article] [PubMed] [Google Scholar]
- 29. Netherlands Pharmacovigilance Centre Lareb . Quarterly report 2012–3, overview on generated pharmacovigilance signals and the actions of Lareb and the MEB. 2012.
- 30. Rolfes L, Kolfschoten J, van Hunsel F, Kooijman M, van Puijenbroek E. Actions in response to drug safety signals arising from a spontaneous reporting system: retrospective study in the Netherlands. Int J Risk Saf Med 2016; 28: 115–123. [DOI] [PubMed] [Google Scholar]
- 31. WHO Collaborating Centre for Drug Statistics Methodology‐Norwegian Institute of Public Health . ATC‐structure and principles. 2011. March 25. Available from: https://www.whocc.no/atc/structure_and_principles/ (last accessed 22 March 2017).
- 32. Medical Dictonary for Regulatory Activities . 2017. Available from: http://www.meddra.org/ (last accessed 22 March 2017).
- 33. Hammond IW, Rich DS, Gibbs TG. Effect of consumer reporting on signal detection: using disproportionality analysis. Expert Opin Drug Saf 2007; 6: 705–712. [DOI] [PubMed] [Google Scholar]
- 34. van Hunsel F, Passier A, van Grootheest AC. Comparing patients' and healthcare professionals' ADR reports after media attention: the broadcast of a Dutch television programme about the benefits and risks of statins as an example. Br J Clin Pharmacol 2009; 67: 558–564. [DOI] [PMC free article] [PubMed] [Google Scholar]
- 35. Netherlands Pharmacovigilance Centre Lareb . Overview of reports of adverse drug reactions associated with changes of the package of Thyrax® (levothyroxine) from a bottle to a blister. http://www.lareb.nl/Signalen/KWB_2014_4_Thyrax_bottle_2 2015. November 1 (last accessed 16 June 2015).