

Introduction
The first administration of a new compound in humans is an important milestone. A major source of information for the researcher is the investigator's brochure (IB). Such a document, has a size of several hundred pages. The IB should enable investigators or regulators to independently assess the risk–benefit of the proposed trial but the size and complexity makes this difficult. This article offers a practical tool for the integration and subsequent communication of the complex information from the IB or other relevant data sources. This paper is accompanied by an accessible software tool to construct a single page colour coded overview of preclinical and clinical data.
The tool
In practice, the way in which all the preclinical information provided in the IB is handled and interpreted is left to professional discretion of investigators and regulators. This lack of transparency may have contributed to the oversight in the trials with TGN1412 and BIAL 1, 2.
The use of preclinical information to design a first‐in‐human protocol is a complex task, that requires a thorough understanding of the science and integration of a variety of data. This integration needs to be critical and goal‐directed, to support the design of a safe and informative study. For a first‐in‐human study this typically should include the doses that cover the dose–response curve including the therapeutic range, and the measurements that are predictive of clinical efficacy and dose‐related adverse effects. Although some knowledge integration systems such as the Napiergram 3 have been proposed, these have not been widely used and were not designed to integrate all data in the IB.
The tool essentially consists of a database in which essential data from all experiments in the IB are entered. This includes the drug doses, drug concentrations, and pharmacological, clinical or toxicological effects. This information can then be sorted on drug concentrations or standardized human doses, which provides an impression of the dose response curves for the desirable and undesirable effects across the different laboratory animals. Missing information on drug exposure in some of the experiments can be substituted from other studies, based on some basic translational and simple pharmacokinetic assumptions. Such a tool can help researchers to get a semiquantitative overview of all the preclinical data on which the more complicated assessments are based. To understand the possibilities and limitations of the tool, and to avoid misinterpretations, it is important to start with some of the background of translational drug development that underlies the integration of preclinical experiments.
Translational drug development
Drug development, is an iterative, prototypical process 4 that typically starts with a series of in silico and in vitro experiments, with the aim of designing a compound with druggable pharmacochemical and pharmacological properties, which are considered to be desirable for the new medication. The different regulatory guidance documents provide an overview of the types of preclinical studies that are typically required for drug development, which are summarized in the IB 5, 6. Translational drug development heavily relies on the assumption that all these results are connected by pharmacology and pharmacokinetics, in a way that is predictive of the expected effects in healthy humans and patients. The consequence of this is that it should be possible to integrate the data in a more or less quantitative way. However, before any human predictions are made, it is essential that the translatability of the drug across species is scrutinized. Particularly difficult assumptions that should be critically evaluated 2 are the relevance of animal models for human disease (to prevent inadequate dose predictions or lack of efficacy in clinical trials), and the role of the drug's mode(s) of action in human physiology (where discordance could lead to anything from inefficacy to unexpected and sometimes devastating 7 adverse effects). A critical attitude is particularly important for first‐in‐class drugs with a new mechanism of action.
An important feature of a reliably translatable compound, is the fact that comparable effects (desired or adverse) in different laboratory animals are found in equivalent ranges of exposure. Agreement between species improves the predictability for humans 8, but many animal models are restricted to one species, and have only been validated for a single drug class. However, if the drug shows signs of therapeutic effects in one or two animal models at comparable low concentrations, and undesirable effects at consistently higher levels in other species, this increases the chance that the therapeutic window will also be translatable to humans. Deviations from these predictive characteristics creates uncertainty about the translatability, particularly for compounds with a new mode of action. This may have consequences for the design and execution of studies in humans.
Predictions of starting dose and anticipated effective dose
If the drug is expected to be translatable, questions arise about the predicted dose response relations in humans. There are different ways to determine the anticipated effective dose and the starting dose for a first‐in‐human study. The IB often contains several approximations. This has the advantage that the prediction is more reliable if all approaches have a similar outcome, and that the use of the most conservative estimate provides an additional safety margin. The most traditional approach is based on the dose that produces no adverse effects in the most sensitive species (the no observable adverse effect level, NOAEL), with an arbitrary safety factor. This is based on the idea that the predicable adverse effects are typically caused by the same pharmacological mechanism. If the NOAEL is not linked to a clear pharmacological effect, predictions of a safe starting dose principally rely on the assumption that humans are unlikely to be more sensitive to the drug than the most sensitive species among several investigated laboratory animals (with a safety factor on top). If the drug is not very toxic, a NOAEL‐based starting dose may already be pharmacologically active, which can reduce the determined safety margin of highly selective compounds by overestimating the active dose 4. This may also contribute to the sizeable proportion of modern drugs that require dose reductions after launch 9. Since a starting dose that is based on adverse effects may already be pharmacologically active, a pharmacologically active dose (PAD) can be determined, which is the lowest dose that produces a measurable pharmacological effect in the most sensitive species. A more pharmacologically‐based approach is to estimate the minimum anticipated biological effect level (MABEL) 10, 11. This method takes account of the mechanism of action of the drug, and integrates the concentrations required to achieve a marginal pharmacological effect with the expected physiology‐based pharmacokinetic properties of the drug in humans, including penetration into the site of action and the level of target binding and receptor occupancy required for a minimal pharmacological effect. For this, determining the MABEL often requires some form of pharmacokinetic (PK)–pharmacodynamic‐type modelling, which makes use of all relevant preclinical data wherever possible 10. The interpretation of NOAEL, PAD and MABEL should be always interpreted taking into account the relevance of animal models of safety and efficacy for humans. The NOAEL method tries to determine the highest safe starting dose, whereas PAD and MABEL focus on the lowest dose with a biological effect.
Translating animal doses into the human equivalent
All methods that use preclinical data to predict effective concentrations or doses in humans, not only rely on the translatability of the drug's mechanism of action, but also on pharmacokinetic properties. There are several recommended ways to estimate the human equivalent dose (HED) for different animal species and administration modes. The simplest method consists of dose normalization on an mg kg–1 basis with a fixed conversion factor for each laboratory species, that ranges from 0.08 for the mouse to 0.95 for the mini‐pig (Table 1) 12. It is essential to realize that these allometric scaling factors can differ considerably, for instance related to differences in metabolism or kinetic nonlinearity. In these cases, predictions can be misleading, not only for human equivalent doses, but also safety factors and NOAELs for the animals that violate the underlying assumptions. PK differences are more carefully taken into account with a MABEL‐approach, which recommends a more sophisticated physiologically‐based PK (PBPK) or PK/pharmacodynamic analysis 10.
Table 1.
Conversion factors for human equivalent dose (from 12)
| To convert animal dose in mg kg–1, either: | ||||||
|---|---|---|---|---|---|---|
| Reference body weight (kg) | Working weight range (kg) | Body surface area (m2) | To convert dose in mg kg–1 to dose in mg m–2, multiply by Km | Divide animal dose by | Multiply animal dose by | |
| Human | 60 | ‐ | 1.62 | 37 | ‐ | ‐ |
| Child (20 kg) | 20 | ‐ | 0.80 | 25 | ‐ | ‐ |
| Mouse | 0.02 | 0.011–0.34 | 0.007 | 3 | 12.3 | 0.081 |
| Hamster | 0.08 | 0.047–0.157 | 0.016 | 5 | 7.4 | 0.135 |
| Rat | 0.15 | 0.08–0.27 | 0.025 | 6 | 6.2 | 0.162 |
| Ferret | 0.30 | 0.16–0.54 | 0.043 | 7 | 5.3 | 0.189 |
| Guinea pig | 0.40 | 0.208–0.700 | 0.05 | 8 | 4.6 | 0.216 |
| Rabbit | 1.8 | 0.90–3.0 | 0.15 | 12 | 3.1 | 0.324 |
| Dog | 10 | 5.0–17 | 0.50 | 20 | 1.8 | 0.541 |
| Monkey | 3 | 1.4–4.9 | 0.25 | 12 | 3.1 | 0.324 |
| Marmoset | 3.50 | 0.14–0.72 | 0.06 | 6 | 6.2 | 0.162 |
| Squirrel monkey | 6.00 | 0.29–0.97 | 0.09 | 7 | 5.3 | 0.189 |
| Baboon | 12 | 7.0–23 | 0.60 | 20 | 1.8 | 0.541 |
| Micro pig | 20 | 10–33 | 0.74 | 27 | 1.4 | 0.730 |
| Mini pig | 40 | 25–64 | 1.14 | 35 | 1.1 | 0.946 |
A model‐based integration of preclinical data is the best practice for the determination of the starting dose and the anticipated effective dose range in humans. However, it is not always possible to reliably integrate all preclinical experiments in a model. The guidelines offer the possibility to disregard data that are difficult to incorporate into the model. The exclusion of obstinate data may lead to a biased interpretation. Moreover, such data may be highly relevant for human dose prediction, because they may reflect problems with safety or with the generalization across species or experiments.
Dealing with incomplete data in preclinical experiments
A systematic overview of the studies that are included in the IB 5, 6, has to deal with the diversity of the preclinical experiments, and the different types of information that they provide. Ideally, all studies would specify the dose and the resulting plasma (and tissue) drug concentration profile, in relation to the pharmacological, clinical or toxicological effects. Unfortunately, few experiments, if any, provide all this information. Most studies in the IB are dedicated to one specific study result. Consequently, the information that is missing will have to be constructed from other experiments. Almost all studies provide the administered dose, but the problem with sorting on dosage is that dose is not simply related to concentrations and effects across species. The predictability can be improved somewhat by normalization of all experiments to the human equivalent dose, using the species‐specific conversion factor listed in the guideline 12 and replicated in Table 1. The limitation of this method is that the HED conversion factors are based on allometric scaling of body surface area, which is sufficiently conservative to be safe at higher doses, but not accurate enough in a lower pharmacologically active dose range 13. The limitation for a dose‐based data arrangement is essentially that this type of dose‐normalization ignores most differences related to absorption, distribution, metabolism and excretion, which can vary widely between species and formulations. Although these factors can be reconciled in a PBPK‐analysis, their allometric scaling is complex 13, and the differences between species preclude a simple dose‐based arrangement of preclinical experiments and a straightforward derivation of plasma concentrations from administered doses. In most cases, however, predictions of maximum plasma drug concentrations (Cmax) after administration of a single (weight‐corrected, parenteral) dose are reasonably accurate across laboratory animals. This is based on the fact that the apparent volume of distribution is one of the more reliable allometrically scalable factors 12, 13. A graph of the Cmax or the area under the curve against the HED for different species will readily show any deviation in a species and will help to give a rough estimate the Cmax in situations where this is not measured.
Drug distribution can be influenced by species‐specific differences in protein binding and transport 14 . These complications may necessitate PBPK‐type analysis at a later stage, but they can be ignored for the initial simple systematic overview of preclinical study results that is described here. Absorption and first pass metabolism can also vary widely across species, but a systematic evaluation of the IB will identify large differences between oral and parenteral dosing, if the two routes show different dose–concentration relationships.
Constructing the tool
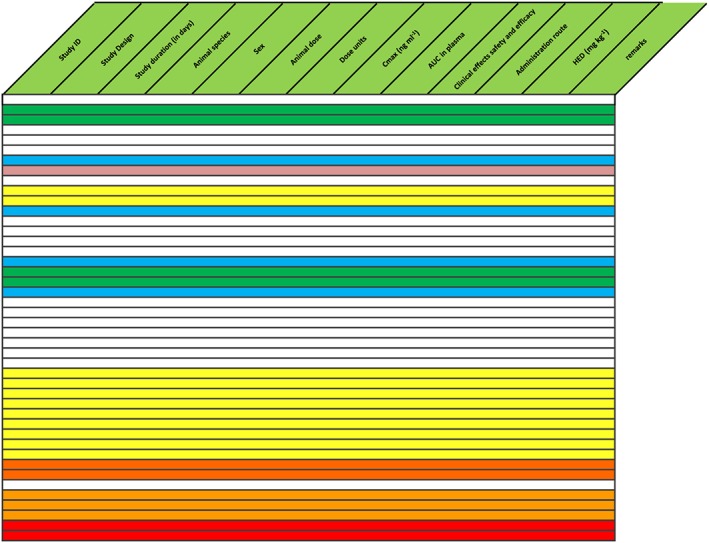
Information has to be extracted from the Investigational Medicinal Product Dossier/IB to generate an overview of the different (pre)clinical experiments. The tool to enter and view the extracted data can be found at http://www.ib-derisk.org, and a tutorial on using the tool is available at https://www.youtube.com/watch?v=6BJSbpYeKLo&feature=youtu.be. Similar results can also be ontained by using a simple self‐constructed spreadsheet. The information collected with the tool can be arranged in different columns of a spreadsheet, which is shown in Figure 1. Other types of information can be added as separate columns, for instance, concentrations of metabolites, total exposure or human equivalent dose. Despite their indicated drawbacks, HEDs are used in many IB's to calculate the recommended starting dose or the maximum dose from NOAELs (using the species‐specific allometric values provided in Table 1). Therefore, a column is added that calculates the HED automatically from species‐specific scaling factors provided in the guideline. The online tool makes these calculations automatically.
Figure 1.
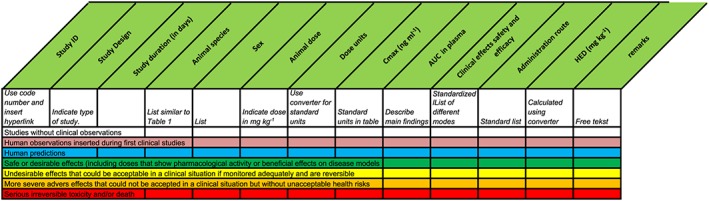
Basic structure of the spreadsheet with colour codes. AUC, area under the concentration curve; Cmax, maximum plasma drug concentration; HED, human equivalent dose
Step 1. Entry of PK experiments
The first step in the arrangement of the preclinical experiments is to select all the single‐dose pharmacokinetic studies in the IB, starting with a single species (usually rats), and to enter the dose (in mg kg–1) and the maximum concentration after administration Cmax (normalized for units for which there are conversion tools in the program) in the database. If a study involves different doses, each dose will be considered a separate experiment. At this stage, the Cmax‐values of the experiments can be sorted on administration route, which will provide a rough impression of the bioavailability of the compound, for instance by comparing the slopes of the dose‐concentrations graphs for the different routes. This can be checked against the formal bioavailability values, which are often specified in the IB. The organization of the single dose PK data can be done for all the laboratory species where this information is available. Dedicated PK experiments usually do not involve measurements of effects, but any observations about the condition of the animals are added to the spreadsheet database, in the clinical effects column.
Step 2. Estimation of missing Cmax values
The second step requires entry of the non‐PK studies that use a single dose of the compound in the same species for which separate PK experiments were entered in step 1. The aim of this is to estimate concentrations at which certain dynamic effects took place. These studies can have different objectives, such as acute pharmacological effects, tissue penetration, cardiovascular safety, disease models or toxicology. Studies that are devoted to drug effects do not usually provide PK values, so they cannot be sorted directly on Cmax. However, the missing Cmax values can be reasonably accurately inferred from the PK‐studies in the same species that use the same dose. After step two, the database can be sorted on Cmax, which will be derived from dedicated PK‐experiments with measured Cmax‐values, as well as effect studies where these values are imputed. The amount of inference of the data at this stage is still limited, and the studies provide fairly homogeneous information on both the pharmacokinetics and the effects after acute dosing, in different experiments that usually involve more than one study per species. For a translatable compound, this integrated information will form a reasonably solid backbone in the database, which will support the incorporation of experiments that lack consistent single dose PK data. The tool has a facility for the display of graphics to support this.
Step 3. Estimation of missing Cmax for other species
The first two steps of the entry process include many experiments in the IB, but we are still left with the studies that do not allow a good estimation of the acute effects around Cmax. This includes the multiple dose experiments and some of the acute toxicology studies in another species, and sometimes models of special interest in a specific laboratory animal.
The third step will be to enter the typical information for these studies (like species, dose, treatment duration and effects) in the respective fields of the database. Most of these studies provide limited PK data at no more than a few time points after dosing, but not on Cmax. However, since these studies are really about specific effects, drug levels that correspond to these effects are more relevant than accurate Cmax‐values. These levels are often provided for the experiment, but if not, relevant concentrations can be approximated with some basic PK assumptions. PK data from a single dose experiment with the same species may be safely used to estimate drug levels for a MAD‐study, if necessary assuming accumulation if the half‐life is long. At the very high end of the dose range (with toxicology studies), an accurate determination of concentrations is less critical for the overview. Some toxicokinetic data are often provided in the IB, but if PK data are only available for a lower dose range in the same species, an alternative option (or a check of the toxicokinetics) may be to extrapolate concentrations from the higher doses in the dedicated kinetic studies or from a dose‐concentration graph made in the spreadsheet. This third step will provide a way to enter all the remaining data without PK information in the spreadsheet, and to sort all the experiments on their best estimated concentrations values.
Step 4. Separating the good from the bad with colour coding
Arranging the information on C max (measured, inferred or estimated) will give an oversight of the relationships between concentrations and effects across species, but only after closer examination of the contents of the effects fields. Some of the experiments will provide information on more desirable and others on neutral or more detrimental effects of the compound, but it may be hard to identify patterns, just on the descriptions of the effects. To improve the overview, the fourth step of the process will be to colour code the experiments, based on the observations in the effects column using a standardized colour scheme (Figure 1). Sometimes, a laboratory experiment may report an unexpected death in a single animal, and there may be doubts about the cause or the drug relatedness. Even if it seems entirely plausible that the event is unrelated to the drug, it is generally prudent to set the colour code to red, because the lack of a relationship with the drug will usually become clear when all the experiments are sorted.
Reading the colour codes
After colour coding, the arrangement of the experiments on C max will provide a clear visual impression of the relations between rising drug concentrations and increasingly intense effects across species (see Figure 1). The pattern of changes of the colour provides an impression of the shape of the concentration–effect curve of the compound. A shallow curve is suggested by a gradual change when some white and a fair number of green‐coded experiments at lower concentrations are followed by a range of acceptable yellow side effects, before unacceptable orange and red toxicity appears in the high concentration range (Figure 2). If the green experiments suddenly give way to orange or red studies with very little yellow in between, it seems that the concentration–effect curve is steeper. This could also be due to a low number of experiments in the upper safe range, but this will be shown by a simple check of the concentration range that corresponds to experiments with undesirable but manageable (yellow) effects (Figure 3). An apparently sudden occurrence of toxicity after a limited increase of concentrations is not a very comfortable situation. Whether this can be acceptable for an ascending dose study in humans, depends on the expected safety window. If many green experiments are available across a wide range of doses and concentrations, it may still be possible to determine a maximal dose that remains comfortable below the orange/red zone, by careful measurement of the pharmacological activity of the drug. At any rate, an apparently steep concentration–effect curve with sudden occurrence of severe adverse effects should lead to discussions between the investigator team and the sponsor about adaptation of the design of the human studies.
Figure 2.
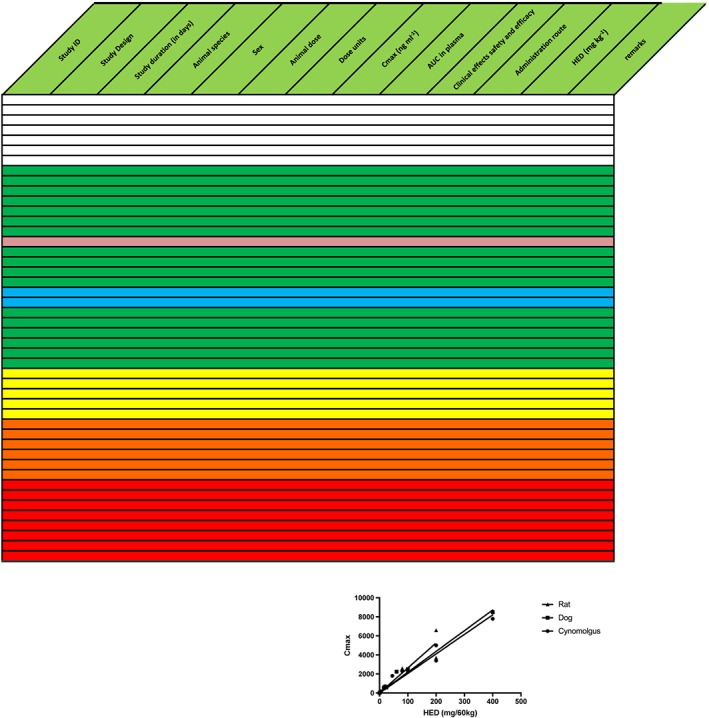
Example of a well‐behaved translatable compound, sorted on maximum plasma drug concentration (Cmax). Text in the table is omitted for clarity. Results are randomly mixed across species. For top to bottom, colours gradually change from predominantly blank (no effect) in lowest concentration range through green (pharmacologically or therapeutically desirable) to yellow–orange (increasingly severe reversible adverse effects) and red (irreversible toxicity and death). The anticipated effective human dose (blue) is in the same region as other green preclinical experiments. An overview with this colour distribution will provide the investigator with confidence that there are no significant differences across species, and that it is possible to determine a reliable safe starting dose for the first study in humans. The reliability is increased by the fact that three species demonstrate the same Cmax vs. human equivalent dose (HED) relationship. (inset) The accuracy of the predictions can be checked during the first‐in‐human studies, by inserting the actual results. AUC, area under the concentration curve
Figure 3.
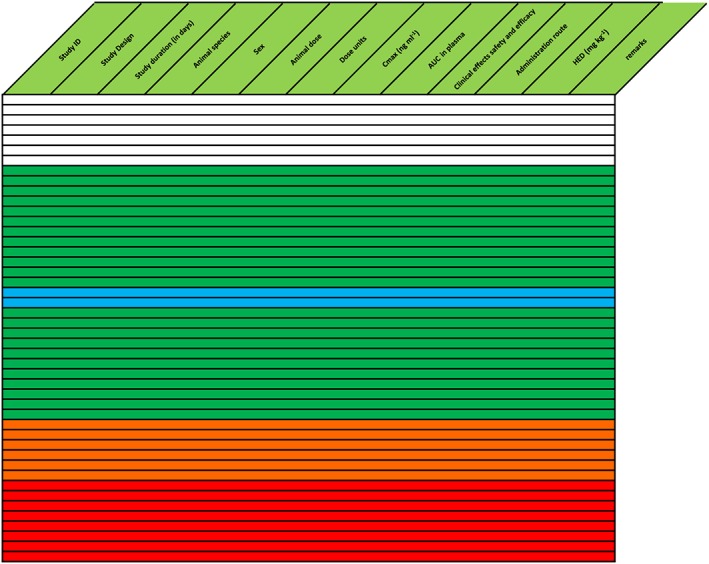
Compound without yellow tolerable side effects, signifying a steep concentration‐effect relationship with a limited safety margin if dose escalation is based on symptoms. Text in the table is omitted for clarity. There is a larger safety margin for the anticipated effective dose in humans, which can potentially be managed by careful rolling assessment of relevant pharmacological activity during first‐in‐man studies. The compound was safely administered to humans, based on measures of pharmacological activity and safety that were rapidly analysed and used for dose‐escalation decisions. AUC, area under the concentration curve; Cmax, maximum plasma drug concentration; HED, human equivalent dose
The homogeneous colour‐coded patterns after arrangement on Cmax that have been described so far, offer a relatively straightforward interpretation. These patterns also suggest that the drug behaves relatively similarly between different strains and species (as far as these have been examined). The pattern may also be more irregular and show, for instance, an experiment with a severe adverse effect (orange‐ or red‐coded), which seems to disrupt a range of concentrations that otherwise provide only neutral or desirable effects (blank or green). Such irregularities obviously require a search for the cause, which may include inapplicability of animal models (Figure 4) or unexpected toxicity that may be species specific (Figure 5). If a certain type of drug toxicity only develops after chronic dosing (as indicated in the duration field of the database), these experiments will also disrupt the pattern if the spreadsheet is sorted on acute (inferred) Cmax values. In these cases, the single dose experiments with the same dosages will show fewer adverse effects than the multiple dose studies.
Figure 4.
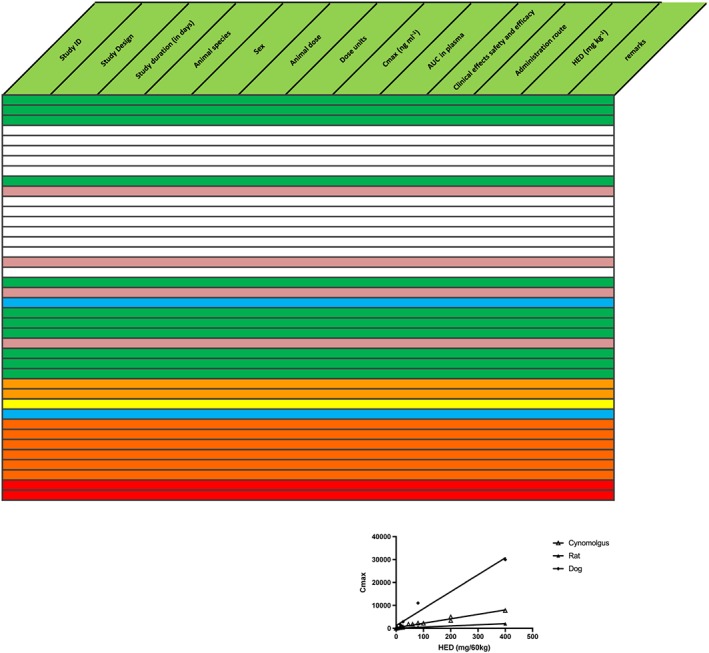
Discrepancy between animal model (lower blue row) and human predictions (upper blue row); possibly indicative of incorrect prediction by the model. Text in the table is omitted for clarity. Additionally, the relationship between maximum plasma drug concentration (Cmax) and human equivalent dose (HED) varies considerably between species, thus inducing further uncertainty about predictions (inset). Product was abandoned. AUC, area under the concentration curve
Figure 5.

Reduction of safety margin caused by unexpected toxicity findings at drug concentrations slightly above therapeutic levels (red rows). Text in the table is omitted for clarity. This indicated possible species‐specific toxicity, which might have been derisked by elucidation of mechanism of action. Instead, it was decided to stop further development. The compound was not administered to humans. AUC, area under the concentration curve; Cmax, maximum plasma drug concentration; HED, human equivalent dose
There are also cases where the irregularities in the pattern reflect problems with the translatability of the compound. A single species or strain may more sensitive to the drug than others, and my show toxicity in a green range that corresponds with desirable effects in other animals. If no clear reason can be identified why one species responds differently from the rest, this adds to the uncertainty about the predictability for humans. In general, confidence in the predictability of the overview, not only depends on the concentration‐effect pattern in the spreadsheet, but also on the number of experiments within each colour‐coded category.
Spreadsheet‐based IB overviews
Over the course of the years, the spreadsheet procedure described in this article has become a standard way in our institution of evaluating the IB for novel compounds, and there is now experience with several dozens of compounds. The spreadsheets almost invariably improved the communication among the teams of investigators and sponsors regarding an otherwise potentially complete but very large amount of unrelated data. During the first‐in‐human studies, the database is updated with emerging data from consecutive doses. Often, these data are in line with expectations, but sometimes predictions and dose ranges need to be adapted (Figure 6). The incorporation of actual human data into the overview of nonclinical experiments is useful for discussions about maximum dosages or dose escalation steps, and provides constant feedback on the translatability of the compound and the reliability of underlying assumptions.
Figure 6.
Drug with efficacy at very low levels, but lowest part of concentration‐effect curve was not examined preclinically (no white experiments above green). Text in the table is omitted for clarity. After insertion of studies in humans (pink), effective dose range was found to be lower than predicted. Additional studies were performed in humans in a range 1/20–1/8 of the starting dose in original first‐in‐human study, which showed clear pharmacological effects without adverse effects. AUC, area under the concentration curve; Cmax, maximum plasma drug concentration; HED, human equivalent dose
The total set of preclinical data preceding a first‐in human experiment is very large, often encompassing several hundred pages, and needs to be assessed by the company, the investigator and regulatory agencies. They will all be assisted by a standardized tool that allows the evaluation of all the data in relation to each other. The software tool is freely available at http://www.ib-derisk.org together with an instruction video. Clearly, the current tool is a simple method to create order in a relatively unconnected set of data. There is no computer tool that can replace experience or sound clinical judgement required to take the complex decisions required during early drug development.
Competing Interests
There are no competing interests to declare. J.v.G. is chairman of the Netherlands Central Ethics Committee and Trial Competent Authority of The Netherlands and viewpoints and guidance supplied in this article are entirely personal.
van Gerven, J. , and Cohen, A. (2018) Integrating data from the Investigational Medicinal Product Dossier/investigator's brochure. A new tool for translational integration of preclinical effects. Br J Clin Pharmacol, 84: 1457–1466. doi: 10.1111/bcp.13529.
References
- 1. Kerbrat A, Ferré JC, Fillatre P, Ronzière T, Vannier S, Carsin‐Nicol B, et al Acute neurologic disorder from an inhibitor of fatty acid amide hydrolase. N Engl J Med 2016; 375: 1717–1725. [DOI] [PubMed] [Google Scholar]
- 2. Kenter M, Cohen A. Establishing risk of human experimentation with drugs: lessons from TGN1412. Lancet 2006; 368: 1387–1391. [DOI] [PubMed] [Google Scholar]
- 3. Brynne L, Bresell A, Sjögren N. Effective visualization of integrated knowledge and data to enable informed decisions in drug development and translational medicine. J Transl Med 2013; 11: 250. [DOI] [PMC free article] [PubMed] [Google Scholar]
- 4. Cohen AF. Developing drug prototypes: pharmacology replaces safety and tolerability? Nat Rev Drug Discov 2010; 9: 856–865. [DOI] [PubMed] [Google Scholar]
- 5. International Conference on Harmonisation of Technical Requirements for Registration of Pharmaceuticals for Human Use . Guideline for good clinical practice E6. 1996; Available at: http://www.ich.org/products/guidelines/efficacy/article/efficacy-guidelines.html (last accessed 1 April 2018).
- 6. European Medicines Agency . ICH guideline M3(R2) on non‐clinical safety studies for the conduct of human clinical trials and marketing authorisation for pharmaceuticals. EMA/CPMP/ICH/286/1995 2009; Available at: http://www.ema.europa.eu/docs/en_GB/document_library/Scientific_guideline/2009/09/WC500002720.pdf (last accessed 1 April 2018).
- 7. Kenter MJH, Cohen AF. The return of the prodigal son and the extraordinary development route of antibody TGN1412 ‐ lessons for drug development and clinical pharmacology. Br J Clin Pharmacol 2015; 79: 545–547. [DOI] [PMC free article] [PubMed] [Google Scholar]
- 8. Center for Drug Evaluation and Research . Guidance for industry: single dose acute toxicity testing for pharmaceuticals. 1996; Available at: https://www.fda.gov/downloads/Drugs/.../Guidances/ucm079270.pdf (last accessed 1 April 2018).
- 9. Cross J, Lee H, Westelinck A, Nelson J, Grudzinskas C, Peck C. Postmarketing drug dosage changes of 499 FDA‐approved new molecular entities, 1980‐1999. Pharmacoepidemiol Drug Saf 2002; 11: 439–446. [DOI] [PubMed] [Google Scholar]
- 10. European Medicines Agency . Guideline on strategies to identify and mitigate risks for first‐in‐human clinical trials with investigational medicinal products. EMEA/CHMP/SWP/28367/07 2016; Available at: http://www.ema.europa.eu/docs/en_GB/document_library/Scientific_guideline/2009/09/WC500002988.pdf (last accessed 1 April 2018).
- 11. Agoram BM. Use of pharmacokinetic/ pharmacodynamic modelling for starting dose selection in first‐in‐human trials of high‐risk biologics. Br J Clin Pharmacol 2009; 67: 153–160. [DOI] [PMC free article] [PubMed] [Google Scholar]
- 12. Center for Drug Evaluation and Research . Guidance for industry: estimating the maximum safe starting dose in initial clinical trials for therapeutics in adult healthy volunteers. 2005; Available at: http://www.fda.gov/downloads/Drugs/Guidance/UCM078932.pdf (last accessed 1 April 2018).
- 13. Teitelbaum Z, Lave T, Freijer J, Cohen AF. Risk assessment in extrapolation of pharmacokinetics from preclinical data to humans. Clin Pharmacokinet 2010; 49: 619–632. [DOI] [PubMed] [Google Scholar]
- 14. Sharma V, McNeill JH. To scale or not to scale: the principles of dose extrapolation. Br J Pharmacol 2009; 157: 907–921. [DOI] [PMC free article] [PubMed] [Google Scholar]