Abstract
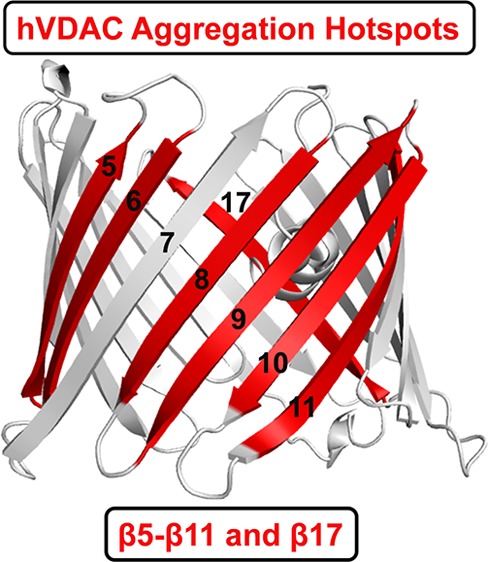
Membrane protein aggregation is associated with neurodegenerative diseases. Despite remarkable advances to map protein aggregation, molecular elements that drive the structural transition from functional to amyloidogenic β-sheet polymers remain elusive. Here, we report a simple and reliable reverse-mapping method to identify the molecular elements. We validate our approach by obtaining molecular details of aggregation loci of human β-barrel nanopore ion channels that are vital for cell survival. By coupling bottom-up synthesis with time-resolved aggregation kinetics and high-resolution imaging, we identify molecular elements that switch folded channels to polymeric β-rich aggregates. We prove that intrinsic protein aggregation and amyloidogenicity does not depend on total hydrophobicity but on single residue differences in the primary sequence. Our method offers effective strategies for sequence-based design of aggregation inhibitors in biomedicine for neurodegenerative diseases.
Membrane proteins have versatile functions in biomolecule transport and as biosensors and have application-oriented outcomes in harnessing solar energy and as designed nanodevices.1−3 Despite its profound applications, the redesign of membrane proteins for functionality is a major challenge in bio-organic chemistry and nanobiotechnology.3 The monumental challenge is to overcome the intrinsic tendency of these proteins to aggregate. In humans, membrane protein aggregation causes debilitating neurodegenerative diseases including Alzheimer’s and Parkinson’s disease. Overcoming membrane protein aggregation mandates accurate mapping of aggregation hot spots in the sequence. The inside-out topology of membrane proteins, where hydrophobic residues are located on the outside and hydrophilic residues on the inside of the protein structure, interferes severely in accurate determination of aggregation hot spots.
In addition to aiding the superior design of membrane proteins, aggregation hot spots are excellent targets for aggregation inhibitors that can cure neurodegenerative diseases.4,5 Aggregation rates of β-amyloids and soluble proteins have been studied previously.6−11 However, we need a simple and accurate experimental method to map aggregation hot spots in any membrane protein. We reasoned that a reverse-mapping strategy can be designed that uses synthetic modular peptide segments and takes into consideration the intrinsic hydropathy of membrane proteins. Here, we describe this peptide-based bottom-up reverse-mapping approach. We validate that our method provides unambiguous results by mapping the precise aggregation hot spots in three isoforms of a human membrane protein. We demonstrate that our reverse-mapping provides a simple, cost-effective, and clean read-out of aggregation hot spots in membrane proteins.
To test and validate our aggregation hot spot reverse-mapping strategy, we chose human proteins that have β-rich structures and are pharmacologically relevant. We used the human mitochondrial voltage-dependent anion channel (VDAC), a 19-stranded β-barrel membrane nanopore that is vital for nucleotide and ion transport and cell survival.12,13 Humans have three VDAC isoforms, named 1, 2, and 3 (hV1, hV2, and hV3). All VDACs homo- and hetero-oligomerize in the membrane. Further, they interact differentially with apoptotic, misfolded, and aggregation-prone proteins in the cell including Aβ peptide, parkin, α-synuclein, Tau, SOD1, Bax, BAK, and hexokinase.4,13−17 Such hetero-oligomerization leads to uncontrolled protein aggregation in the cell causing Alzheimer’s disease, Parkinson’s disease, and other neurodegenerative diseases.18−22 The sites at which VDACs interact with these proteins, called as aggregation hot spots, are not known yet.
hV1, hV2, and hV3 possess near-identical sequences (>75% identity), yet they exhibit remarkable differences in their tendency to oligomerize and aggregate.4,22 Hence, VDACs are ideal model systems to test and validate our reverse-mapping strategy. First, we mapped the primary sequence of the N-helix (α1) and each transmembrane β-strand of hV1,12 hV2, and hV3 from their structures. Each peptide analog (54 sequences; see Tables S1–S4, Figures S1–S3) was generated systematically using chemical synthesis (see SI for detailed methods). To avoid interference from disulfide-mediated aggregation, cysteines were replaced with serine during synthesis. VDAC oligomers and aggregates are formed under physiological conditions. Hence, we tested the intrinsic aggregation propensity of each peptide in two different conditions, namely, pH 4.0 (citrate) and pH 7.2 (phosphate), based on the pH levels existing in human mitochondria under physiological and disease states.
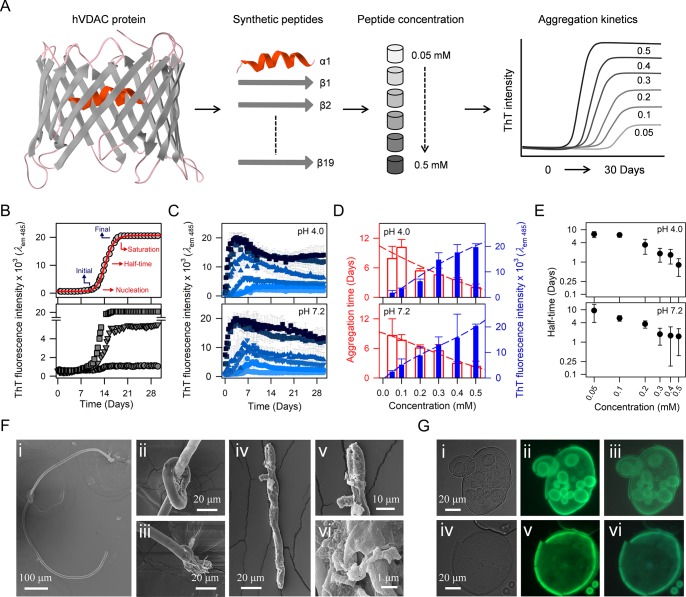
The experimental methodology is illustrated in Figure 1A. The propensity of each peptide to aggregate at different concentrations was followed using thioflavin T (ThT) as the reporter. Here, an increase in ThT fluorescence indicates the formation of amyloidogenic aggregates. The progress of peptide aggregation was monitored every 12 h for 30 days at 25 °C, with increasing peptide concentrations. The observation of time-dependent and concentration-dependent two-state profiles support amyloidogenic nature of the sequence being studied (Figure 1A, rightmost panel). We derived the change in ThT fluorescence (initial versus final) and aggregation time (nucleation time versus saturation time) as indicators of both the propensity and extent of aggregation (Figure 1B, top panel). The change in ThT fluorescence also varies with the peptide sequence (Figure 1B, bottom panel) and indicates the extent to which each aggregate possesses amyloidogenic nature.
Figure 1.
Peptide-based reverse-mapping approach to chart aggregation hot spots of human VDACs and their characterization. (A) Schematic showing peptide-based bottom-up approach to study aggregation hot spots of membrane proteins, using hVDACs as the model system. (B, top) Schematic representation of aggregation kinetics monitored with ThT fluorescence. Parameters derived from ThT fluorescence intensity (blue) denoting nucleation and saturation time of aggregation (red) are shown. (B, bottom) Representative data obtained from three different peptides illustrating the extent of change in ThT fluorescence intensity with aggregation. (C) ThT fluorescence profiles for hV2-β17 (shown here as an example) in six different peptide concentrations (0.05–0.5 mM; light to dark blue) in pH 4.0 and pH 7.2 buffers. (D) Plot of the final (saturation) ThT intensity (blue filled histograms), and the time taken to reach saturation (red open histograms), with increasing peptide concentration. The time to reach saturating aggregation levels varies inversely with peptide concentration (dashed lines). (E). Aggregation half-time of hV2-β17 decreases from 10 days to 0.5 days with increasing peptide concentration. All error bars represent SD from four independent experiments. (F) Representative SEM images of amyloid-like aggregates formed for hV2-β17 (low magnification, panels i and iv; high magnification, panels ii, iii, v, and vi). (G) hV2-β17 peptide aggregates observed with DIC (i, iv), fluorescence microscopy with GFP filter (ii, v), and overlay (iii, vi).
Specific peptide sequences showed a concentration-dependent increase in ThT fluorescence in both buffer conditions. For example, the ThT fluorescence profiles of hV2-β17 are illustrated in Figure 1C. Here, we observe a near-linear increase in the final ThT fluorescence intensity and a concomitant decrease in the time required to achieve saturation of aggregation (Figure 1D and S4). Such concentration- and time-dependent aggregation is characteristic of amyloid-like sequences. We are able to explain the aggregation kinetics of these peptides using a secondary nucleation model of peptide association (AmyloFit; details in Figure S5). The aggregation half-time we derived from the secondary nucleation model (shown for hV2-β17 in Figure 1E) shows a linear dependence to the concentration. The amyloid-like fibril morphologies are further confirmed by scanning electron microscopy (SEM) imaging (illustrated in Figure 1F and S6). Additionally, we also used differential interference contrast (DIC) and fluorescence microscopy to confirm that these amyloid-like aggregates have affinity to bind to ThT (illustrated in Figure 1G and S7). Hence, our reverse-mapping method can detect the amyloid-like nature exhibited by synthetic peptide analogs of VDAC proteins.
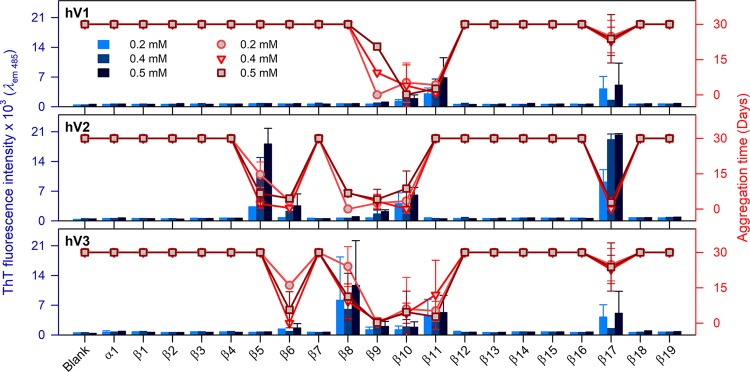
A global comparison of the intrinsically aggregation prone β-strands of all three VDAC proteins is summarized in Figures 2 and S8–S10. We analyzed the ThT fluorescence intensity (blue histograms) at the aggregation saturation time (scatter plots) for the N-terminal helix (α1) and each β-strand (β1−β19) for hV1, hV2, and hV3. Since all three VDACs can bind several misfolded proteins and lead to neurological disorders,18−22 it is vital to generate a comprehensive map of the β-aggregation hot spots of all three proteins. Using our bottom-up approach, we find that strands β9−β11 of hV1, β5−β10 of hV2, and β6−β11 of hV3 exhibit an intrinsic propensity to aggregate. We additionally identify β17 as aggregation-prone in all three VDAC nanopores (Figure 2). As described previously, we validated the presence of aggregates independently using DIC, fluorescence microscopy, and high-resolution SEM imaging (Figure S6 and S7).
Figure 2.
Specific transmembrane strands of hVDACs show localized intrinsic aggregation propensity. ThT fluorescence intensity at 485 nm (histogram, left axis) measured at the saturation time of peptide aggregation (scatter plot, right axis), at increasing peptide concentrations (0.2–0.5 mM; shades of blue or red) in pH 7.2. Error bars represent SD from at least three independent experiments. The central region of hVDACs corresponding to β5−β11, and β17 shows significant aggregation propensity. See Figures S8–S10 for the complete data and results in pH 4.0.
Our results from ThT binding and validation from microscopy and SEM data allow us to deduce that the aggregation morphology of these peptides are amyloid-like. Interestingly, the extent of aggregation differs across the three isoforms and follows the order hV3 ≥ hV2 > hV1 (see Figure 2). Hence, we are able to conclude that the intrinsic nature of VDAC to aggregate resides in its primary sequence.
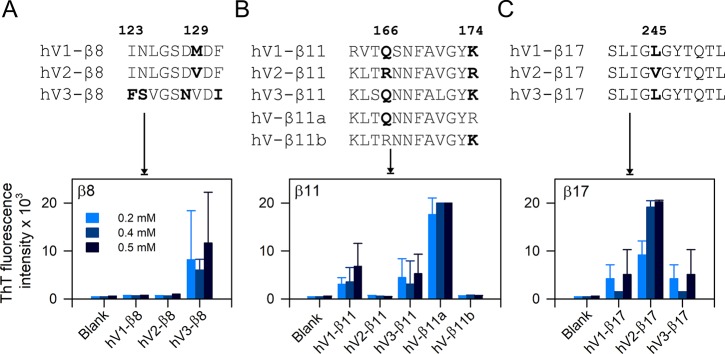
The per-residue hydropathy index calculated using five popular scales for the three nanopores reflects only subtle variations in the primary sequence (Figure S11). Hence, they are not useful as indicators of aggregation hot spots in membrane proteins. In contrast, our methodology establishes that marginal variations are sufficient to drive VDAC aggregation, and they can be readily identified by reverse-mapping. In other words, VDACs show sequence-dependent aggregation kinetics. We illustrate three such examples in Figure 3 (and Figure S12). (example 1) Nonapeptides corresponding to strand β8 show partially conserved substitutions in four positions across hV1 and hV2 compared with hV3 (Figure 3). Yet, we can detect a ∼10-fold difference in ThT fluorescence across the three peptides (Figure 3A). (example 2) There are two sites that vary in the β11 dodecapeptide, namely, Q/R166 and K/R174. This minor variation results in a ∼12-fold increase in ThT fluorescence (and aggregation propensity) in hV1-β11 and hV3-β11 when compared with hV2-β11 (which does not aggregate). To establish that our method is highly sensitive to minor intrinsic differences in the β-strand primary sequence, we generated hybrid hV2-β11 sequences. Here, one of the two sites was mutated (R166 → Q in hV-β11a; R174 → K in hV-β11b; Figure 3B, Table S5). The R166 → Q substitution in the native sequence of hV2-β11 leads to increase in peptide aggregation (Figure 3B). On the other hand, the aggregation tendency is not affected by the R174 → K substitution. (example 3) β17 is enriched with conserved hydrophobic and amyloidogenic residues. Yet, our method can successfully differentiate the effect of a conserved L245 → V substitution between hV1/hV3 and hV2 on the change in the aggregation behavior of the β17 peptide (Figure 3C).
Figure 3.
Reverse-mapping strategy identifies sequence-driven aggregation propensity of hVDAC peptides. (top) Multiple sequence alignment of β8, β11, and β17 showing differences in the primary peptide sequence. Amino acid numbering is based on hV1/hV3. (bottom) ThT fluorescence histograms are highlighting the differences in aggregation tendency in pH 7.2. (A) hV3-β8 shows increased aggregation tendency, whereas aggregation of hV1- and hV2-β8 is negligible. (B) Comparison of aggregation tendency of β11 permutants shows considerable differences for each isoform. Hybrid peptides of β11 (β11a and β11b) prove that a single residue substitution in hV2-β11 (R166 → Q in hV-β11a) renders this peptide highly sensitive to aggregation. (C) A conserved single amino acid difference between hV1/hV3-β17 and hV2-β17 (245L → V) determines the aggregation tendency. hV2-β17 show a 2-fold increase in ThT intensity compared to hV1/hV3-β17. All three examples highlight the efficiency of reverse mapping to demarcate peptide aggregation propensity. Error bars represent SD from at least three independent experiments.
Put together, we are able to demonstrate through our reverse-mapping approach that the primary sequence of human VDACs is sufficient to dictate the intrinsic amyloid-like nature and aggregation propensity of the protein. We are able to show that the aggregation tendency of the membrane protein does not depend solely on the overall hydrophobicity of the primary sequence.
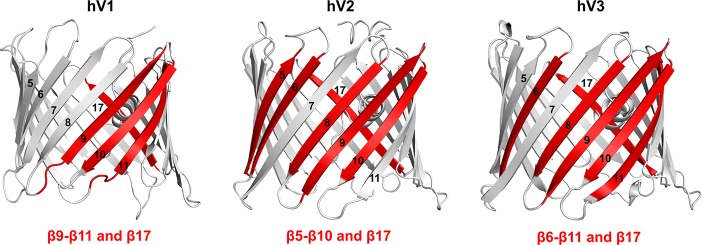
In conclusion, by using a bottom-up reverse-mapping approach using synthetic peptides, we have successfully mapped the intrinsic aggregation hot spots of the human β-sheet rich membrane nanopore channels. We find that the primary sequence of strands β9−β11 of hV1, β5−β10 of hV2, β6−β11 of hV3, and β17 of all three VDAC nanopores are intrinsically prone to aggregation (Figure 4). We speculate that adverse changes in physiological conditions can render the aggregation sites of VDAC available for progressive formation of amyloid-like fibrils. Our reverse mapping provides reliable read-out on the varied aggregation behavior arising from conserved residue differences in the parent sequence of β8, β11, and β17 across the three VDAC isoforms. We also show that a point mutation is sufficient to alter the aggregation propensity of the VDAC nanopores. These findings allow us to prove that the primary sequence defines interaction surfaces that are intrinsically prone to association and aggregation. Recent reports map the potential VDAC2 interaction sites with BAX/BAK to β7−β10 region during apoptosis,16,23 and an earlier structure-based prediction of hV1 oligomerization showed the likely occurrence of four contact sites for homo-oligomerization, namely, β1−β2, β7−β9, β7−β10, β13, and β17.19 E73 in β4 of mouse VDAC1 was recently shown to elicit VDAC dimerization.24 These studies are in excellent agreement with our findings, as we are successfully able to map these potential homo- and hetero-oligomerization sites of VDACs and additionally identify novel aggregation zones. We demonstrate that our reverse-mapping strategy using synthetic peptides provides a simple, cost-effective, and reliable method to obtain precise aggregation hot spot maps of membrane proteins. We propose that our bottom-up approach using peptides is a useful tool to investigate the structural and biophysical properties of all membrane proteins.
Figure 4.
Aggregation hot spots of hV1, hV2, and hV3. Aggregation hot spots identified in this study are highlighted on the cartoon representation of the three hVDAC isoform structures. hV2 and hV3 structures were modeled using hV112 as the template. Aggregation prone β-strands are in red, and strand numbers are marked on each figure.
Experimental Methods
Aggregation kinetics profiles of processed peptides corresponding to hV1, hV2, and hV3 were monitored every 12 h for 30 days using ThT fluorescence. End-point samples were imaged using SEM, DIC, and fluorescence microscopy. Data were fitted using AmyloFit to obtain the aggregation kinetics model. Details are in the Supporting Information.
Acknowledgments
We thank M. Krishnamurthy for technical support and Vikas Jain and Ankit Gupta for critical discussions. M.L. thanks IISER Bhopal for fellowship. R.M. is a Wellcome Trust/DBT Fellow. This work is supported by the Wellcome Trust/DBT India Alliance award IA/I/14/1/501305 to R.M.
Supporting Information Available
The Supporting Information is available free of charge on the ACS Publications website at DOI: 10.1021/acs.jpclett.8b00953.
Detailed experimental methods, hV1–3 and hybrid peptide sequences and molecular weights, characterization of peptides, hV2-β17 peptide aggregation properties, aggregation half-time calculations, SEM images of different hVDAC peptides, DIC and fluorescence microscopy images of hV2 peptide aggregates, intrinsic aggregation propensity of hV1–3 peptides, hydropathy plots for the hVDAC isoforms, and sequence-driven aggregation propensity of hVDAC peptides (PDF)
The authors declare no competing financial interest.
Supplementary Material
References
- Joh N. H.; Wang T.; Bhate M. P.; Acharya R.; Wu Y.; Grabe M.; Hong M.; Grigoryan G.; DeGrado W. F. De Novo Design of a Transmembrane Zn2+-Transporting Four-Helix Bundle. Science 2014, 346, 1520–1524. 10.1126/science.1261172. [DOI] [PMC free article] [PubMed] [Google Scholar]
- Mahendran K. R.; Niitsu A.; Kong L.; Thomson A. R.; Sessions R. B.; Woolfson D. N.; Bayley H. A Monodisperse Transmembrane Alpha-Helical Peptide Barrel. Nat. Chem. 2017, 9, 411–419. 10.1038/nchem.2647. [DOI] [PubMed] [Google Scholar]
- Huang P. S.; Boyken S. E.; Baker D. The Coming of Age of De Novo Protein Design. Nature 2016, 537, 320–327. 10.1038/nature19946. [DOI] [PubMed] [Google Scholar]
- Boulbrima A.; Temple D.; Psakis G. The Multiple Assemblies of VDAC: From Conformational Heterogeneity to Beta-Aggregation and Amyloid Formation. Biochem. Soc. Trans. 2016, 44, 1531–1540. 10.1042/BST20160114. [DOI] [PubMed] [Google Scholar]
- Eisenberg D. S.; Sawaya M. R. Structural Studies of Amyloid Proteins at the Molecular Level. Annu. Rev. Biochem. 2017, 86, 69–95. 10.1146/annurev-biochem-061516-045104. [DOI] [PubMed] [Google Scholar]
- LeVine H. 3rd. Thioflavine T Interaction with Synthetic Alzheimer’s Disease Beta-Amyloid Peptides: Detection of Amyloid Aggregation in Solution. Protein Sci. 1993, 2, 404–410. 10.1002/pro.5560020312. [DOI] [PMC free article] [PubMed] [Google Scholar]
- Chiti F.; Taddei N.; Baroni F.; Capanni C.; Stefani M.; Ramponi G.; Dobson C. M. Kinetic Partitioning of Protein Folding and Aggregation. Nat. Struct. Biol. 2002, 9, 137–143. 10.1038/nsb752. [DOI] [PubMed] [Google Scholar]
- Dzwolak W.; Pecul M. Chiral Bias of Amyloid Fibrils Revealed by the Twisted Conformation of Thioflavin T: An Induced Circular Dichroism/DFT Study. FEBS Lett. 2005, 579, 6601–6603. 10.1016/j.febslet.2005.10.048. [DOI] [PubMed] [Google Scholar]
- Bucciantini M.; Rigacci S.; Stefani M. Amyloid Aggregation: Role of Biological Membranes and the Aggregate-Membrane System. J. Phys. Chem. Lett. 2014, 5, 517–527. 10.1021/jz4024354. [DOI] [PubMed] [Google Scholar]
- Mompean M.; Hervas R.; Xu Y.; Tran T. H.; Guarnaccia C.; Buratti E.; Baralle F.; Tong L.; Carrion-Vazquez M.; McDermott A. E.; et al. Structural Evidence of Amyloid Fibril Formation in the Putative Aggregation Domain of TDP-43. J. Phys. Chem. Lett. 2015, 6, 2608–2615. 10.1021/acs.jpclett.5b00918. [DOI] [PMC free article] [PubMed] [Google Scholar]
- Economou N. J.; Giammona M. J.; Do T. D.; Zheng X.; Teplow D. B.; Buratto S. K.; Bowers M. T. Amyloid Beta-Protein Assembly and Alzheimer’s Disease: Dodecamers of Aβ42, but Not of Aβ40, Seed Fibril Formation. J. Am. Chem. Soc. 2016, 138, 1772–1775. 10.1021/jacs.5b11913. [DOI] [PMC free article] [PubMed] [Google Scholar]
- Hiller S.; Garces R. G.; Malia T. J.; Orekhov V. Y.; Colombini M.; Wagner G. Solution Structure of the Integral Human Membrane Protein VDAC-1 in Detergent Micelles. Science 2008, 321, 1206–1210. 10.1126/science.1161302. [DOI] [PMC free article] [PubMed] [Google Scholar]
- Maurya S. R.; Mahalakshmi R. Mitochondrial VDAC2 and Cell Homeostasis: Highlighting Hidden Structural Features and Unique Functionalities. Biol. Rev. 2017, 92, 1843–1858. 10.1111/brv.12311. [DOI] [PubMed] [Google Scholar]
- Soto C. Unfolding the Role of Protein Misfolding in Neurodegenerative Diseases. Nat. Rev. Neurosci. 2003, 4, 49–60. 10.1038/nrn1007. [DOI] [PubMed] [Google Scholar]
- Schredelseker J.; Paz A.; Lopez C. J.; Altenbach C.; Leung C. S.; Drexler M. K.; Chen J. N.; Hubbell W. L.; Abramson J. High Resolution Structure and Double Electron-Electron Resonance of the Zebrafish Voltage-Dependent Anion Channel 2 Reveal an Oligomeric Population. J. Biol. Chem. 2014, 289, 12566–12577. 10.1074/jbc.M113.497438. [DOI] [PMC free article] [PubMed] [Google Scholar]
- Naghdi S.; Varnai P.; Hajnoczky G. Motifs of VDAC2 Required for Mitochondrial Bak Import and tBid-Induced Apoptosis. Proc. Natl. Acad. Sci. U. S. A. 2015, 112, E5590–5599. 10.1073/pnas.1510574112. [DOI] [PMC free article] [PubMed] [Google Scholar]
- Shoshan-Barmatz V.; Krelin Y.; Chen Q. VDAC1 as a Player in Mitochondria-Mediated Apoptosis and Target for Modulating Apoptosis. Curr. Med. Chem. 2017, 24, 4435–4446. 10.2174/0929867324666170616105200. [DOI] [PubMed] [Google Scholar]
- Israelson A.; Arbel N.; Da Cruz S.; Ilieva H.; Yamanaka K.; Shoshan-Barmatz V.; Cleveland D. W. Misfolded Mutant SOD1 Directly Inhibits VDAC1 Conductance in a Mouse Model of Inherited Als. Neuron 2010, 67, 575–587. 10.1016/j.neuron.2010.07.019. [DOI] [PMC free article] [PubMed] [Google Scholar]
- Geula S.; Naveed H.; Liang J.; Shoshan-Barmatz V. Structure-Based Analysis of VDAC1 Protein: Defining Oligomer Contact Sites. J. Biol. Chem. 2012, 287, 2179–2190. 10.1074/jbc.M111.268920. [DOI] [PMC free article] [PubMed] [Google Scholar]
- Manczak M.; Sheiko T.; Craigen W. J.; Reddy P. H. Reduced VDAC1 Protects against Alzheimer’s Disease, Mitochondria, and Synaptic Deficiencies. J. Alzheimers Dis. 2013, 37, 679–690. 10.3233/JAD-130761. [DOI] [PMC free article] [PubMed] [Google Scholar]
- Smilansky A.; Dangoor L.; Nakdimon I.; Ben-Hail D.; Mizrachi D.; Shoshan-Barmatz V. The Voltage-Dependent Anion Channel 1 Mediates Amyloid Beta Toxicity and Represents a Potential Target for Alzheimer Disease Therapy. J. Biol. Chem. 2015, 290, 30670–30683. 10.1074/jbc.M115.691493. [DOI] [PMC free article] [PubMed] [Google Scholar]
- Magri A.; Messina A. Interactions of VDAC with Proteins Involved in Neurodegenerative Aggregation: An Opportunity for Advancement on Therapeutic Molecules. Curr. Med. Chem. 2017, 24, 4470–4487. 10.2174/0929867324666170601073920. [DOI] [PubMed] [Google Scholar]
- Naghdi S.; Hajnoczky G. VDAC2-Specific Cellular Functions and the Underlying Structure. Biochim. Biophys. Acta, Mol. Cell Res. 2016, 1863, 2503–2514. 10.1016/j.bbamcr.2016.04.020. [DOI] [PMC free article] [PubMed] [Google Scholar]
- Bergdoll L. A.; Lerch M. T.; Patrick J. W.; Belardo K.; Altenbach C.; Bisignano P.; Laganowsky A.; Grabe M.; Hubbell W. L.; Abramson J. Protonation State of Glutamate 73 Regulates the Formation of a Specific Dimeric Association of mVDAC1. Proc. Natl. Acad. Sci. U. S. A. 2018, 115, E172–E179. 10.1073/pnas.1715464115. [DOI] [PMC free article] [PubMed] [Google Scholar]
Associated Data
This section collects any data citations, data availability statements, or supplementary materials included in this article.


