

Abstract
A new global optimization method, Conformation-family Monte Carlo, has been developed recently for searching the conformational space of macromolecules. In the present paper, we adapted this method for prediction of crystal structures of organic molecules without assuming any symmetry constraints except the number of molecules in the unit cell. This method maintains a database of low energy structures that are clustered into families. The structures in this database are improved iteratively by a Metropolis-type Monte Carlo procedure together with energy minimization, in which the search is biased toward the regions of the lowest energy families. The Conformation-family Monte Carlo method is applied to a set of nine rigid and flexible organic molecules by using two popular force fields, AMBER and W99. The method performed well for the rigid molecules and reasonably well for the molecules with torsional degrees of freedom.
Crystal structure prediction is one of the most challenging and important problems in theoretical and applied crystal chemistry. It plays an extremely important role in fields in which the rational design of new organic solids is involved (e.g., pharmaceuticals, explosives, pigments, photosensitive and optoelectronic materials, etc.). The significance of crystal structure prediction for solving the problem of polymorphism has been discussed in detail (1, 2). Despite much effort by many scientific groups over the past 20 years, the problem of crystal structure prediction is far from being solved (3). Generally, “crystal structure prediction” is understood as a search for the most thermodynamically and kinetically favorable crystal structures for a given molecular composition without using any experimental information (in many cases, however, experimental data are included implicitly in the force field or taken into consideration by conducting the search in the most common space groups). Unfortunately, no theoretical methods capable of taking into account the kinetic factors (conditions of nucleation and growth, nature of solvent, etc.) have been developed. Therefore, crystal structure prediction is based solely on thermodynamic considerations and the assumption that the structure observed experimentally corresponds to the global minimum of the free energy. But, free energy is not a function of geometrical coordinates of a single crystal structure; therefore, the traditional approach to crystal structure prediction assumes that the free energy of a crystal can be approximated by its potential energy (which can be computed easily) with the lowest minima corresponding to the structures observed experimentally.
There are two main obstacles making crystal structure prediction based on potential energy calculations very difficult. First of all, to calculate the potential energy of a crystal, which is considered as a sum of pairwise atom–atom interactions (4), a highly accurate interatomic potential is required. Several different potentials have been proposed (5–8). Second, a search for the global minimum on the potential energy surface has to be carried out to predict the crystal structure for a given molecule. The search has to be conducted in a multidimensional space with the number of dimensions increasing rapidly with the number of molecules in the unit cell and the complexity of the molecules. Therefore, a reliable and efficient search method is required to solve the problem. Several methods that can be used for crystal structure prediction with varying degrees of confidence have been developed, and these have been described in comprehensive reviews (1, 3). Most of the methods are based on the use of statistical information (most common space groups, symmetry elements, etc.) derived from the Cambridge Structural Database (CSD; ref. 9). Such an approach significantly reduces the dimensionality of the problem and, as a result, enables simpler methods (for example, systematic or random search) to be used (10, 11).
Thus far, only two global optimization methods have been used for crystal structure prediction. One of these, which does not rely on any statistical information about crystal packing, was developed by Karfunkel and Gdanitz (12). It is based on Monte Carlo simulated annealing with partial energy minimization carried out in every Monte Carlo step. Another global optimization method used for crystal structure prediction is the self-consistent basin-to-deformed-basin mapping method (13). It is based on deforming and smoothing the original potential energy surface, thereby greatly reducing the number of minima and simplifying the conformational search. This method also does not use statistical information. The self-consistent basin-to-deformed-basin mapping method has been applied to the crystal structure prediction of five small rigid organic molecules and to evaluating potentials (13).
A new, highly efficient global optimization method, Conformation-family Monte Carlo (CFMC), has been developed recently (14). Initially it was used to search the conformational space of proteins and identify their low energy conformations. In this paper we present a version of this method applied to crystal structure prediction. The efficiency of the method is demonstrated by predicting crystal structures of different degrees of complexity. Global optimizations are carried out for four rigid and five flexible H-, C-, N-, and O-containing molecules by using two different force fields, AMBER (5) and W99 (8). For rigid molecules, we found that the CFMC method is more efficient than the self-consistent basin-to-deformed-basin mapping method.
Methods
CFMC.
The CFMC method can be considered as an extension of the Monte Carlo-plus-minimization method (15, 16). The most important difference between the original Monte Carlo-plus-minimization and CFMC methods is that the latter does not use a single conformation for a Monte Carlo step; instead, it uses the whole family of conformations (and consequently only the moves between families are accepted or rejected), and the database of the families and structures encountered during the calculations is maintained throughout the simulation. The CFMC method already has been used successfully for predicting protein structures in a united-residue representation (14).
The central element of the CFMC method is the structure family database, which is an ensemble of structures clustered into families. To control the computational expense, the number of families and structures within each family are restricted to Nf families and Nc structures, respectively.
The structure family database for a CFMC run is initialized by successively generating Nf random structures and minimizing them. Each random structure is generated in two steps. First, the unit cell lengths (a, b, and c) are chosen at random between maximum and minimum values. The maximum length is calculated as 1.5nmolrmol, where nmol is the number of molecules in the unit cell and rmol is the molecular radius. The minimum length is half the maximum length. All the initial unit cell angles are set to 90°. Each molecule then is placed at a randomly selected position in the unit cell with fractional coordinates equal to [i/nmol, j/nmol, and k/nmol], where i, j, and k are random integer numbers from 0 to nmol − 1. It has been shown (17) that these positions are most likely to be occupied in a typical unit cell. The orientations of each molecule are chosen at random. For each randomly generated structure, the energy is evaluated before minimizing it; if this initial energy is higher than 108 kcal/mol (which indicates numerous clashes between atoms), the structure is rejected, and another random structure is generated. The set of minimized structures and their families constitute the initial structure family database.
Any two structures described by sets of structural parameters x1 and x2 belong to the same family of structures if the sets x1 and x2 are different descriptions of the same crystal structure and can be transformed one into the other. From a crystallographic point of view, the kinds of structures described above are equivalent (both can be transformed to the same standard representation), but from a numerical point of view they represent two completely different points in the phase-space of our variables, and therefore treating them as different structures makes the search much wider. The method used for structure comparison is discussed in the last subsection.
In each iteration of a CFMC run a new structure C′ is generated from a structure C already present in the structure family database. This structure C is chosen from a specific family F, denoted the generative family. As the CFMC simulation progresses, this generative family can change, as described below. For the first CFMC iteration, the generative family is set to the lowest energy family in the initial structure family database. An iteration of CFMC consists of four steps, as follows.
Step 1.
A structure C is chosen from the generative family F with a probability proportional to its Boltzmann weight.
Step 2.
This structure C is modified to yield a new structure C′. (The methods for modifying structures are described in the next subsection.) If the new structure is identical to another structure C′′ in the database (within numerical error), the lower energy structure of the pair is stored in the database, and the algorithm returns to step 1.
Step 3a.
If the new structure C′ does not belong to any family in the database, a new family F′ is created, the sole member of which is C′ (of course, structures may be added to this new family in subsequent CFMC iterations, as shown in step 3b). If the number of families in the database exceeds the limit Nf, the family with the highest energy is eliminated. The algorithm then jumps to step 4.
Step 3b.
If the new structure C′ belongs to a family F′ in the database, the structure is added to this family. If the number of structures in the family exceeds the limit Nc, the structure with the highest energy is eliminated. The algorithm then jumps to step 4.
Step 4.
If the new family F′ found in step 3 is not identical to the original generative family F of step 1, a Metropolis criterion is applied to determine whether to make F′ the generative family. F′ becomes the new generative family if it has a lower energy than F or if its Boltzmann factor exp(−βΔE) [with ΔE = (E − Emin)/(Emax − Emin), where Emax and Emin are maximum and minimum energies in a family (when choosing from a family) or in the whole database (when evaluating moves)] is greater than a randomly generated number in the interval (0,1), where β 1/kT as usual (β was equal to 0.01 in the present work) and ΔE is the energy difference between families F and F′. (The energy of a family is defined as that of its lowest energy structure.) If this Metropolis criterion is not met, then F remains the generative family. At this point, the algorithm returns to step 1, and a new CFMC iteration begins.
Methods for Producing New Structures.
In the second step of a CFMC iteration, the structure C is modified to yield a new structure C′. There are two general classes of moves used in the CFMC method: internal (or local) moves, intended to generate structures geometrically close to the starting structure C, and external (global) moves, intended to search the variable space for new families (and usually producing structures geometrically distant from the starting structure C). Within each class, there are three kinds of moves: perturbation, search, and averaging. There are 10 moves in the CFMC algorithm, five internal and five external.
Perturbations are used for searching the space of the molecular translations, rotations, and unit cell parameters. In the internal move 1 and the external move 1 all translations (positions) of molecules are perturbed randomly, whereas in the internal move 2 (and the external move 2) all the Eulerian angles of rotation of all molecules are perturbed randomly. The above internal moves differ form the corresponding external moves only by the range of perturbations. The external move 3 randomly perturbs all possible degrees of freedom (i.e., unit cell parameters, rotations, and translations for all molecules). The internal move 3 searches the rotations of all molecules in a systematic way by generating a three-dimensional grid for rotational degrees of freedom of each molecule one by one.
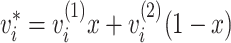
The external move 4 and the internal move 4 are both averaging. This is
an entirely different kind of move for which two different structures
are necessary. For external averaging, these structures are chosen from
different families, whereas for internal averaging, they are chosen
from the same family. From these two structures, an averaged (or
interpolated) structure then is calculated by using a randomly chosen
“mixing ratio” x (in the range from 0 to 1). Thus,
every variable
ν of
the averaged structure is calculated according to the formula:
of
the averaged structure is calculated according to the formula:
 |
1 |
where
ν and
ν
and
ν correspond to the two structures.
The external and internal moves 5 change the internal degrees of freedom of flexible molecules (and they are not used for rigid molecules). All torsional angles in all molecules are perturbed in these moves. A torsional angle is perturbed randomly when there is only one low energy conformation for that angle; otherwise the angle is perturbed with a step equal to the angular distance between low energy conformations to cover all distinct conformations.
Energy minimization was carried out for all newly generated structures. However, in most cases, random perturbations create structures with numerous atomic clashes, and a simple local minimization is very ineffective. This is because molecules in a crystal are tightly packed, and there is almost no room for any movement. The other problem that must be addressed is that some structures produced may be relatively large and loosely packed. The intermolecular interactions in such a loosely packed cell are relatively weak (i.e., the gradient components corresponding to variables that determine the spacial extension of a crystal are very small); thus, a local minimizer is usually found to choose to change unit cell angles instead of its lengths and molecular positions. This leads to extremely distorted structures (with one or more unit cell angles being unusually low), which are unphysical and cause serious numerical (accuracy) problems. This problem has been described previously in the literature (12).
To avoid these problems the local minimization is carried out in three steps. In the first and second steps, all angular variables are fixed. In the first step, the clashes are removed in the central unit cell only, i.e., the other unit cells are not taken into account. Each molecule (except molecule 1) is translated along the vector pointing from the first molecule to the current molecule until all clashes are removed. Then it is moved back along the same vector until the first intermolecular contacts are established. Second, the surrounding unit cells are added, and the clashes between molecules in different unit cells are relieved by adjusting unit cell parameters. These two steps are very similar to the procedure used by Gdanitz (18). Finally, in the third step local minimization with respect to all variables is carried out by using the SUMSL algorithm (19).
Calculation of Potential Energy.
The algorithm described by Gibson and Scheraga (20) was used for energy and gradient calculations. The potential energy is assumed to be a sum of pairwise interatomic interactions and includes three terms: electrostatic, nonbonded, and torsional:
 |
2 |
Electrostatic interatomic interactions were modeled by the Coulomb formula,
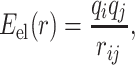 |
3 |
where qi and qj are point charges positioned on the atom sites. The electrostatic energy was calculated by using the Ewald summation (21) without including a dipole moment correction term.
The energy of nonbonded interactions was calculated with the Lennard-Jones “6–12” and Buckingham “6-exp” potential functions. The atom–atom contributions were summed in a special way to avoid small discontinuities of energy caused by the fact that nonbonded energy terms vanish only at infinity; these terms were smoothed (“feathered”) to zero at a large but finite distance by using a cubic spline and a cutoff (20), chosen so as to ensure that the energy and its first derivative are continuous everywhere. The 6–12 nonbonded atom–atom potential used in the present work is described by
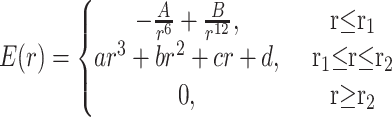 |
4 |
where a, b, c, d, and r1 and r2 are constants calculated for each pair of atoms (see ref. 20 for more details).
In the “6-exp-1” potential function, the total energy of an atom–atom interaction may go to minus infinity at short distances because of the much slower changes in the 6-exp part of the potential compared with the electrostatic part. To avoid this problem, a cubic approximation of the nonbonded energy was used for distances shorter than r1, the equilibrium interatomic distance for a given pair of atoms minus 1 Å; the parameters a0 and b0 were chosen so as to ensure that the energy and its first derivatives were continuous. The 6-exp potential is described by
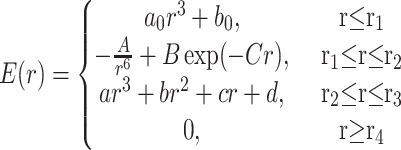 |
5 |
The torsional energy is calculated with a third-order Fourier expansion.
 |
6 |
where ω is a torsional angle; k1, k2, and k3 are torsional parameters obtained by fitting the torsional energy to the difference between ab initio and molecular mechanic (sum of nonbonded and electrostatic) profiles.
The basis vectors of the unit cell a, b, and c were chosen so that the direction of a coincides with the x axis, the vector b lies in the (x,y) plane, and the lattice vectors form a right-handed system. No crystal symmetry was assumed. During energy minimization, the torsional angles around bonds and all translation vectors tm of molecules, Euler angles φm, θm, ψm, and components ax, bx, by, cx, cy, and cz of the lattice vectors were allowed to vary independently.
Structure Comparison.
Our procedure for structure comparison consists of three steps. In the first step, the total lattice energies and the volumes of the unit cells of two structures i and j are compared. If the deviations are greater than some preset values, the structures are considered to be different. Otherwise, the second step consisting of comparison of unit cell parameters a, b, c, α, β, and γ is carried out. If the deviations in structural parameters are small (lower than some preset threshold), the structures are identical.
To distinguish between different structures and structures that are
different representations of the same structure, the following
procedure is used. For each structure, all interatomic distances within
a cutoff radius rd are calculated and
sorted according to their values, and the shortest 1,000 of these are
stored. The cutoff radius is chosen as d/2 <
rd < 3d/2, where
d is the largest component of the unit cell vectors. This
set of distances is used in the final (third) step of structure
comparison. If all of the differences
(r −
r
−
r )
are lower than some threshold value, the structures i and
j are different representations of the same structure;
otherwise they are different structures.
)
are lower than some threshold value, the structures i and
j are different representations of the same structure;
otherwise they are different structures.
Results and Discussion
A compilation of the molecules considered in the present paper together with their CSD reference codes is presented in Fig. 1. These molecules can be divided into two groups: (i) rigid molecules without internal rotations and (ii) flexible molecules with different numbers of internal rotations. The molecule containing an aliphatic ring was considered as rigid. The molecular parameters (bond lengths and bond and torsional angles) were taken from x-ray diffraction or neutron diffraction data (neutron structures were preferred when available). If more than one CSD entry was found for a given molecule, we selected the structure with the lowest x-ray diffraction discrepancy factor (R). Positions of the hydrogen atoms were adjusted to give the average experimental bond lengths of 1.083 Å for C–H, 1.009 Å for N–H, and 0.983 Å for O–H, as obtained by neutron diffraction (22). The atomic charges were obtained by fitting (23) to the molecular electrostatic potential obtained by ab initio calculations (ref. 24; HF 6-31G* in the case of AMBER and HF 6-31G** in the case of the W99 force field) for the experimental geometry. Additional lone-pair electron sites were included for nitrogens in heterocycles and in nonplanar amino groups as suggested in ref. 8.
Figure 1.

Molecular structures considered in this paper.
Local Minimization of Experimental Structures.
To obtain the reference structures for global search, all experimental crystal structures were locally minimized with the AMBER and W99 force fields. The parameters of the minimized experimental structures as well as the initial experimental parameters are given in Table 1.
Table 1.
Structural parameters of experimental and locally minimized experimental structures
| CSD reference code | Structure | Space group | V, Å3 | a, Å | b, Å | c, Å | α, ° | β, ° | γ, ° | ω, °* |
|---|---|---|---|---|---|---|---|---|---|---|
| BENZEN | exp. | Pbca, Z = 4 | 506.6 | 7.46 | 9.66 | 7.03 | 90.0 | 90.0 | 90.0 | — |
| AMBER | Pbca, Z = 4 | 455.6 | 7.36 | 9.20 | 6.72 | 90.0 | 90.0 | 90.0 | — | |
| W99 | Pbca, Z = 4 | 510.8 | 7.54 | 9.54 | 7.09 | 90.0 | 90.0 | 90.0 | — | |
| PRMDIN | exp. | Pna21, Z = 4 | 403.7 | 11.56 | 9.46 | 3.69 | 90.0 | 90.0 | 90.0 | — |
| AMBER | Pna21, Z = 4 | 393.7 | 11.22 | 9.74 | 3.61 | 90.0 | 90.0 | 90.0 | — | |
| W99 | Pna21, Z = 4 | 428.4 | 11.47 | 9.94 | 3.76 | 90.0 | 90.0 | 90.0 | — | |
| IMAZOL06 | exp. | P21/c, Z = 4 | 347.3 | 7.57 | 5.37 | 9.79 | 90.0 | 119.1 | 90.0 | — |
| AMBER | P21/c, Z= 4 | 326.0 | 8.12 | 4.81 | 9.85 | 90.0 | 121.9 | 90.0 | — | |
| W99 | P21/c, Z= 4 | 368.7 | 6.91 | 6.25 | 9.40 | 90.0 | 114.7 | 90.1 | — | |
| PHYPHM | exp. | P212121, Z = 4 | 747.6 | 6.14 | 12.25 | 9.94 | 90.0 | 90.0 | 90.0 | — |
| AMBER | P212121, Z = 4 | 726.6 | 6.13 | 12.09 | 9.81 | 90.0 | 90.0 | 90.0 | — | |
| W99 | P212121, Z = 4 | 770.4 | 6.51 | 12.32 | 9.61 | 90.0 | 90.0 | 90.0 | — | |
| DNITBZ03 | exp. | P21/a, Z = 2 | 333.5 | 10.94 | 5.38 | 5.67 | 90.0 | 92.1 | 90.0 | 10.2; 10.2 |
| AMBER | P21/a, Z = 2 | 331.5 | 10.55 | 5.79 | 5.47 | 90.0 | 97.5 | 90.0 | 10.6; −10.6 | |
| W99 | P21/a, Z = 2 | 377.7 | 11.11 | 6.06 | 5.68 | 90.0 | 99.2 | 90.0 | 10.4; −10.6 | |
| NHPOL03 | exp. | P21/c, Z = 4 | 611.9 | 6.17 | 8.84 | 11.54 | 90.0 | 103.4 | 90.0 | −1.2; 18.5 |
| AMBER | P21/c, Z = 4 | 594.1 | 6.13 | 8.96 | 11.13 | 90.0 | 103.7 | 90.0 | −3.3; 9.5 | |
| W99 | P21/c, Z= 4 | 671.8 | 6.58 | 9.14 | 11.61 | 90.0 | 105.8 | 90.0 | −0.4; 16.3 | |
| FORAMO01 | exp. | P212121, Z = 4 | 277.2 | 8.19 | 7.11 | 4.76 | 90.0 | 90.0 | 90.0 | −11.9; 1.7; 1.6 |
| AMBER | P212121, Z = 4 | 261.6 | 6.85 | 8.89 | 4.29 | 90.0 | 90.0 | 90.0 | −5.9; 0.1; 6.0 | |
| W99 | P212121, Z = 4 | 300.8 | 7.70 | 8.84 | 4.42 | 90.1 | 90.0 | 90.0 | 3.0; 0.4; 3.4 | |
| BENZON10 | exp. | P21/c, Z = 4 | 1011.9 | 12.16 | 7.92 | 11.94 | 90.0 | 118.4 | 90.0 | −11.7; 176.1; −56.9 |
| AMBER | P21, Z= 4 | 923.4 | 11.87 | 7.52 | 11.96 | 90.0 | 120.1 | 90.0 | −10.8; 179.8; −54.1 | |
| W99 | P21/c, Z = 4 | 1017.0 | 11.97 | 8.37 | 11.85 | 90.0 | 121.0 | 90.0 | −0.7; 179.5; −66.8 | |
| LIQVUC | exp. | P21/n, Z = 4 | 435.5 | 6.17 | 8.01 | 9.26 | 90.0 | 107.7 | 90.0 | 68.6; 69.7; 68.5; −129.7 |
| AMBER | P21, Z = 4 | 405.3 | 5.98 | 7.34 | 10.04 | 90.0 | 113.2 | 90.0 | −58.2; 143.2; 5.1; 56.5 | |
| W99 | P21, Z= 4 | 485.9 | 6.237 | 8.315 | 9.85 | 90.0 | 107.99 | 90.1 | 82.3; 69.5; 69.0; −20.3 |
Torsional angle.
On the average, deviations of the parameters of the minimized structures from their experimental values are much larger for the five flexible molecules than for the four rigid ones. This is expected, because even quite small deviations in torsional angles may cause significant changes in molecular conformation. This was the case for FORAMO01 (AMBER and W99) for which the largest average deviations of the unit cell parameters of 8.6% for AMBER and 6.2% for W99 were obtained. The experimental values of the torsional angles were reproduced quite well for all flexible molecules except FORAMO01 and LIQVUC. Deviations of the torsional angles obtained for LIQVUC influenced the quality of the minimized crystal structure insignificantly because the largest deviations were obtained for rotations of “spherical” methyl groups. Average deviations of the unit cell parameters from their experimental values for the rigid molecules are quite small and similar for both force fields (1.92% for AMBER and 2.23% for W99). Larger deviations were observed for IMIDAZ06 crystal structure minimized with the AMBER (4.36%) and W99 (5.46%) potentials. The symmetry of the experimental structures was preserved after energy minimization for all rigid molecules as well as for DNITBZ03, NITPOL03 and FORAMO01. For BENZON10 and LIQVUC, local minimization of the lattice energy without any symmetry constraints led to the space group P21 with two independent molecules in the unit cell, suggesting defects in the force fields for these two molecules.
Global Optimization.
Global optimization runs were carried out for all the molecules shown in Fig. 1 using 5,000 local minimizations in each global optimization. The number of molecules in the unit cell, Z, was chosen as the number of molecules in the experimental crystal structure, and no symmetry constraints were used. In the case of chiral molecules, two global optimization runs have to be carried out: one with the L (or R) enantiomer and the other one with the racemic mixture. The only chiral molecule (according to the x-ray experimental data) in our list is PHYPHM, which forms an optically active crystal with the symmetry P212121. The results of global minimizations with the W99 and the AMBER force fields are summarized in Table 2.
Table 2.
Results of global search with the AMBER and W99 force fields
| CSD reference code | W99
|
AMBER
|
||||
|---|---|---|---|---|---|---|
| Rank* | ΔE† | E‡ | Rank* | ΔE† | E‡ | |
| BENZEN | 2 | 0.19 | −10.10 | 3 | 0.14 | −11.20 |
| PRMDIN | 10 | 0.11 | −12.19 | 82 | 0.55 | −15.97 |
| IMAZOL06 | 24 | 0.79 | −16.28 | 1 | 0.02 | −19.47 |
| PHYPHM | 0 | 0.00 | −22.02 | 0 | 0.00 | −29.56 |
| DNITBZ03 | 0 | 0.00 | −19.34 | 0 | 0.00 | −32.41 |
| NITPOL03 | 18 | 1.44 | −19.09 | 8 | 0.87 | −28.69 |
| FORAMO01 | >200 | 3.82 | −15.29 | >200 | 6.68 | −36.69 |
| BENZON10 | 0 | −0.72 | −22.63 | 0 | −0.71 | −26.96 |
| LIQVUC | 1 | 0.04 | −13.09 | 4 | 0.52 | −19.37 |
Number of structures with energies lower than the energy of the minimized experimental structure.
Difference between the energy of the minimized experimental structure and the energy of the lowest minimum found (kcal/mol). Negative values indicate that the global search failed to find a structure with energy lower or equal to the energy of the reference structure.
Lattice energy of the minimized experimental structure (kcal/mol).
The first four molecules in Table 2 are rigid. In its current form, the method seems to perform well for these molecules; the energy of the global minimum found for each molecule is always lower or equal to the energy of the corresponding minimized experimental structure. In all cases except one (PRMDIN with the AMBER force field), the minimized experimental structure was found with both force fields even when it was not one of the lowest minima, as in the case of IMAZOL06 (with the W99 force field) where the minimized experimental structure has a high rank of 24. The only molecule for which the reference structure was not found is PRMDIN, but its rank is ≈82 with AMBER, which is out of the search range. Both force fields performed reasonably well for the rigid molecules except IMAZOL06 with the W99 and PRMDIN with the AMBER force field.
The results with the set of flexible molecules are not as good as with the rigid molecules. This set of flexible molecules consists of molecules of different levels of flexibility varying from two to four torsional angles per molecule. The simplest of all was DNITBZ03 (two torsional angles and Z = 2) for which the search method as well as both force fields performed very well in finding the reference structure as the global minimum. The second molecule with two torsional degrees of freedom was NITPOL03, but this crystal is more complicated because of the possibility of forming different networks of hydrogen bonds. The minimized experimental structure had the rank of 8 and 18 for the AMBER and the W99 force fields, respectively, and was never found by the global search. The two molecules with three torsional degrees of freedom were FORAMO01 and BENZON10. In the case of BENZON10, the search method failed to produce structures lower or equal in energy to the minimized experimental structure. The crystal structure of FORAMO01 probably was the most difficult to predict among all structures considered in this paper. The number of possible hydrogen bond networks for this molecule is very large, and the difference in stability between them is usually small. Thus, the quality of the atom–atom potentials used should be crucial in this case. The minimized experimental structure of FORAMO01 has an extremely high rank for both force fields. Taking into account large structural deviations obtained for the reference structure relative to the experimental one (Table 1), we conclude that both force fields are clearly inadequate for this molecule, making the prediction almost impossible. For the last two molecules in the set, the search method had problems locating low energy structures. For LIQVUC, the reference structure was not found either for the AMBER or W99 force field. With W99, the reference structure had an energy slightly higher (0.04 kcal/mol) than the energy of the lowest minimum found. The a, b, and c unit cell parameters and the molecular torsional angles are similar for the reference and for our lowest energy structures, although the crystal structures are different. These results suggest that the presence of additional torsional degrees of freedom requires more extensive search than that used in this work.
The global optimization results show that the method performs well for rigid molecules and simple flexible molecules, although for molecules with a larger number of torsional degrees of freedom, the search does not cover the conformational space as well. Most likely the reason is an insufficient number of local minimizations during the global search. The CFMC method applied to a small protein such as Protein A (ref. 12; 43 principal degrees of freedom) usually required 50,000 local minimizations to converge. There is no reason to believe that the global optimization of crystals is a less demanding task. However, the energy calculation for a crystal is quite expensive, and this has limited us thus far to the 5,000 local minimizations per run. Reduction of the cost of a single local energy minimization would probably improve the performance of the algorithm.
Acknowledgments
This research was supported by National Institutes of Health Grant GM-14312, National Science Foundation Grant MCB00-03722, and Fogarty Foundation Grant R03 TW1064. This work was carried out by using computational resources provided in part by (i) the Cornell Theory Center, which receives funding from Cornell University, New York State, the National Center for Research Resources at the National Institutes of Health (P41RR-04293), and members of the Theory Center's Corporate Partnership Program, and (ii) with our own array of 55 dual-processor PC computers.
Abbreviations
- CFMC
Conformation-family Monte Carlo
- CSD
Cambridge Structural Database
References
- 1.Verwer P, Leusen F J J. Rev Comput Chem. 1998;12:327–365. [Google Scholar]
- 2.Gavezzotti A, Filippini G. J Am Chem Soc. 1995;117:12299–12305. [Google Scholar]
- 3.Lommerse J P M, Motherwell W D S, Ammon H L, Dunitz J D, Gavezzotti A, Hofmann D W M, Leusen F J J, Mooij W T M, Price S L, Schweizer B, et al. Acta Crystallogr B. 2000;56:697–714. doi: 10.1107/s0108768100004584. [DOI] [PubMed] [Google Scholar]
- 4.Pertsin A J, Kitaigorodsky A I. The Atom-Atom Potential Method: Applications to Organic Molecular Solids. New York: Springer; 1987. [Google Scholar]
- 5.Cornell W D, Cieplak P, Bayly C I, Gould I R, Merz K M, Ferguson D M, Spellmeyer D C, Fox T, Caldwell J W, Kollman P A. J Am Chem Soc. 1995;117:5179–5197. [Google Scholar]
- 6.Ewig C S, Thacher T S, Hagler AT. J Phys Chem. 1999;B103:6998–7014. [Google Scholar]
- 7.Mooij W T M, van Duijneveldt F B, van Duijneveldt-van de Rijdt J G C M, van Eijck B P. J Phys Chem. 1999;A103:9872–9882. [Google Scholar]
- 8.Williams D E. J Comput Chem. 2001;22:1154–1166. [Google Scholar]
- 9.Allen F H, Kennard O, Taylor R. Acc Chem Res. 1983;16:146–153. [Google Scholar]
- 10.Eijck B P, van Spek A L, Mooij W T M, Kroon J. Acta Crystallogr B. 1998;54:291–299. [Google Scholar]
- 11.Eijck B P, van Kroon J. Acta Crystallogr B. 2000;56:535–542. doi: 10.1107/s0108768100000276. [DOI] [PubMed] [Google Scholar]
- 12.Karfunkel H R, Gdanitz R J. J Comput Chem. 1992;13:1171–1183. [Google Scholar]
- 13.Pillardy J, Wawak R J, Arnautova Y A, Czaplewski C, Scheraga H A. J Am Chem Soc. 2000;122:907–921. [Google Scholar]
- 14.Pillardy J, Czaplewski C, Wedemeyer W J, Scheraga H A. Helv Chim Acta. 2000;83:2214–2230. [Google Scholar]
- 15.Li Z, Scheraga H A. Proc Natl Acad Sci USA. 1987;84:6611–6615. doi: 10.1073/pnas.84.19.6611. [DOI] [PMC free article] [PubMed] [Google Scholar]
- 16.Li Z, Scheraga H A. J Mol Struct. 1988;179:333–352. [Google Scholar]
- 17.Motherwell W D S. Acta Crystallogr B. 1997;53:726–736. [Google Scholar]
- 18.Gdanitz R J. Chem Phys Lett. 1992;190:391–396. [Google Scholar]
- 19.Gay D M. ACM Trans Math Software. 1983;9:503–524. [Google Scholar]
- 20.Gibson K D, Scheraga H A. J PhysChem. 1995;99:3752–3764. [Google Scholar]
- 21.Ewald P. Ann Phys. 1921;64:253. [Google Scholar]
- 22.Desiraju G R, Steiner T. The Weak Hydrogen Bond in Structural Chemistry and Biology. Oxford: Oxford Univ. Press; 1999. p. 507. [Google Scholar]
- 23.Bayly C I, Cieplak P, Cornell W D, Kollman P A. J Phys Chem. 1993;97:10269–10280. [Google Scholar]
- 24.Schmidt M W, Baldridge K K, Boatz J A, Elbert S T, Gordon M S, Jensen J H, Koseki S, Matsunaga N, Nguyen K A, Su S J, et al. J Comput Chem. 1993;14:1347–1363. [Google Scholar]