

Abstract
Rest-activity rhythm (RAR) disturbances are associated with mood disorders. But there remains a need to identify the particular RAR profiles associated with psychiatric symptom dimensions. Establishing such profiles would support the development of tools that track the 24-hour sleep-wake phenotypes signaling clinical heterogeneity. We used data-driven clustering to identify RAR profiles in 145 adults aged 36–82 years (mean=60, standard deviation=9). Then we evaluated psychiatric symptom dimensions (including positive and negative affect, depressive, manic-hypomanic, panic-agoraphobic, and substance use symptoms) associated with these empirically-derived RAR profiles. Clustering identified three sub-groups characterized, on average, by: (1) earlier and more robust RARs (“earlier/robust,” n=55, 38%); (2) later and irregular RARs (“later/irregular,” n=31, 21%); and (3) later RARs and a narrower active period (“later/narrower,” n=59, 41%). Compared with the “earlier/robust” group: the “later/irregular” group had higher levels of lifetime manic-hypomanic symptoms (β (standard error)=0.80 (0.22) higher standardized symptom units, p=0.0004) and lifetime depression symptoms (β (standard error)=0.73 (0.21) higher standardized symptom units, p=0.0009); the “later/narrower” group had more lifetime depression symptoms (β (standard error)=0.48 (0.18) higher standardized symptom units, p=0.0076). These associations persisted after adjustments for sleep continuity and duration, suggesting that RARs are distinct behavioral correlates of clinical heterogeneity. Longitudinal studies are needed to confirm whether RAR characteristics contribute to the risk of manic and/or depressive episodes, and whether they reflect the consequences of psychiatric disturbance (e.g., on quality of life or disability). Opportunities to monitor or intervene on objectively-assessed RARs could facilitate better mental health related outcomes.
Keywords: mania symptoms, depression, sleep-wake, rest-activity, cluster analysis
Recognizing the behavioral correlates of psychiatric symptoms can benefit our understanding of these symptoms and how they affect people. Sleep-wake behaviors, in particular, are part of current psychiatric diagnostic criteria (e.g., sleeping too little or too much in depressive disorders; and decreased need for sleep in manic episodes). Circadian aspects of sleep-wake behaviors, e.g., a sleep timing preferences (Antypa et al., 2016; Hasler et al., 2010; Hasler et al., 2012; Miller et al., 2015) and the regularity of social behaviors (Alloy et al., 2015; Brown et al., 1996; Frank et al., 2005; Haynes et al., 2005; Malkoff-Schwartz et al., 1998; Shen et al., 2008; Sylvia et al., 2009), are also associated with mood disturbances. But there remains a need to identify objective measures which characterize the 24-hour sleep-wake phenotypes associated with psychiatric symptom dimensions. Establishing such objective markers could more reliably distinguish patient subtypes, suggest clues regarding the underlying pathophysiology, and identify new targets for treating or monitoring the behaviors inter-twined with psychiatric symptoms.
Rest-activity rhythms (RARs) are derived from actigraphy, measured in real-world settings, to objectively quantify different aspects of 24-hour sleep-wake behaviors. RAR measures are conceptually distinct from behavioral assessments that consider activity and sleep separately. Wrist actigraphs are typically used only to estimate sleep variables such as total sleep time and sleep efficiency. In contrast, RAR measures quantify the regularity, shape, and timing of repeated 24-hour sleep-wake cycles.
Past research into the RARs correlates of mental health has mostly focused on depression (for recent review, see Smagula (2016)). Clinically significant depression is associated with altered RAR timing (Maglione et al., 2013; Robillard et al., 2015; Smagula et al., 2015a; Smagula et al., 2015b) and regularity (Luik et al., 2015; Luik et al., 2013; Maglione et al., 2013; Smagula et al., 2015a). However, certain RAR characteristics may also be shared across psychiatric disorders (i.e., not specific to depression but associated with symptom dimensions shared across disorders). Robillard et al. (2015) found that patients with depression had later RAR timing and RAR curves that were less distinctly square. These RAR characteristics were shared across disorders: patients with anxiety and bipolar disorder also had later RAR timing, and patients with psychotic symptoms also had less distinctly steep/“square-like” RARs.
In addition, past research suggests individual RAR characteristics tend cluster together, within people, to form distinct RAR profiles (i.e., multivariate combinations of several individual RAR characteristics). For example, several sub-groups with distinct combinations of multiple RAR characteristics exist among community-dwelling older men (Smagula et al., 2015b); these sub-groups differ in the rate of depression symptom increases independent of other covariates including sleep measures. We also recently observed, among older strained dementia caregivers, that several inter-correlated RAR measures (i.e., earlier evening settling, a shorter active period, and having less steep/“square-like” RARs) marked greater levels of sub-threshold depression symptom severity (Smagula et al., 2017). This suggests individual RAR characteristics cluster together within people, and indicates the need to describe the multivariate RAR profiles prevalent in public health relevant groups (in addition to examining the health relevance of individual RAR variables).
To build on this existing evidence, we empirically derived sub-groups that share similar RAR profiles (similar multivariate patterns of RAR characteristics) and then characterized their mental health across multiple symptom dimensions. Our study sample included some individuals with no prior depression history but deliberately oversampled people with a history of major depressive disorder. A history of depression often comes with residual mental health symptoms or risk, therefore, this sample was enriched for the pathology under study. We expected that having a history of depression would co-segregate with RAR profiles. We also expected that among people with prior depression, there would be multiple distinct RAR profiles associated with different symptom dimensions. In summary, we aimed to characterize the psychiatric symptom dimensions associated with different RAR profiles in people with and without a history of major depressive disorder. We also assessed whether associations between RAR profiles and psychiatric symptoms were attributable to night-time sleep measures or, alternatively, whether RAR profiles captured behaviors that explain variance in mental health distinctly from sleep.
Materials and methods
Participants and protocol
Data were collected from 2010–2014 when RARs were measured. Participants in the current study were recruited from databases of four prior studies conducted at the University of Pittsburgh between 1982 and 1999. Three of these original studies only included adults with major depressive disorder (MH029618, PI: Kupfer; MH049115, PI: Frank; MH041884, PI: Thase), and one study (MH024652, PI: Kupfer) examined sleep in adults without psychiatric disorders. Other psychiatric disorders and substance abuse were exclusionary criteria for all four studies. This study was approved by the University of Pittsburgh Institutional Review Board (PRO10030034), and all participants provided written informed consent prior to data collection.
A total of 157 individuals met inclusion/exclusion criteria. Participants wore an Actiwatch 2® (Philips Respironics, Bend, OR, USA) on the non-dominant wrist for approximately one week. Data was collected in 30 second epochs. The analytic sample included only participants who contributed adequate actigraphy data to measure RARs (defined as a minimum of 4 days of recording). Periods of watch removal (e.g., due to bathing) were treated as missing so that they did not unduly influence the analysis (e.g., if we were to set such periods to “0” activity). Visual inspection and sleep diaries were used to detect and exclude epochs of repeated “0” counts outside known resting intervals. A total of 145 individuals met this criterion and had an average of 9.2 days (1.9 standard deviation) of actigraphy recording. Analytic sample sizes for each multivariable model are specified in the tables (e.g., minimal model n=136 for analyses including sleep covariates).
Rest-activity rhythm measures
We quantified RARs using six standard variables: three from parametric (extended cosine-based (Marler et al., 2006) modeling, and three from a non-parametric approach (Witting et al., 1990). The parametric approach was implemented using SAS to derive information about RAR timing and shape. The three parametric measures were: (A) a timing variable, referred to as acrophase, defined as the time where activity peaks in the modeled rhythm, (B) RAR alpha, a parameter indicating the relative width of active to rest periods (higher alpha indicates more narrow active relative to resting periods), and (C) RAR beta, a parameter indicating the steepness of the RARs (higher values indicate more steep or “square-like” RARs).
The non-parametric approach to quantifying RARs (Witting et al., 1990) was used to assess RAR robustness (rhythmicity and amplitude) without making assumptions about RAR shape. Using R Software (R Development Core Team, 2013) and the package ‘nparACT’ (Blume et al., 2016), we calculated: (A) intradaily variability, defined as the ratio of the hour-to-hour activity variability to the overall activity variability (higher values reflect more fragmented rhythms, e.g., due to frequent daytime napping or night-time awakenings), (B) interdaily stability, defined as the ratio of variability within the mean 24-hour activity profile to the overall activity variability (higher values indicate the typical 24-hour profile accounts for a greater degree of the overall variability in the time series recording, reflecting greater stability of the mean 24-hour profile across days), and (C) relative amplitude, defined as the difference, between the average levels of activity during the most active 10 hours of the day and the least active 5 hours of the day, standardized to overall activity level (higher values indicate a greater RAR amplitude).
Mental health measures
We measured a lifetime history of major depression ascertained using a structured clinical interview (the Structured Clinical Interview for DSM-IV (First, 2002)). Current mental health symptoms were measured using the 17-item Hamilton Depression Rating Scale (Hamilton, 1960) with sleep items removed, the Penn State Worry Questionnaire (Meyer et al., 1990) (reflecting anxiety symptoms), and the subscales of the Positive and Negative Affect Schedule (Watson et al., 1988) (reflecting positive and negative affect). Lifetime history of mental health symptoms was assessed using self-reported Spectrum Assessments of lifetime: mood symptoms (Dell’Osso et al., 2002) (separately assessing depressive and manic-hypomanic symptoms), panic-agoraphobic symptoms (Shear et al., 2001), and substance use (self-report used but for a description of the parallel structured clinical interview see (Sbrana et al., 2003)). The Spectrum assessments are designed to generate a dimensional profile of the wide ranging clinical phenomena that surround standard diagnostic criteria (see http://www.spectrum-project.org/intro.html).
Night-time sleep covariates
We sought to determine whether the identified RAR profiles were uniquely associated with mental health, or whether the relationship between RAR profiles and mental health was simply due to differences in the RAR groups’ sleep. Thus, we tested whether the RAR groups derived using data-driven clustering were related to mental health measures independent of night-time sleep measures. We used two common sleep measures: the number of minutes awake after sleep onset (or WASO, a measure of sleep fragmentation calculated as the number of minutes awake (after sleep onset) before the final awakening) and total night-time sleep time (a measure of sleep duration). Each of these measures were averages derived across multiple days of actigraphy data collection, which occurred in participants’ home settings, reasoning that multiple days of recording outside of the laboratory setting would most reliably reflect participants’ usual sleep habits.
Statistical methods
We conducted person-centered clustering using finite normal mixture modeling, fit with the expectation maximization algorithm, implemented using the R Software package ‘MClust’ (Scrucca et al., 2016). The RAR variables described above were entered, and we considered models that had different numbers of groups and covariance structures (see Supplemental Table 1). We used the Bayesian Information Criterion (BIC) to select the optimal model, but specified a priori that we would reject solutions which included groups composed of <10% of the sample. Using the optimal model identified with BIC, for descriptive purposes, we evaluated how the derived groups differed in terms of their average RAR measures.
We then examined whether the derived RAR groups differed in terms of their mental health characteristics. Mental health characteristics that significantly differed (at p<0.05 for the overall test of any differences across the RAR groups) were selected for multivariable analysis. Multivariable regression models were used to assess whether night-time sleep characteristics accounted for the associations observed between RAR group and mental health characteristics. For these analyses, we standardized the scale of each mental health variable to their respective overall standard deviations to facilitate comparisons of effect size. Age and sex were included in all regression models.
We also report individual Spearman correlations: between the individual RAR parameters (Supplemental Table 2) and between the RAR and mental health variables (Supplemental Table 3).
Results
Empirically derived RAR subgroups
BIC indicated the optimal solution had three-groups with diagonal varying volumes and shapes (Supplemental Table 1). The groups derived from this solution were demographically similar but meaningfully different in terms of their average RAR characteristics (Figure 1 and Table 1). The clustering was designed to maximize mean differences across empirically derived groups. To illustrate the main differences driving these clusters, we assessed pairwise differences between each group and a comparison group labeled “earlier/robust” (based on the observation that they had relatively earlier acrophase timing and the highest average robustness measures (higher inter-daily stability, lower intra-daily variability, and higher relative amplitude); see Supplemental Table 4). The second cluster (labeled as “later/irregular”) had average RAR measures that were significantly lower for inter-daily stability and relative amplitude, higher for intra-daily variability and RAR beta (reflecting more “square-like” modeled rhythms), and with a later acrophase. The third cluster (labeled “later/narrower”) also had significantly lower inter-daily stability and relative amplitude, with a later average acrophase time, and also higher RAR alpha (a relatively narrower active period). To illustrate these RAR profiles, we show participants with RAR characteristics that are approximately their group’s mean values (Figure 2).
Figure 1.

Scatter plots showing differences in RAR variables across clusters. Scatter plots are shown for each pair of RARvariables stratified by the derived RAR-groups. For each scatter plot, each individual is represented by a single dot, and the group they belong to is indicated in the Key.
Table 1.
Demographic and RAR characteristics by RAR cluster
| “Earlier/Robust” (n=55, 38%) | “Later/Irregular” (n=31, 21%) | “Later timing/narrower” (n=59, 41%) | Test-statistic | df | p | |
|---|---|---|---|---|---|---|
| Demographics | ||||||
| Age | 58.33 (9.01) | 61.41 (7.9) | 60.92 (8.95) | 1.72 | 144 | 0.18 |
| Female gender, percent (n) | 73 (40) | 61 (19) | 68 (40) | 1.21 | 2 | 0.54 |
| White race, percent (n) | 96.4 (56) | 94 (29) | 93 (55) | 0.61 | 2 | 0.74 |
| BMI | 29.37 (5.77) | 31.41 (9.43) | 31.46 (6.77) | 1.43 | 139 | 0.24 |
| Rest-activity rhythms (RARs) | ||||||
| Inter-daily stability (stability across days) | 0.58 (0.11) | 0.35 (0.19) | 0.50 (0.08) | 34.57 | 144 | <0.0001 |
| Intra-daily variability (fragmentation) | 0.76 (0.20) | 0.92 (0.20) | 0.76 (0.14) | 9.94 | 144 | <0.0001 |
| Relative amplitude | 0.93 (0.03) | 0.66 (0.23) | 0.87 (0.06) | 55.87 | 144 | <0.0001 |
| RAR alpha (relative narrowness of activity period) | −0.48 (0.09) | −0.43 (0.35) | −0.38 (0.17) | 3.35 | 144 | 0.04 |
| RAR beta (degree of “square-like” curves) | 10.07 (4.53) | 29.6 (59.16) | 5.12 (1.46) | 8.42 | 144 | 0.0004 |
| Acrophase (time of modeled rhythm peak) | 14.23 (0.70) | 15.89 (1.76) | 15.37 (1.03) | 25.48 | 144 | <0.0001 |
| Categorical diagnosis of major depression, percent (n) | 45% (25) | 55% (17) | 63% (37) | 3.42 | 2 | 0.18 |
| Current mental health symptoms | ||||||
| HRSD-17 | 4.80 (4.45) | 7.19 (5.95) | 6.71 (6.16) | 2.49 | 144 | 0.09 |
| HRSD-17 w/sleep items removed | 3.51 (3.89) | 5.10 (5.29) | 5.00 (5.25) | 1.74 | 144 | 0.18 |
| Penn State Worry Questionnaire | 30.58 (18.68) | 35.16 (22.62) | 32.28 (16.27) | 0.60 | 143 | 0.55 |
| Negative affect | 14.09 (6.05) | 15.13 (6.73) | 15.19 (6.52) | 0.48 | 144 | 0.62 |
| Positive affect | 31.65 (7.23) | 27.48 (9.56) | 29.49 (7.60) | 2.87 | 144 | 0.06 |
| Lifetime mental health symptoms (from Spectrum) | ||||||
| Depression | 15.76 (16.74) | 26.61 (18.15) | 23.07 (17.23) | 4.60 | 144 | 0.01 |
| Mania | 8.58 (8.18) | 17.10 (12.93) | 11.07 (10.66) | 6.76 | 144 | 0.002 |
| Substance use | 10.27 (8.66) | 15.84 (14.91) | 13.83 (10.36) | 2.92 | 143 | 0.06 |
| Agoraphobia-panic | 14.22 (13.47) | 22.48 (21.25) | 19.73 (16.06) | 2.93 | 144 | 0.06 |
| Sleep measures (in minutes) | ||||||
| Total sleep time | 413 (46) | 404 (68) | 421 (55) | 0.95 | 135 | 0.39 |
| Wake after sleep onset | 34 (13) | 53 (34) | 45 (22) | 6.52 | 135 | 0.002 |
Chi-square tests were used for differences in proportions; Analysis of Variance tests were used for differences in means
Figure 2.
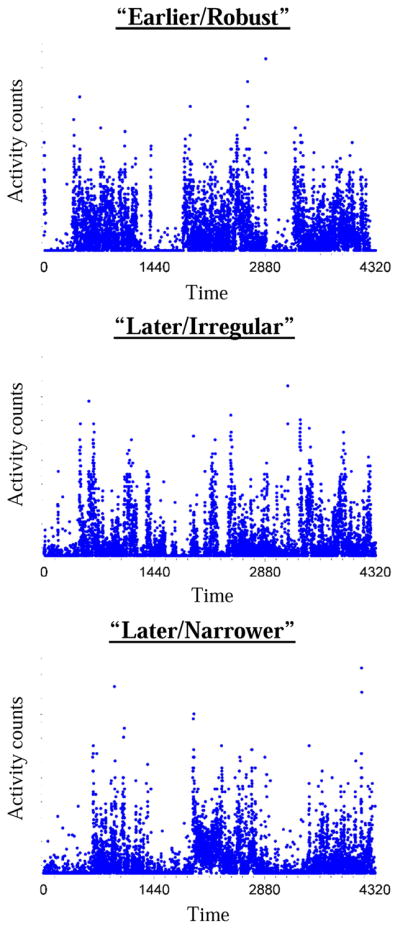
Illustrative participants from each cluster. Time is in minutes from midnight. Three days of recording is shown. Groups differences are described in the text and quantified in Table 1. Compared with the top individual, the middle individual has the most dampened and unstable rhythm, followed by the bottom individual who narrower active periods.
Mental health measures associated with RAR sub-groups
Categorical diagnoses of lifetime major depressive disorder did not significantly differ across the groups (p=0.18, Table 1; Supplemental Table 6 shows sample size, age, sex, and antidepressant use by categorical MDD diagnoses). In terms of current mental health symptomology, we found only trend-level differences between the RAR groups in the level of current positive affect. Statistically significant differences across the groups were only detected in terms of lifetime depressive and manic-hypomanic symptoms (measured with the Spectrum; Table 1).
In age- and sex-adjusted models (base models in Table 2), compared with the “earlier/robust” group, the “later/irregular” group had greater levels of Spectrum-assessed lifetime manic-hypomanic and depressive symptoms. Compared with the “earlier/robust” group, the “later/narrower” group had greater Spectrum-assessed lifetime depressive symptoms (Table 1). When compared with the “later/irregular” group, the “later/narrower” did not have significantly different lifetime depression symptom severity (p=0.24, t=−1.18, df=140). The associations were not altered by adjusting for educational attainment.
Table 2.
Associations of RAR group with depressive and manic-hypomanic symptoms after separate adjustment for sleep measures and each other
| “Early/Robust” | “Later/Irregular” | “Later timing/narrower” | |||||
|---|---|---|---|---|---|---|---|
|
|
|||||||
| β (SE) | Test-statistic | p | β (SE) | Test-statistic | p | ||
|
|
|||||||
| Models of manic-hypomanic symptoms | (Reference) | ||||||
|
|
|||||||
| Base model | 0.80 (0.22) | 3.63 | 0.0004 | 0.23 (0.18) | 1.27 | 0.2051 | |
| Base model + WASO (n=136) | 0.55 (0.21) | 2.55 | 0.0118 | 0.08 (0.17) | 0.49 | 0.6282 | |
| Base model + TST (n=136) | 0.76 (0.22) | 3.51 | 0.0006 | 0.19 (0.17) | 1.09 | 0.2789 | |
| Models of depressive symptoms | (Reference) | ||||||
|
|
|||||||
| Base model | 0.73 (0.21) | 3.40 | 0.0009 | 0.48 (0.18) | 2.71 | 0.0076 | |
| Base model + WASO (n=136) | 0.43 (0.22) | 1.93 | 0.0553 | 0.35 (0.17) | 2.01 | 0.0467 | |
| Base model + TST (n=136) | 0.67 (0.22) | 2.97 | 0.0035 | 0.46 (0.18) | 2.57 | 0.0113 | |
All models are adjusted for age and sex; Mental health measures here are both from the Spectrum lifetime self-report version; degrees of freedom=140;
There were several Spearman correlations between the individual RAR characteristics and symptom dimensions (Supplemental Table 3) that were small (|r|<0.30) but statistically significant. These included correlations between: lower inter-daily stability with higher lifetime substance use; greater relative amplitude with less current depression symptoms, worse current positive affect, less lifetime depression, manic-hypomanic, substance use, and agoraphobic symptoms; more narrow active periods with more current depression symptoms, current worry, lifetime depression, manic-hypomanic, and agoraphobia-panic symptoms; and later acrophase with more current depression symptoms, lifetime depression, manic-hypomanic, and agoraphobia-panic symptoms.
Independence of the RAR group-symptom dimension associations from sleep continuity and duration
The association of being in the “later/irregular” group with greater lifetime manic-hypomanic symptoms was most strongly attenuated by adjustment for the average minutes of WASO (44% attenuation). The association between being in the “later/irregular” group with greater lifetime depressive symptoms was also most strongly attenuated after adjusting for WASO (41% attenuation). Similarly, of the sleep variables, the association between being in the “later/narrower” group with greater lifetime depressive symptoms was also most strongly attenuated by adjustment for WASO (attenuation was 27%). Adjustment by sleep duration variables did not substantially attenuate the associations of RAR profiles with these symptom dimensions.
Variance explained by categorical RAR cluster compared with individual RAR variables
As shown in Supplemental Table 5, the clusters explained 9% of the variance in the mania outcome variable, whereas continuous levels of relative amplitude, RAR alpha, and acrophase numerically explained more (21%, 11%, and 11%, respectively). None of the individual variables explained numerically more than the 14% of variance in depression symptoms explained by the clusters.
Discussion
Our study identified distinct subgroups of adults who differ in terms of their objectively measured RAR profiles. Using a sample that over-represented people with a history of depression, we first identified subgroups that shared similar RAR characteristics across multiple variables. The subgroups identified and the individual correlations between the RAR variables (Supplemental Table 2) are consistent with prior evidence that having low RAR robustness most often co-occurs with later activity timing (Smagula et al., 2015b). Recent literature found young adults with a delayed sleep-wake profile also had delayed markers of circadian phase (Carpenter et al., 2017), suggesting later sleep-wake or RAR timing may reflect a delayed internal clock or weaker entrainment to daytime zeitgebers.
We did not detect statistically significant differences in the rate of lifetime major depression diagnoses between these RAR subgroups. Rather, the groups differed in terms of lifetime symptom expression assessed with continuous dimensional measures (from the Spectrum). These findings suggest that, when compared with categorical depression diagnoses, the dimensional Spectrum measure captures heterogeneity in mental health that is more closely linked with RAR profiles. Such findings could be related to greater statistical power associated with continuous vs. categorical measures, or to subtle aspects of psychiatric conditions that are better reflected in the more nuanced Spectrum measures. Associations between subgroups and symptomology persisted after adjustments for night-time sleep continuity and duration, suggesting these RAR profiles uniquely characterize differences in symptom expression.
These observations are consistent with but extend past literature relating rhythm disruption and mood disturbance (Ehlers et al., 1988). Irregular social rhythms are associated with both depression (Brown et al., 1996; Frank et al., 2005; Haynes et al., 2005; Shen et al., 2008; Sylvia et al., 2009) and mania (Alloy et al., 2015; Malkoff-Schwartz et al., 1998). Delayed sleep-wake timing has also previously been associated with mood disturbances (Morita et al., 2015). Prior literature that has found shorter active periods (Smagula et al., 2015b; Smagula et al., 2017) and later timing (Robillard et al., 2015; Smagula et al., 2015a; Smagula et al., 2015b) objectively mark depression symptoms, and that later timing (Robillard et al., 2015) and RAR irregularity (Gonzalez et al., 2014; Jones et al., 2005; Robillard et al., 2015; Robillard et al., 2016) mark bipolar disorder.
We have extended this literature by identifying how RARs tend to co-occur in subgroups, and how these sub-groups with similar RAR patterns relate to a lifetime history of symptoms across multiple dimensions. Cluster assignment explained a greater percentage of variance in lifetime depressive symptoms than continuous levels of any individual RAR variable. In contrast, continuous levels of individual RAR variables, especially relative amplitude (but also RAR alpha and acrophase) explained more variance in manic-hypomanic symptoms than the categorical cluster variable. This suggests that continuous levels of relative amplitude (reflecting rhythm strength) provide a stronger marker of lifetime manic-hypomanic symptoms when compared with belonging to a category that tends to have later and irregular RARs. Future research is needed to assess whether the identified RAR profiles and relative amplitude drive the course and/or reflects the consequences of the identified mental health dimensions.
Several limitations should be noted. The cross-sectional design of our study prohibits us from establishing temporality (e.g., whether these RAR profiles are causes or consequences of psychopathology); in addition, longitudinal studies are needed because retrospective reporting error may have rendered a biased or diminished signal. Due to the observational design and limited ability to consider potential confounders or mediators, we are also unable to clarify the biological or psychosocial meaning of the RAR profiles detected in this sample (e.g., whether the RAR profiles mark psychiatric symptoms as up-stream drivers or down-stream results of circadian/mood neurobiology). Additionally, the sub-groups that were detected in this sample, including their prevalence rates, may not necessarily generalize to those of the general population where a history of depression is not as common and other ethnic and cultural groups are represented. Our sample size in each cluster was relatively small, which may explain the failure of some potentially intriguing associations to meet achieve statistical significance (e.g., higher levels of substance and agoraphobia-panic symptoms in the “later/irregular” group); nevertheless, these signals and the individual correlations reported between the RAR and mental health variables can help guide research regarding these other symptom dimensions. Our sample had a wide range of ages, and this limited our ability to focus on a specific age group.
Nevertheless, we can contextualize the correlations between these RAR profiles and psychiatric co-morbidity within prior knowledge. Social rhythm disruption has been shown to precede mood disorder episodes (Alloy et al., 2015; Malkoff-Schwartz et al., 1998) and recurrence (Brown et al., 1996; Shen et al., 2008); RAR disturbances also temporally precede increases in depression symptoms (Smagula et al., 2015a; Smagula et al., 2015b). Thus, it is plausible that the RAR profiles detected in this sample have some role in determining mood disorder phenotypes, rather than simply reflecting down-stream behavioral manifestations. Given other research showing that RARs (Dowling et al., 2005; Van Someren, E.J. et al., 1997; Van Someren, E.J.W. et al., 1997) are modifiable, our findings provide information on the particular RAR characteristics that might be monitored or targeted in future interventions.
It remains to be seen how these objective RAR markers/profiles are related to the psychosocial and neurobiological mechanisms of mood disorders. We propose RARs may be both socially and biologically meaningful. The associations of later RAR timing with mood symptoms may be explained within the “internal coincidence” model (Wehr and Wirz-Justice, 1981) which postulates that misalignment between the sleep-wake cycle with optimal circadian timing accounts for mood disturbances. In addition, later RARs, a shortening of the active period, and irregular RARs may reflect reduced opportunities to engage in rewarding activities that facilitate psychological security and wellbeing (e.g., professional, social, or recreational activities).
Being in the “later/irregular” group, and having lower relative amplitude in particular, was associated with having greater levels of lifetime mania-hypomania symptoms. These findings have face validity, given that this clinical measure assesses psychomotor activation, euphoria, instability and irritability symptoms (Cassano et al., 2009). This irregular RAR profile and its psychological underpinnings are plausibly downstream of mania neurobiology (i.e., dysregulation of endocrine and cognitive control over reward seeking circuits (Maletic and Raison, 2014)). Untethered reward seeking could override the central pacemaker set by light, leading to unstable sleep-wake behaviors. It is also possible that irregular RAR patterns and psychosocial underpinnings shape mania neurobiology over time by disrupting optimal circadian and neuroendocrine behavioral control (i.e., irregular sleep-wake behaviors creating conditions where there is a lack of, or insensitivity to, circadian cues controlling mood and reward-seeking behavior).
On the other hand, the “later/narrower” group had more depression without increased manic-hypomanic symptoms. This profile plausibly reflects or affects the neurobiology of key depression features including social withdrawal and anhedonia i.e., impaired deliberative cognitive control (Joormann and Stanton, 2016), ruminative negative self-referential processes (Wisco, 2009), and interoceptive hijacking (Barrett et al., 2016). It is also important to consider, given that our sample was comprised of middle aged and older adults, that cerebrovascular or neurodegenerative processes could manifest as both narrow active periods and depression symptoms. A loss of structural integrity affecting the central circadian timekeeper in the hypothalamus might also lead to irregular RARs and their clinical correlates.
Future studies could determine which aspects or combinations of RARs confer the risks or consequences of these psychiatric features, and how these mechanisms work. Longitudinal studies would be needed to establish temporality in the relations between RAR profiles and symptom dimensions, as well as their psychosocial and neurobiological determinants. Intervention studies could evaluate whether recovery from a mood disorder can be facilitated by modifying RARs (e.g., improving regularity or active period length). Such research should measure the putative mediators linking together these behavioral (RAR) and psychological (mood symptoms) factors, including the overlapping neural circuits responsible for controlling reward processing, emotion, and social behaviors. This line of research could ultimately identify pathogenic targets that may be modified to prevent the occurrence and consequences of mood disorders. While future research is necessary towards this end, our findings add new evidence that RAR profiles signal important differences in mood phenotypes. Clinically monitoring or intervening on these RAR profiles could provide an ecologically valid, objective means for tracking key behavioral manifestations of mood pathology.
Supplementary Material
Acknowledgments
Funding Support: In completing this work, SFS has been supported by T32 HL082610 and K01 MH112683. The research study described herein was supported by the National Institutes of Health (R01 HL104607, PI, Hall; and R01 GM113243, PI, Krafty).
Footnotes
Publisher's Disclaimer: This is a PDF file of an unedited manuscript that has been accepted for publication. As a service to our customers we are providing this early version of the manuscript. The manuscript will undergo copyediting, typesetting, and review of the resulting proof before it is published in its final citable form. Please note that during the production process errors may be discovered which could affect the content, and all legal disclaimers that apply to the journal pertain.
References
- Alloy LB, Boland EM, Ng TH, Whitehouse WG, Abramson LY. Low social rhythm regularity predicts first onset of bipolar spectrum disorders among at-risk individuals with reward hypersensitivity. Journal of abnormal psychology. 2015;124(4):944–952. doi: 10.1037/abn0000107. [DOI] [PMC free article] [PubMed] [Google Scholar]
- Antypa N, Vogelzangs N, Meesters Y, Schoevers R, Penninx BW. CHRONOTYPE ASSOCIATIONS WITH DEPRESSION AND ANXIETY DISORDERS IN A LARGE COHORT STUDY. Depression and anxiety. 2016;33(1):75–83. doi: 10.1002/da.22422. [DOI] [PubMed] [Google Scholar]
- Barrett LF, Quigley KS, Hamilton P. An active inference theory of allostasis and interoception in depression. Philosophical transactions of the Royal Society of London. Series B, Biological sciences. 2016;371(1708) doi: 10.1098/rstb.2016.0011. [DOI] [PMC free article] [PubMed] [Google Scholar]
- Blume C, Santhi N, Schabus M. ‘nparACT’ package for R: A free software tool for the non-parametric analysis of actigraphy data. MethodsX. 2016;3:430–435. doi: 10.1016/j.mex.2016.05.006. [DOI] [PMC free article] [PubMed] [Google Scholar]
- Brown LF, Reynolds CF, 3rd, Monk TH, Prigerson HG, Dew MA, Houck PR, Mazumdar S, Buysse DJ, Hoch CC, Kupfer DJ. Social rhythm stability following late-life spousal bereavement: associations with depression and sleep impairment. Psychiatry research. 1996;62(2):161–169. doi: 10.1016/0165-1781(96)02914-9. [DOI] [PubMed] [Google Scholar]
- Carpenter JS, Robillard R, Hermens DF, Naismith SL, Gordon C, Scott EM, Hickie IB. Sleep-wake profiles and circadian rhythms of core temperature and melatonin in young people with affective disorders. Journal of psychiatric research. 2017;94:131–138. doi: 10.1016/j.jpsychires.2017.07.007. [DOI] [PubMed] [Google Scholar]
- Cassano GB, Mula M, Rucci P, Miniati M, Frank E, Kupfer DJ, Oppo A, Calugi S, Maggi L, Gibbons R, Fagiolini A. The structure of lifetime manic–hypomanic spectrum. Journal of Affective Disorders. 2009;112(1–3):59–70. doi: 10.1016/j.jad.2008.04.019. [DOI] [PMC free article] [PubMed] [Google Scholar]
- Dell’Osso L, Armani A, Rucci P, Frank E, Fagiolini A, Corretti G, Shear MK, Grochocinski VJ, Maser JD, Endicott J, Cassano GB. Measuring mood spectrum: comparison of interview (SCI-MOODS) and self-report (MOODS-SR) instruments. Comprehensive psychiatry. 2002;43(1):69–73. doi: 10.1053/comp.2002.29852. [DOI] [PubMed] [Google Scholar]
- Dowling GA, Hubbard EM, Mastick J, Luxenberg JS, Burr RL, Van Someren EJW. Effect of morning bright light treatment for rest–activity disruption in institutionalized patients with severe Alzheimer’s disease. International psychogeriatrics/IPA. 2005;17(2):221–236. doi: 10.1017/S1041610205001584. [DOI] [PMC free article] [PubMed] [Google Scholar]
- Ehlers CL, Frank E, Kupfer DJ. Social zeitgebers and biological rhythms. A unified approach to understanding the etiology of depression. Archives of general psychiatry. 1988;45(10):948–952. doi: 10.1001/archpsyc.1988.01800340076012. [DOI] [PubMed] [Google Scholar]
- First MB, Spitzer Robert L, Miriam Gibbon, Williams Janet BW. Biometrics Research. New York State Psychiatric Institute; New York: 2002. Structured Clinical Interview for DSM-IV-TR Axis I Disorders, Research Version, Patient Edition. (SCID-I/P) [Google Scholar]
- Frank E, Kupfer DJ, Thase ME, Mallinger AG, Swartz HA, Fagiolini AM, Grochocinski V, Houck P, Scott J, Thompson W, Monk T. Two-year outcomes for interpersonal and social rhythm therapy in individuals with bipolar I disorder. Archives of general psychiatry. 2005;62(9):996–1004. doi: 10.1001/archpsyc.62.9.996. [DOI] [PubMed] [Google Scholar]
- Gonzalez R, Tamminga CA, Tohen M, Suppes T. The relationship between affective state and the rhythmicity of activity in bipolar disorder. The Journal of clinical psychiatry. 2014;75(4):e317–322. doi: 10.4088/JCP.13m08506. [DOI] [PMC free article] [PubMed] [Google Scholar]
- Hamilton M. A rating scale for depression. Journal of Neurology, Neurosurgery and Psychiatry. 1960;23:56–62. doi: 10.1136/jnnp.23.1.56. [DOI] [PMC free article] [PubMed] [Google Scholar]
- Hasler BP, Allen JJ, Sbarra DA, Bootzin RR, Bernert RA. Morningness-eveningness and depression: preliminary evidence for the role of the behavioral activation system and positive affect. Psychiatry research. 2010;176(2–3):166–173. doi: 10.1016/j.psychres.2009.06.006. [DOI] [PMC free article] [PubMed] [Google Scholar]
- Hasler BP, Germain A, Nofzinger EA, Kupfer DJ, Krafty RT, Rothenberger SD, James JA, Bi W, Buysse DJ. Chronotype and diurnal patterns of positive affect and affective neural circuitry in primary insomnia. Journal of sleep research. 2012;21(5):515–526. doi: 10.1111/j.1365-2869.2012.01002.x. [DOI] [PMC free article] [PubMed] [Google Scholar]
- Haynes PL, Ancoli-Israel S, McQuaid J. Illuminating the impact of habitual behaviors in depression. Chronobiology international. 2005;22(2):279–297. doi: 10.1081/cbi-200053546. [DOI] [PubMed] [Google Scholar]
- Jones SH, Hare DJ, Evershed K. Actigraphic assessment of circadian activity and sleep patterns in bipolar disorder. Bipolar disorders. 2005;7(2):176–186. doi: 10.1111/j.1399-5618.2005.00187.x. [DOI] [PubMed] [Google Scholar]
- Joormann J, Stanton CH. Examining emotion regulation in depression: A review and future directions. Behaviour research and therapy. 2016;86:35–49. doi: 10.1016/j.brat.2016.07.007. [DOI] [PubMed] [Google Scholar]
- Luik AI, Zuurbier LA, Direk N, Hofman A, Van Someren EJ, Tiemeier H. 24-hour activity rhythm and sleep disturbances in depression and anxiety: a population-based study of middle-aged and older persons. Depression and anxiety. 2015 doi: 10.1002/da.22355. [DOI] [PubMed] [Google Scholar]
- Luik AI, Zuurbier LA, Hofman A, Van Someren EJ, Tiemeier H. Stability and fragmentation of the activity rhythm across the sleep-wake cycle: the importance of age, lifestyle, and mental health. Chronobiology international. 2013;30(10):1223–1230. doi: 10.3109/07420528.2013.813528. [DOI] [PubMed] [Google Scholar]
- Maglione JE, Ancoli-Israel S, Peters KW, Paudel ML, Yaffe K, Ensrud KE, Tranah GJ, Stone KL. Depressive Symptoms and Circadian Activity Rhythm Disturbances in Community-Dwelling Older Women. The American journal of geriatric psychiatry: official journal of the American Association for Geriatric Psychiatry. 2013 doi: 10.1016/j.jagp.2012.09.003. [DOI] [PMC free article] [PubMed] [Google Scholar]
- Maletic V, Raison C. Integrated Neurobiology of Bipolar Disorder. Frontiers in Psychiatry. 2014;5:98. doi: 10.3389/fpsyt.2014.00098. [DOI] [PMC free article] [PubMed] [Google Scholar]
- Malkoff-Schwartz S, Frank E, Anderson B, Sherrill JT, Siegel L, Patterson D, Kupfer DJ. Stressful life events and social rhythm disruption in the onset of manic and depressive bipolar episodes: a preliminary investigation. Archives of general psychiatry. 1998;55(8):702–707. doi: 10.1001/archpsyc.55.8.702. [DOI] [PubMed] [Google Scholar]
- Marler MR, Gehrman P, Martin JL, Ancoli-Israel S. The sigmoidally transformed cosine curve: a mathematical model for circadian rhythms with symmetric non-sinusoidal shapes. Stat Med. 2006;25(22):3893–3904. doi: 10.1002/sim.2466. [DOI] [PubMed] [Google Scholar]
- Meyer TJ, Miller ML, Metzger RL, Borkovec TD. Development and validation of the Penn State Worry Questionnaire. Behaviour research and therapy. 1990;28(6):487–495. doi: 10.1016/0005-7967(90)90135-6. [DOI] [PubMed] [Google Scholar]
- Miller MA, Rothenberger SD, Hasler BP, Donofry SD, Wong PM, Manuck SB, Kamarck TW, Roecklein KA. Chronotype predicts positive affect rhythms measured by ecological momentary assessment. Chronobiology international. 2015;32(3):376–384. doi: 10.3109/07420528.2014.983602. [DOI] [PMC free article] [PubMed] [Google Scholar]
- Morita Y, Sasai-Sakuma T, Asaoka S, Inoue Y. The impact of a delayed sleep-wake schedule on depression is greater in women--A web-based cross-sectional study in Japanese young adults. Chronobiology international. 2015;32(7):952–958. doi: 10.3109/07420528.2015.1055756. [DOI] [PubMed] [Google Scholar]
- R Development Core Team; Computing, R.F.f.S, editor. R: A language and environment for statistical computing. Vienna, Austria: 2013. [Google Scholar]
- Robillard R, Hermens DF, Naismith SL, White D, Rogers NL, Ip TK, Mullin SJ, Alvares GA, Guastella AJ, Smith KL, Rong Y, Whitwell B, Southan J, Glozier N, Scott EM, Hickie IB. Ambulatory sleep-wake patterns and variability in young people with emerging mental disorders. Journal of psychiatry & neuroscience: JPN. 2015;40(1):28–37. doi: 10.1503/jpn.130247. [DOI] [PMC free article] [PubMed] [Google Scholar]
- Robillard R, Oxley C, Hermens DF, White D, Wallis R, Naismith SL, Whitwell B, Southan J, Scott EM, Hickie IB. The relative contributions of psychiatric symptoms and psychotropic medications on the sleep-wake profile of young persons with anxiety, depression and bipolar disorders. Psychiatry research. 2016;243:403–406. doi: 10.1016/j.psychres.2016.06.025. [DOI] [PubMed] [Google Scholar]
- Sbrana A, Dell’Osso L, Gonnelli C, Impagnatiello P, Doria MR, Spagnolli S, Ravani L, Cassano GB, Frank E, Shear MK, Grochocinski VJ, Rucci P, Maser JD, Endicott J. Acceptability, validity and reliability of the Structured Clinical Interview for the Spectrum of Substance Use (SCI-SUBS): a pilot study. International journal of methods in psychiatric research. 2003;12(2):105–115. doi: 10.1002/mpr.147. [DOI] [PMC free article] [PubMed] [Google Scholar]
- Scrucca L, Fop M, Murphy TB, Raftery AE. mclust 5: Clustering, Classification and Density Estimation Using Gaussian Finite Mixture Models. The R journal. 2016;8(1):289–317. [PMC free article] [PubMed] [Google Scholar]
- Shear MK, Rucci P, Williams J, Frank E, Grochocinski V, Vander Bilt J, Houck P, Wang T. Reliability and validity of the Panic Disorder Severity Scale: replication and extension. Journal of psychiatric research. 2001;35(5):293–296. doi: 10.1016/s0022-3956(01)00028-0. [DOI] [PubMed] [Google Scholar]
- Shen GH, Alloy LB, Abramson LY, Sylvia LG. Social rhythm regularity and the onset of affective episodes in bipolar spectrum individuals. Bipolar disorders. 2008;10(4):520–529. doi: 10.1111/j.1399-5618.2008.00583.x. [DOI] [PMC free article] [PubMed] [Google Scholar]
- Smagula SF. Opportunities for clinical applications of rest-activity rhythms in detecting and preventing mood disorders. Curr Opin Psychiatry. 2016;29(6):389–396. doi: 10.1097/YCO.0000000000000283. [DOI] [PMC free article] [PubMed] [Google Scholar]
- Smagula SF, Ancoli-Israel S, Blackwell T, Boudreau R, Stefanick ML, Paudel ML, Stone KL, Cauley JA. Circadian rest-activity rhythms predict future increases in depressive symptoms among community-dwelling older men. The American journal of geriatric psychiatry: official journal of the American Association for Geriatric Psychiatry. 2015a;23(5):495–505. doi: 10.1016/j.jagp.2014.06.007. [DOI] [PMC free article] [PubMed] [Google Scholar]
- Smagula SF, Boudreau RM, Stone K, Reynolds CF, 3rd, Bromberger JT, Ancoli-Israel S, Dam TT, Barrett-Connor E, Cauley JA. Latent activity rhythm disturbance subgroups and longitudinal change in depression symptoms among older men. Chronobiology international. 2015b:1–11. doi: 10.3109/07420528.2015.1102925. [DOI] [PMC free article] [PubMed] [Google Scholar]
- Smagula SF, Krafty RT, Taylor BJ, Martire LM, Schulz R, Hall MH. Rest-activity rhythm and sleep characteristics associated with depression symptom severity in strained dementia caregivers. Journal of sleep research. 2017 doi: 10.1111/jsr.12549. [DOI] [PMC free article] [PubMed] [Google Scholar]
- Sylvia LG, Alloy LB, Hafner JA, Gauger MC, Verdon K, Abramson LY. Life events and social rhythms in bipolar spectrum disorders: a prospective study. Behavior therapy. 2009;40(2):131–141. doi: 10.1016/j.beth.2008.04.003. [DOI] [PMC free article] [PubMed] [Google Scholar]
- Van Someren EJ, Lijzenga C, Mirmiran M, Swaab DF. Long-term fitness training improves the circadian rest-activity rhythm in healthy elderly males. Journal of biological rhythms. 1997;12(2):146–156. doi: 10.1177/074873049701200206. [DOI] [PubMed] [Google Scholar]
- Van Someren EJW, Kessler A, Mirmiran M, Swaab DF. Indirect bright light improves circadian rest-activity rhythm disturbances in demented patients. Biological psychiatry. 1997;41(9):955–963. doi: 10.1016/S0006-3223(97)89928-3. [DOI] [PubMed] [Google Scholar]
- Watson D, Clark LA, Tellegen A. Development and validation of brief measures of positive and negative affect: the PANAS scales. Journal of personality and social psychology. 1988;54(6):1063–1070. doi: 10.1037//0022-3514.54.6.1063. [DOI] [PubMed] [Google Scholar]
- Wehr T, Wirz-Justice A. In: Internal coincidence model for sleep deprivation and depression. WPK, editor. Sleep; Karger, Switzerland: 1981. pp. 26–33. [Google Scholar]
- Wisco BE. Depressive cognition: self-reference and depth of processing. Clinical psychology review. 2009;29(4):382–392. doi: 10.1016/j.cpr.2009.03.003. [DOI] [PubMed] [Google Scholar]
- Witting W, Kwa IH, Eikelenboom P, Mirmiran M, Swaab DF. Alterations in the circadian rest-activity rhythm in aging and Alzheimer’s disease. Biological psychiatry. 1990;27(6):563–572. doi: 10.1016/0006-3223(90)90523-5. [DOI] [PubMed] [Google Scholar]
Associated Data
This section collects any data citations, data availability statements, or supplementary materials included in this article.