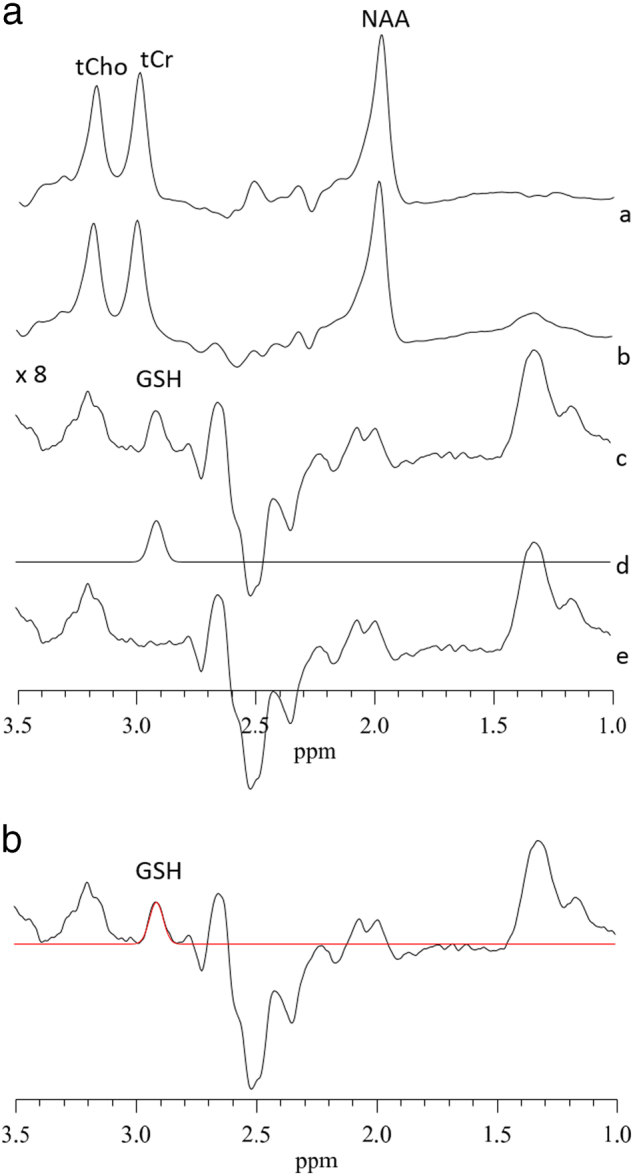
Fig. 2.

(A): Typical fitting results from a patient, a MRS sub-spectra acquired for the “on” condition (see text), b “off” condition, c subtracted to obtain clean GSH resonance at 2.9 p.p.m., d frequency domain model-fitting of edited GSH resonance only, and e residual of the difference between c and d. (B): A representative single-subject-GSH-edited spectrum clearly showing the 2.95 p.p.m. GSH resonance
