

Abstract
We investigated intracellular trafficking of GM1 ganglioside in Niemann–Pick C1 (NPC1)-deficient Chinese hamster ovary cells [NPC1(−) cells] by using cholera toxin (CT) as a probe. Both the holotoxin and the B subunit (CTB) accumulated in GM1-enriched intracellular vesicles of NPC1(−) cells. CTB-labeled vesicles contained the early endosome marker Rab5 but not lysosome-associated membrane protein 2 and were not labeled with either Texas red–transferrin or Lysotracker, indicating that they represent early endosomes. Similarly, CT accumulated in intracellular vesicles of human NPC fibroblasts that contained both Rab5 and early endosomal antigen 1. CTB accumulation in NPC1(−) cells was abolished by expression of wild-type NPC1 but not by mutant proteins with a mutation either in the NPC domain or the sterol-sensing domain. A part of these mutant NPC1 proteins expressed in NPC1(−) cells was localized on CTB-labeled vesicles. U18666A treatment of “knock in” cells [NPC1(−) cells that stably expressed wild-type NPC1] caused CTB accumulation similar to that in NPC1(−) cells, and a part of wild-type NPC1was localized on CTB-labeled vesicles in drug-treated cells. Finally, CT tracer experiments in NPC1(−) cells revealed retarded excretion of internalized toxin into the culture medium and an increase in the intracellular release of A subunits. In accordance with the latter result, CT was more effective in stimulating cAMP formation in NPC1(−) than in wild-type cells. These results suggest that transport of CT/GM1 complexes from the early endosome to the plasma membrane depends on the function of NPC1, whereas transport to the Golgi apparatus/endoplasmic reticulum does not.
Niemann–Pick disease type C (NPC) is an autosomal recessive lipid storage disorder. The primary disease-causing gene, Niemann–Pick C1 (NPC1), is a 13-transmembrane-domain protein that contains a putative sterol-sensing domain and a carboxyl-terminal dileucine motif (1–4). NPC1 resides in intracellular vesicles that contain late endosome markers Rab7 and Rab9 and also a late endosome/lysosome marker lysosome-associated membrane protein 2 (LAMP2). It has also been demonstrated that NPC1 is recruited to the site of free cholesterol accumulation either by enrichment of cellular cholesterol or by pharmacological intervention of cholesterol egress from the lysosome (5–7). These results provided our current concept of NPC1 as a primarily late endosome-resident protein that transiently associates with the lysosome (6, 8). Recently, NPC1 was shown to be the first known mammalian member of a resistance-nodulation-division family of permeases and was capable of transporting fatty acids across a membrane (9).
The most prominent phenotype of NPC cells is lysosomal accumulation of free cholesterol, which is caused by impaired relocation of low-density lipoprotein-derived cholesterol from the lysosome to other cellular sites, such as the plasma membrane (PM) and endoplasmic reticulum (ER). NPC cells are also characterized by accumulation of other metabolites such as phospholipids, glycosphingolipids, sphingoid bases, cysteine, and glycoproteins. In the brain, where a lack of NPC1 leads to a progressive and ultimately fatal neurodegradation, massive accumulation of glycolipids occurs, with little excessive cholesterol storage. In addition, extensive glycolipid storage occurs in the NPC fetal liver, suggesting that this is an early event in the development of the disorder (10). These glycolipid storage anomalies raise the possibility that NPC cells have a more generalized abnormality in cellular lipid trafficking. In pursuit of this possibility, we and others have focused on investigating the etiology of ganglioside storage in NPC1-deficient cells (7, 11, 12). Of the various ganglioside species, GM1 has attracted little attention, because in total lipid extracts from the NPC brain there was only a marginal increase of GM1, as compared with conspicuous increases of GM2 and GM3 (10, 13). However, anti-GM1 immunohistochemistry has revealed localized increases of GM1 in various regions of the NPC mouse brain (unpublished observations), suggesting that GM1 transport is indeed altered in NPC cells.
The purpose of the current study was to characterize the intracellular distribution and transport of GM1 in NPC cells, by using cholera toxin (CT) as a probe. CT is composed of two subunits, A and B. The B subunit is a homopentamer of an 11.5-kDa polypeptide. This subunit binds stoichiometrically to five GM1 molecules on the PM with high affinity and specificity. The A subunit is a single 28-kDa polypeptide that exhibits an ADP–ribosyltransferase activity and activates the stimulatory GTP-binding protein, Gs (reviewed in ref. 14).
Materials and Methods
Materials.
CT (holotoxin from Vibrio choleae), CTB, FITC-CTB, nystatin, and brefeldin A were from Sigma; U18666A was from Biomol (Plymouth Meeting, PA); Cy5 reactive dye-pack, 125I-containing Bolton–Hunter reagent, Sephadex G25, and the cAMP EIA kit were from Amersham Pharmacia; Alexa-conjugated secondary antibodies, Lysotracker red, and Texas red–transferrin were from Molecular Probes; tetramethylrhodamine isothiocyanate (TRITC) anti-mouse IgM was from Nordic (Lausanne, Switzerland). We used a rabbit polyclonal antibody against Rab5 (StressGen Biotechnologies, Victoria, Canada), and mouse monoclonal antibodies against GM1 (Seikagaku, Tokyo), Rab5 (Transduction Laboratories, Lexington, KY), lysosome-associated membrane protein 2 (LAMP2; a kind gift from P. G. Pentchev, National Institute of Neurological Disorders and Stroke, National Institutes of Health), early endosomal antigen 1 (Transduction Laboratories) and Flag epitope (Sigma).
Cell Culture.
Chinese hamster ovary (CHO) cells were maintained in Ham F12/10% bovine calf serum. CHO-JP17 is a cell line that expresses a retrovirus receptor and was used as a wild-type (wt) cell line. The NPC1 locus in CHO-JP17 was disrupted by retrovirus-mediated gene trap mutagenesis to give a cell line NPC1(−) that does not express NPC1 (15). Human skin fibroblasts were grown as described (16).
Labeling of CT.
CT was labeled with Cy5 by using Cy5 reactive dye-pack. Briefly, CT in 0.1 M sodium carbonate buffer (pH 9.3) was incubated with the dye for 0.5 h at room temperature, and Cy5-CT was separated from free dye by Sephadex G25 gel filtration. The toxin was iodinated by using 125I-containing Bolton–Hunter reagent. Briefly, CT in 0.1 M sodium carbonate buffer was incubated with dried reagent at room temperature overnight. The reaction was quenched with glycine and iodinated protein was separated from unincorporated reagent by Sephadex G25 gel filtration. The specific activity of 125I-CT was ≈5 × 10⁶ cpm/nmol.
CT Uptake and Immunofluorescence.
Cells were washed with PBS and incubated at 37°C for 2 h in reaction medium (F12/25 mM Hepes, pH 7.4/0.01% BSA) containing Cy5-CT or FITC-CTB (both at 10 nM). They were fixed in PBS/4% paraformaldehyde and counterstained with propidium iodide. Where indicated, cells were fixed without CT labeling. For double-staining experiments, fixed cells were processed for immunofluorescence. Briefly, cells were incubated in 100% methanol followed by Block Ace (Dainippon, Osaka) and then with antibodies against GM1 (1:100), Rab5 (monoclonal, 1:500; polyclonal, 1:1,000), early endosomal antigen 1 (1:500), or LAMP2 (1:500) at 4°C overnight. Mouse monoclonal anti-Rab5 was used for double labeling with FITC-CTB, and rabbit polyclonal anti-Rab5 was used for double labeling with other mouse monoclonal antibodies. Bound antibody was detected with Alexa488 or 546-conjugated anti-mouse/rabbit IgG or TRITC anti-mouse IgM (for anti-GM1). Fluorescent images were obtained with a MRC1024 confocal microscope (Bio-Rad). For labeling with Texas red–transferrin or Lysotracker red, cells were incubated in the same reaction medium containing FITC-CTB together with Texas red–transferrin (25 μg/ml) or Lysotracker red (5 μg/ml) for 1 h, fixed, and processed for confocal imaging.
Thin-Layer Chromatography (TLC).
TLC analysis of cholesterol and gangliosides was performed as described (17) with some modifications. Briefly, cells were disrupted by suspension in H2O, and total lipids were extracted with chloroform–methanol (1/2, vol/vol). The extracts were desalted and fractionated into a neutral lipid fraction and an acidic lipid fraction by C18 reverse-phase chromatography. TLC was performed by using HPTLC plates (Merck) developed in hexane–diethyl ether–acetic acid (90/10/1, vol/vol/vol) for neutral lipids and chloroform–methanol–0.2% CaCl2 (60/35/8, vol/vol/vol) for acidic lipids. Lipids were visualized by CuSO4 (neutral lipids) or resorcinol–hydrochloric acid (acidic lipids) sprays and heating.
NPC1 Mutagenesis and Expression.
A Flag-NPC1 expression plasmid (pAsC9/Flag-NPC1) in which a Flag epitope was inserted into the ClaI site of human NPC1 cDNA has been described (6). By using this as a template, we prepared two kinds of loss-of-function mutants of NPC1: NPC1(del 48–165) that lacked the entire NPC domain (1) and NPC1(D786N) in which the conserved Asp residue in the sterol-sensing domain was substituted with an Asn residue (18). Both the deletion and the point mutation were introduced by PCR-based mutagenesis and confirmed by direct sequencing. For transient expression, cells were transfected by using Lipofectamine (Life Technologies). Expression of wt and mutant NPC1 was confirmed by anti-Flag Western blotting of lysates from transfected NPC1(−) cells (data not shown). To generate a cell line that stably expressed Flag-NPC1, NPC1(−) cells were transfected with pAsC9/Flag-NPC1 and pSVbsrr, and the cells were selected for resistance against blasticidin and recovered by colony lifting.
125I-CT Tracer Experiments.
Intracellular transport of 125I-CT was assayed as described (19, 20), with some modifications. Cells were incubated at 4°C for 1 h in the reaction medium (F12/25 mM Hepes, pH 7.4/0.01% BSA) containing 10 nM 125I-CT, and after washing they were further incubated in reaction medium at 37°C. At the times indicated, medium was recovered, and proteins were precipitated with 10% (wt/vol) trichloroacetic acid (TCA). TCA-soluble and -insoluble fractions were counted for radioactivity. Cell-associated radioactivity was recovered in 0.1 M NaOH and counted. Radioactive proteins in the medium were analyzed by SDS/PAGE. The medium was concentrated by using centricon 10 (Amicon) and mixed with nonreducing sample buffer (2% SDS/60 mM Tris⋅HCl, pH 6.8/20% glycerol/0.001% bromophenol blue), and proteins were separated on 15–25% gradient gel. Gels were processed for autoradiography and developed with BAS2000 (Fujitsu, Tokyo). Radioactive proteins in the cell-associated fractions were analyzed by gel filtration chromatography as described (19). Briefly, cells were recovered in ice-cold PBS/10 mM N-ethylmaleimide. They were lysed in buffer [10 mM Tris⋅HCl, pH 7.4/0.25 mM MgCl2/0.1% DNase/2 mM 4-(2-aminoethyl)benzenesulfonyl fluoride], and cell lysates were loaded on a Sephadex G25 column and eluted with PBS.
cAMP Formation.
Cells in 96-well plates were incubated at 37°C for 10 min in the reaction medium supplemented with 1 mM 3-isobutyl-1-methylxanthine and stimulated with CT or forskolin. Reactions were stopped by the addition of 10% TCA and the cAMP content in TCA-soluble extracts was measured by using an EIA kit.
Results
Accumulation of CT and GM1 in NPC Early Endosomes.
By using fluorescence-labeled CT, we examined the intracellular distribution of GM1 in NPC1(−) cells. When wt cells were incubated with Cy5-CT at 37°C for 2 h, internalized toxin was dispersed in the cytoplasm. The distribution was quite different in NPC1(−) cells, in which Cy5-CT accumulated in multiple large vesicles. Similar patterns were observed by using the B subunit of the toxin (FITC-CTB), which was also concentrated in multiple large vesicles, primarily at the cell periphery (Fig. 1). Time course analyses showed that at least 15-min incubation with Cy5-CT was required to observe the intracellular accumulation in NPC(−) cells (data not shown). As expected, on the basis of the binding activity of CTB to GM1 (14), anti-GM1 staining showed almost complete colocalization of GM1 and FITC-CTB (Fig. 2a).
Figure 1.
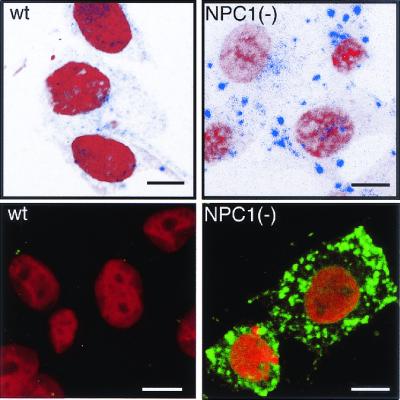
Intracellular distribution of CT in NPC1(−) cells. Cells were incubated with Cy5-CT (Upper) or FITC-CTB (Lower), fixed, and counterstained with propidium iodide. (Bar = 10 μm.)
Figure 2.
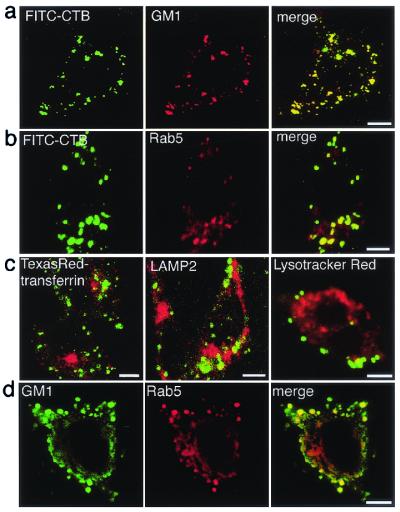
Intracellular localization of CT/GM1 in NPC1(−) cells. (a–c) Live cells were labeled with FITC-CTB, fixed, and then stained with the indicated antibodies, or they were simultaneously labeled with FITC-CTB and Texas red–transferrin or Lysotracker red. Only the merged images are shown in c. (d) Cells were fixed without CT-labeling and double stained with the indicated antibodies. (Bar = 10 μm.)
To reveal the identity of CTB-labeled vesicles, we used antibodies against the early endosome marker Rab5 and the late endosome/lysosome marker LAMP2. In addition, we used Texas red–transferrin and Lysotracker red to label recycling endosomes and lysosomes, respectively (21, 22). The CTB-labeled vesicles were positive for Rab5 (Fig. 2b) but contained no Texas red–transferrin, LAMP2, or Lysotracker red (Fig. 2c). Filipin-positive vesicles in NPC1(−) cells were clustered perinuclearly (15) and labeled by both Lysotracker and LAMP2 (data not shown). These results indicate that CT/GM1 and free cholesterol accumulate in completely different vesicular compartments of NPC1(−) cells, early endosomes, and lysosomes, respectively.
Because CTB causes clustering of GM1 molecules (14), it was possible that CT-labeling altered the intracellular distribution of GM1. However, GM1 accumulation in Ra5-positive vesicles was evident when cells were fixed without prior CT labeling (Fig. 2d), indicating that the accumulation was not secondary to CT-induced clustering of GM1.
To examine whether this phenotype is a common feature of NPC cells, we repeated the labeling experiments by using cultured skin fibroblasts from an NPC patient, UCH, which do not express any NPC1 protein (16). Cy5-CT was localized in multiple vesicles of UCH cells that were negative for Lysotracker red. Although some intracellular vesicles were also labeled in control cells, it was obvious that Cy5-CT-labeled vesicles were larger in size and higher in number in UCH than in control cells (Fig. 3a). Cy5-CT-labeled vesicles in UCH cells contained Rab5 as well as a second marker of early endosomes, early endosomal antigen 1 (ref. 23; Fig. 3b).
Figure 3.

Intracellular localization of CT in human fibroblasts. (a) Cells from a control subject and an NPC patient, UCH, were simultaneously labeled with Cy5-CT and Lysotracker red. (b) UCH cells were labeled with Cy5-CT, fixed, and double stained with indicated antibodies. Merged images are shown (Lower). (Bar = 10 μm.)
Localization of NPC1 on CTB-Labeled Vesicles.
NPC1 resides primarily in the late endosome and is recruited to the site of free cholesterol accumulation (5, 6). To see whether NPC1 is also recruited to the site of GM1 accumulation, we examined the following: (i) whether nonfunctional NPC1 proteins are localized on CTB-labeled vesicles in NPC1(−) cells; (ii) whether GM1 accumulation is caused by U18666A, a sterol derivative that induces NPC phenotypes by inhibiting the function of NPC1 or a closely related protein (5, 6); and (iii) if U18666A has this effect, whether NPC1 is localized to CTB-labeled vesicles in drug-treated cells.
Two kinds of mutant NPC1 constructs were engineered by either deleting the NPC domain or introducing a D786N substitution in the sterol-sensing domain of Flag-tagged NPC1. Filipin/anti-Flag double labeling of transfected NPC1(−) cells showed that both mutants failed to correct free cholesterol accumulation (data not shown). FITC-CTB/anti-Flag double labeling showed that, in contrast to wt NPC1 that abolished CTB accumulation (data not shown), both mutants failed to correct CTB accumulation, and that a part of expressed mutant NPC1 proteins was colocalized with CTB (Fig. 4).
Figure 4.

Expression of mutant NPC1 proteins in NPC1(−) cells. Cells were transfected with expression plasmids carrying each NPC1 construct, labeled with FITC-CTB, fixed, and stained with anti-Flag. (Bar = 10 μm.)
TLC analysis of a neutral lipid fraction of cellular lipid extracts showed that NPC1(−) cells contained a higher level of free cholesterol than in wt cells. The same analysis of an acidic lipid fraction showed that NPC1(−) cells contained a clearly detectable level of GM1, whereas wt cells contained an undetectable level of this lipid. U18666A treatment caused obvious increases in the levels of both lipids in wt cells but failed to affect the levels of either lipids in NPC1(−) cells (Fig. 5a).
Figure 5.

Effects of U18666A on cellular levels of free cholesterol/GM1 and localization of NPC1. Cells were cultured with (+) or without (−) 2 μg/ml U18666A for 12 h. (a) TLC analysis of neutral (Upper) and acidic (Lower) fractions of cellular lipid extracts. Positions of standard lipids are indicated (Left). (b) Effects on the levels of Flag-NPC1. Lysates from “knock in” cells were analyzed by anti-Flag Western blotting. (c) Effects on the localization of Flag-NPC1. “Knock in” cells were labeled with FITC-CTB, fixed, and stained with anti-Flag. (Bar = 10 μm.) (d) Merged images of U18666A-treated “knock in” cells obtained at higher magnifications. (Bar = 5 μm.)
To investigate the effect of U18666A on NPC1 levels and localization, we stably expressed Flag-tagged NPC1 in NPC1(−) cells. When these “knock in” cells were treated with U18666A, the amount of Flag-NPC1 protein in cell lysates was increased (Fig. 5b). FITC-CTB/anti-Flag double-labeling experiments showed clear accumulation of CTB after U18666A treatment and an increased number of Flag-NPC1-positive vesicles, whereas untreated cells showed no CTB accumulation and a dispersed cytoplasmic distribution of Flag-NPC1-positive vesicles (Fig. 5c). In agreement with previous findings (6), the major portion of Flag-NPC1 in U18666A-treated cells was localized in perinuclear vesicles, presumably lysosomes, with a few of these vesicles containing CTB. A minor portion of Flag-NPC1 was localized in vesicles at the cell periphery, and observations at higher magnifications revealed that many of the peripheral Flag-NPC1-positive vesicles contained CTB (Fig. 5d).
Retardation of CT Transport from the Early Endosome to the PM in NPC1(−) Cells.
Cell-surface-bound CT is first transported to the early endosome from which the toxin enters one of at least two distinct pathways (see Fig. 8). First, the toxin is recycled back to the PM where it is excreted in its intact form. Of note, the intact form of CT in the medium can be separated from degradation products by TCA precipitation (19). Second, the toxin can enter a retrograde transport pathway that leads to the Golgi apparatus and eventually to the ER. Although precise molecular events remain unknown, it is clear that the toxin must reach the ER to yield its enzymatically active A subunits (14).
Figure 8.
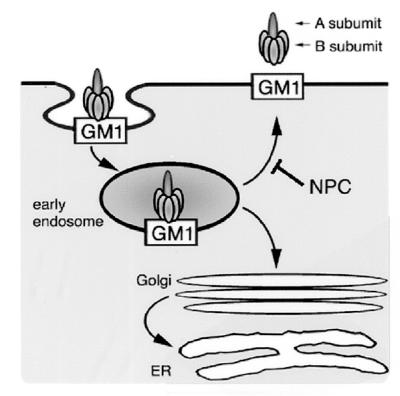
Intracellular trafficking of CT/GM1. From the early endosome, CT/GM1 complexes take at least two pathways. First is the pathway back to the PM. Second is the pathway via the Golgi apparatus to the ER. Our findings suggest that transport back to the PM depends on the function of NPC1, whereas transport to the Golgi apparatus/ER does not. See text for details.
To determine the transport pathway that is altered in NPC cells, we characterized intracellular transport of 125I-CT. In experiments shown in Fig. 6, cells were first incubated with 125I-CT at 4°C for 1 h to let the toxin bind to cell-surface GM1, washed, and then at 37°C to allow internalization of the bound toxin. There was no difference in cell-surface-binding capacities for 125I-CT between wt and NPC1(−) cells as determined by cell-associated radioactivity at the end of 4°C incubation (time 0 point in Fig. 6a). Subsequent incubation at 37°C caused a time-dependent decrease of cell-associated radioactivity in both cell lines, and the rate of the decrease was significantly lower in NPC1(−) than in wt cells. This retardation in the clearance of cell-associated radioactivity was accompanied by decreased radioactivity recovered in TCA-insoluble fractions from the medium. No significant differences in the TCA-soluble fractions were seen between the two cell lines (Fig. 6a). SDS/PAGE analyses revealed the release of intact 125I-CT into the medium (Fig. 6b).
Figure 6.

Intracellular trafficking of 125I-CT. In all experiments, cells were incubated with 10 nM 125I-CT at 4°C for 1 h, washed, and further incubated in fresh medium at 37°C for the time indicated. Cells were on six-well plates in a–c, 60-mm dishes in d, and 100-mm dishes in e. (a) Time-dependent compartmentalization of radioactivity. Each fraction were recovered as described in Materials and Methods and counted for radioactivity. (b) SDS/PAGE analysis of radioactivity released into the medium. H, A, and B indicate the positions of the holotoxin, A and B monomers. Lane 1, 125I-CT applied; lane 2, 125I-CT after boiling in reducing SDS sample buffer containing 1 mM β-mercaptoethanol. (c) Effects of nystatin and brefeldin A on the radioactivity recovered in TCA-insoluble fractions of the medium. Cells were incubated at 37°C for 2 h. In both the 4°C and 37°C incubations, the medium contained nystatin (25 μg/ml) or brefeldin A (1 μg/ml). Neither drug caused a significant change in the cell-associated radioactivity at the end of the 4°C incubation (data not shown). (d) Gel filtration chromatography of cell-associated radioactivity. The positions of the holotoxin and A and B subunits were determined from elution profiles of 125I-CT before and after boiling in reducing SDS sample buffer (not shown). Profiles of fractions 22–30 depicted in an enlarged scale (Insets) show the amounts of A subunits. (e) Effects of brefeldin A on the release of A subunits. Cells were incubated at 37°C for 4 h with or without brefeldin A treatment as in c, and the intracellular amounts of A subunits were determined by gel filtration chromatography. All in a, c, and e, each point or bar represents the mean ± SEM (n = 3). *, P < 0.05, significantly different from the values of wt cells.
To confirm that 125I-CT was once internalized and then released to the medium, we examined whether the release was (i) temperature-dependent and (ii) blocked by nystatin that inhibits caveolae-mediated internalization (24). We found that the 125I-CT release did not happen at 4°C (data not shown) and was inhibited by nystatin both in wt and NPC1(−) cells (Fig. 6c). In addition, we tested the ability of brefeldin A that disrupts Golgi-mediated CT transport (14) to block the 125I-CT release. Brefeldin A had only a marginal effect on the 125I-CT release in either cell line (Fig. 6c) at a concentration high enough to suppress intracellular release of A subunits (Fig. 6e). These results suggested that internalized CT was transported to the PM at a slower rate in NPC1(−) than in wt cells and that the transport pathway was independent of the Golgi apparatus.
To examine whether the retrograde transport pathway that leads to the Golgi apparatus/ER is also altered, we analyzed cell-associated fractions by gel filtration chromatography (19). As expected, there were no free A subunits in both wt and NPC1(−) cells at the end of the 4°C incubation. In the subsequent incubation at 37°C, small amounts of free A subunits were released in a time-dependent manner, and the amounts of A subunits released in NPC1(−) cells were always higher than in wt cells (Fig. 6d). The difference between the two cell lines was statistically significant (Fig. 6e). Because dissociation of the A subunit from the holotoxin takes place in the ER (14), these results suggested that a higher amount of CT was transported to the ER in NPC1(−) cells. In accordance with the notion that CT is transported to the ER via the Golgi apparatus (14), the release of A subunits was completely suppressed by brefeldin A in both cell lines (Fig. 6e).
To confirm that the retrograde transport of CT to the ER is increased in NPC1(−) cells, we compared the ability of CT to stimulate cAMP formation in the two cell lines. In accordance with the increased release of A subunits, CT was more effective in stimulating cAMP formation in NPC1(−) than in wt cells (Fig. 7). The difference in the CT stimulatory effect was not because of an alteration in the signaling cascade downstream to Gs, because there was no difference between the two cell lines in the effects of forskolin, which directly activates adenylate cyclase (data not shown).
Figure 7.

Effects of CT on cAMP formation. The concentration of CT was 10 nM in time course experiments (Left), and the reaction time was 2 h in dose-response experiments (Right). Each point represents the mean ± SEM (n = 3). *, P < 0.05, significantly different from the values of wt cells.
Discussion
In the current report, we described a novel cellular phenotype of NPC1-deficient CHO cells, accumulation of CT/GM1 in the early endosome (Figs. 1 and 2). This phenotype appeared to be shared by another NPC1-deficient cell type, human NPC fibroblasts (Fig. 3). According to the current hypothesis on the topology of PM-derived glycosphingolipids in the endocytic pathway, the lipid molecules do not retain on the endosomal membrane but become incorporated into the membranes of intraendosomal vesicles (multivesicular bodies) (25). Our observation that both CT and GM1 were luminal rather than membranous suggests that both molecules were located in multivesicular storage bodies, accumulation of which is a key pathological feature of human NPC cells as well as our NPC1(−) cells (15).
Gangliosides such as GM1 primarily reside on the PM and, as part of continuous endocytic membrane flow, they are internalized and subjected to a sorting process that directs some of the molecules back to the PM, some others to the Golgi apparatus, and others to the late endosome/lysosome. The early endosome in this flow system acts as a branch point, feeding to different pathways (25). Cell-surface-binding capacities for CT were not different between wt and NPC1(−) cells, and it was unlikely that CT/GM1 influx into the early endosome was increased in NPC cells. Results of 125I-CT tracer experiments (Fig. 6) showed that in NPC1(−) cells, transport of CT back to the PM was obviously retarded, whereas retrograde transport to the Golgi apparatus/ER was enhanced. Although the precise reason for the increased retrograde transport is unknown, it is likely to be secondary to holotoxin accumulation in the early endosome, which would allow more toxin to enter this pathway. Therefore, our findings suggest that in the absence of NPC1, normal influx into and slower efflux from the early endosome cause CT/GM1 to reach a high steady-state level in this compartment (Fig. 8). This notion is consistent with the compartment model proposed by Neufeld et al. (5); according to this model, normal influx and slower efflux cause accumulation of multiple metabolites in the endocytic compartments of NPC cells. It should be noted that, whereas it is well documented that CT can be transported to the PM or to the Golgi apparatus, there is little evidence that the toxin enters the late endosome/lysosome (14). Therefore, by using CT as a probe, GM1 transport from the early endosome to the later endocytic compartments was not assessed in the current study, and it remains to be determined whether this transport pathway depends on NPC1 function.
The most prominent phenotype of NPC cells is lysosomal accumulation of free cholesterol, and it is still an open question whether the early endosomal GM1 accumulation is secondary to abnormal cholesterol trafficking or not. At one extreme, it is possible that transport of free cholesterol and of GM1 operate independently from each other, and this phenotype is a direct consequence of the absence of NPC1, which is involved in lipid export from the early endosome. This hypothesis is supported by our finding that a part of expressed NPC1 was localized on CTB-labeled vesicles. This localization was evident, however, only when NPC1 function was disrupted either by a genetic (Fig. 4) or pharmacological (Fig. 5) method, and there is no evidence for the presence of NPC1 in the early endosome at the steady state. Therefore, if NPC1 is directly involved in GM1 export, this protein may transiently associate with GM1-loaded early endosomes, as it does with cholesterol-loaded lysosomes. Alternatively, it is also possible that the early endosomal GM1 accumulation is secondary to abnormal cholesterol trafficking in NPC cells. This hypothesis is supported by several lines of evidence that both intracellular levels and distribution of gangliosides could be modulated by cellular low-density lipoprotein uptake in NPC1-deficient CHO cells (7) as well as in normal human fibroblasts (26). It is the subject for future studies to test these hypotheses.
Acknowledgments
This work was supported in part by a Grant-in-Aid for Scientific Research on Priority Areas from the Ministry of Education, Culture, Sports, Science, and Technology and by a grant (H12-brain-018) from the Ministry of Health, Labour, and Welfare of Japan.
Abbreviations
- CT
cholera toxin
- CTB
CT B subunit
- ER
endoplasmic reticulum
- LAMP2
lysosome-associated membrane protein 2
- NPC
Niemann–Pick disease type C
- NPC1
Niemann–Pick C1
- PM
plasma membrane
- wt
wild type
- CHO
Chinese hamster ovary
- TCA
trichloroacetic acid
Footnotes
This paper was submitted directly (Track II) to the PNAS office.
References
- 1.Carstea E D, Morris J A, Coleman K G, Loftus S K, Zhang D, Cummings C, Gu J, Rosenfeld M A, Pavan W J, et al. Science. 1997;277:228–231. [Google Scholar]
- 2.Loftus S K, Morris J A, Carstea E D, Gu J Z, Cummings C, Brown A, Ellison J, Ohno K, Rosenfeld M A, et al. Science. 1997;277:232–235. doi: 10.1126/science.277.5323.232. [DOI] [PubMed] [Google Scholar]
- 3.Davies J P, Ioannou Y A. J Biol Chem. 2000;275:24367–24374. doi: 10.1074/jbc.M002184200. [DOI] [PubMed] [Google Scholar]
- 4.Ioannou Y A. Mol Genet Metab. 2000;71:175–181. doi: 10.1006/mgme.2000.3061. [DOI] [PubMed] [Google Scholar]
- 5.Neufeld E B, Wastney M, Patel S, Suresh S, Cooney A M, Dwyer N K, Roff C F, Ohno K, Morris J A, et al. J Biol Chem. 1999;274:9627–9635. doi: 10.1074/jbc.274.14.9627. [DOI] [PubMed] [Google Scholar]
- 6.Higgins M E, Davies J P, Chen F W, Ioannou Y A. Mol Genet Metab. 1999;68:1–13. doi: 10.1006/mgme.1999.2882. [DOI] [PubMed] [Google Scholar]
- 7.Zhang M, Dwyer N K, Neufeld E B, Love D C, Cooney A, Comly M, Patel S, Watari H, Strauss J F, III, et al. J Biol Chem. 2001;276:3417–3425. doi: 10.1074/jbc.M005393200. [DOI] [PubMed] [Google Scholar]
- 8.Ory D S. Biochim Biophys Acta. 2000;1529:331–339. doi: 10.1016/s1388-1981(00)00158-x. [DOI] [PubMed] [Google Scholar]
- 9.Davies J P, Chen F W, Ioannou Y A. Science. 2000;290:2295–2298. doi: 10.1126/science.290.5500.2295. [DOI] [PubMed] [Google Scholar]
- 10.Vanier M T. Neurochem Res. 1999;24:481–489. doi: 10.1023/a:1022575511354. [DOI] [PubMed] [Google Scholar]
- 11.Yano T, Taniguchi M, Akaboshi S, Vanier M T, Tai T, Sakuraba H, Ohno K. Proc Japan Acad. 1996;72:214–219. [Google Scholar]
- 12.Watanabe Y, Akaboshi S, Ishida G, Takeshima T, Yano T, Taniguchi M, Ohno K, Nakashima K. Brain Dev. 1998;20:95–97. doi: 10.1016/s0387-7604(97)00113-7. [DOI] [PubMed] [Google Scholar]
- 13.Zervas M, Dobrenis K, Walkley S U. J Neuropathol Exp Neurol. 2001;60:49–64. doi: 10.1093/jnen/60.1.49. [DOI] [PubMed] [Google Scholar]
- 14.Lancer W I, Hirst T R, Holmes R K. Biochim Biophys Acta. 1999;1450:177–190. doi: 10.1016/s0167-4889(99)00070-1. [DOI] [PubMed] [Google Scholar]
- 15.Higaki K, Ninomiya H, Sugimoto Y, Suzuki T, Niwa H, Pentchev P G, Vanier M T, Ohno K. J Biochem. 2001;129:875–880. doi: 10.1093/oxfordjournals.jbchem.a002932. [DOI] [PubMed] [Google Scholar]
- 16.Yamamoto T, Ninomiya H, Matusmoto M, Ohta Y, Nanba E, Tsutsumi Y, Yamakawa K, Millat G, Vanier M T, et al. J Med Genet. 2000;37:707–712. doi: 10.1136/jmg.37.9.707. [DOI] [PMC free article] [PubMed] [Google Scholar]
- 17.Liu Y, Wu Y P, Wada R, Neufeld E B, Mullin K A, Howard A C, Pentchev P G, Vanier M T, Suzuki K, Proia R L. Hum Mol Genet. 2000;12:1087–1092. doi: 10.1093/hmg/9.7.1087. [DOI] [PubMed] [Google Scholar]
- 18.Watari H, Blanchette-Mackie E J, Dwyer N K, Watari M, Neufield E B, Patel S, Penchev P G, Strauss J F., III J Biol Chem. 1999;274:21861–21866. doi: 10.1074/jbc.274.31.21861. [DOI] [PubMed] [Google Scholar]
- 19.Fishman P H. J Cell Biol. 1982;93:860–865. doi: 10.1083/jcb.93.3.860. [DOI] [PMC free article] [PubMed] [Google Scholar]
- 20.Kassis S, Hagmann J, Fishman P H. J Biol Chem. 1982;257:12148–12152. [PubMed] [Google Scholar]
- 21.Gorvel J P, Chavrier P, Zerial M, Gruenberg J. Cell. 1991;64:915–925. doi: 10.1016/0092-8674(91)90316-q. [DOI] [PubMed] [Google Scholar]
- 22.Clague M J. Biochem J. 1998;336:271–282. doi: 10.1042/bj3360271. [DOI] [PMC free article] [PubMed] [Google Scholar]
- 23.Mu F T, Callaghan J M, Steele-Mortimer O, Stenmark H, Parton R G, Campbell P L, McCluskey J, Yeo J P, Tock E P, Toh B H. J Biol Chem. 1995;270:13503–13511. doi: 10.1074/jbc.270.22.13503. [DOI] [PubMed] [Google Scholar]
- 24.Okamoto Y, Ninomiya H, Miwa S, Masaki T. J Biol Chem. 2000;275:6439–6446. doi: 10.1074/jbc.275.9.6439. [DOI] [PubMed] [Google Scholar]
- 25.Kolter T, Sandhoff K. Brain Pathol. 1998;8:79–100. doi: 10.1111/j.1750-3639.1998.tb00138.x. [DOI] [PMC free article] [PubMed] [Google Scholar]
- 26.Puri V, Watanabe R, Dominguez M, Sun X, Wheatley C L, Marks D L, Pagano R E. Nat Cell Biol. 1999;1:386–388. doi: 10.1038/14084. [DOI] [PubMed] [Google Scholar]