

Abstract
We describe an imaging procedure to measure axon length in zebrafish embryos in vivo. Automated fluorescent image acquisition was performed with the ImageXpress Micro high content screening reader and further analysis of axon lengths was performed on archived images using AcuityXpress software. We utilized the Neurite Outgrowth Application module with a customized protocol (journal) to measure the axons. Since higher doses of ethanol (2–2.5%, v/v) have been shown to deform motor neurons and axons during development, here we used ethanol to treat transgenic [hb9:GFP (green fluorescent protein)] zebrafish embryos at 28 hpf (hours post-fertilization). These embryos express GFP in the motor neurons and their axons. Embryos after ethanol treatment were arrayed in 384-well plates for automated fluorescent image acquisition in vivo. Average axon lengths of high dose ethanol-treated embryos were significantly lower than the control. Another experiment showed that there was no significant difference in the axon lengths between the embryos grown for 24 h at 22°C and 28.5°C. These test experiments demonstrate that using axon development as an end-point, compound screening can be performed in a time-efficient manner.
Keywords: Zebrafish, Transgenic embryo, Axon, High content imaging, Ethanol
1. Introduction
Developmental toxicity assays are designed to assess the extent to which xenobiotic chemicals affect embryonic development. There are several advantages to incorporating fish embryo toxicity tests into routine chemical toxicity assessments since these tests require minimal amount of test compound and can be accomplished in only two to three days. Thus, they are less time-consuming than typical developmental toxicity tests. In addition, a variety of sub-lethal endpoints can easily be obtained including those useful for the assessment of a chemical’s teratogenicity.
The zebrafish (Danio rerio) emerged as a model organism for genetic studies of vertebrate developmental mechanisms more than three decades ago (Streisinger et al., 1981). Compared to rodent models, zebrafish offer many advantages for high-throughput screening: their small size allows for easier handling and husbandry, they are relatively inexpensive, they produce large numbers of progeny (~200 eggs in one mating), their development is rapid and the embryos and larvae are transparent. In addition, the zebrafish’s ability to rapidly and efficiently absorb small molecules in water represents a major advantage for rapid and noninvasive behavioral screenings when compared to other model organisms, especially mammals, and is, thus, proving to be valuable in drug screening and toxicology assays (Kari et al., 2007; Parng et al., 2002). In contrast to rodent embryo culture, which is limited to the period of early organogenesis, zebrafish embryos can be observed over longer spans of development. Since its first employment as a model organism for toxicological studies, emphasis has been given to characterizing chemical effects on molecules within the nervous system, a difficult task to undertake in mammals (Key and Devine, 2003). The zebrafish has also been used as a model in other areas of research such as aging (Gerhard, 2007; Gerhard and Cheng, 2002; Key and Devine, 2003), neurological diseases (Bretaud et al., 2004), drug addiction (Ninkovic and Bally-Cuif, 2006) and behavior (Fetcho and Liu, 1998; Miklosi and Andrew, 2006; Salas et al., 2006).
High-throughput phenotypic analyses of zebrafish embryos in vivo using multi-well formats are relevant for screening chemical compounds. In such systems, complex cell–cell and cell–matrix interactions remain intact in contrast to most cell-based in vitro screening approaches. The zebrafish is the only vertebrate model used to date for chemical genetics and large-scale in vivo drug screens (Driever and Fishman, 1996; Haffter et al., 1996; Vogt et al., 2009).
Ethanol is one of the most common drugs of abuse and its effects on adult zebrafish locomotor behavior and startle responses (Dlugos and Rabin, 2003; Driscoll et al., 1990; Gerlai and McNamara, 2000) and predator avoidance and anxiolytic behavior (Gerlai et al., 2006; Mathur and Guo, 2011) have been reported. Adult zebrafish (AB strain) show increased preference for aquatic compartments containing 1.5% ethanol (Mathur et al., 2011) versus no ethanol. Zebrafish larvae have been used as a model vertebrate organism in large-scale genetic analyses to study biological effects of alcohol (Lockwood et al., 2004). Using this method in an ethanol-modulated camouflage response screen, many signaling molecules regulating acute locomotor behavior in response to ethanol have been identified (Peng et al., 2009). When embryos are exposed to alcohol, several abnormalities that include delay in motor and reflex development, pre- and post-natal growth with organ-specific deformities in cranium, face, joint and heart become obvious (Driscoll et al., 1990; Jones et al., 1973; Staisey and Fried, 1983). Using the zebrafish embryo as a model system, alcohol exposure studies have detailed developmental malformations (Arenzana et al., 2006; Bilotta et al., 2004; Carvan et al., 2004; Dlugos and Rabin, 2007) although high doses of ethanol are required to induce defects that are similar to mammalian models (Cudd, 2005; Matsui et al., 2006). Nonetheless, zebrafish embryos exhibit symptoms characteristic of fetal alcohol syndrome after alcohol exposure showing defective eye and skeletal muscle development, heart rate, apoptosis in the CNS and locomotor behavior (Bilotta et al., 2004; Carvan et al., 2004). Early exposure to ethanol results in compromised motor coordination in humans and other animal models (Driscoll et al., 1990; Kalberg et al., 2006). In zebrafish embryos, ethanol appears to alter neuromuscular junction development (Sylvain et al., 2011). Neurotoxicity in zebrafish embryos caused by exposure to ethanol has been reported (Parng et al., 2007), in which only one dose of ethanol and one time point (5 h embryo exposed to 2.5% ethanol for 1 h) was used. These embryos showed defects in optic nerves and motor neurons and affected neuronal proliferation. In another study, a 24 h ethanol treatment induced CNS neuron death and skeletal dysmorphogenesis in a dose-dependent (3–100 mM) manner (Carvan et al., 2004), in which acridine orange staining of whole embryos (24 h) was performed to investigate overall cell death (not specific for neurons or other specific cell types). Zebrafish embryos exposed to ethanol for 16 h, between 8 and 24 h post-fertilization (hpf), develop defective motor neurons, motor axons and muscle fibers (Sylvain et al., 2010).
Based on this information, we used ethanol as a positive control for an image-based high content screening (HCS) method aimed at fast and efficient data output to determine changes in motor axon length. Developmental changes in axons in embryos growing at two different temeratures (22 °C and 28.5 °C) were also analyzed. In our studies we used the hb9-GFP transgenic zebrafish (Flanagan-Steet et al., 2005) embryos. The transcription factor hb9 is found in developing motor neurons of both mammals (William et al., 2003) and zebrafish (Cheesman et al., 2004; Park et al., 2004). In the hb9-GFP transgenic fish, motor neurons are labeled with strong neuron-specific expression of GFP under the control of the regulatory elements of the zebrafish hb9 gene (Flanagan-Steet et al., 2005).
Our on-going work on this procedure aimed at measuring axons in vivo, includes further improvement in reducing signal-to-noise ratios while maximizing the efficacy of the measurement parameters to standardize and validate the assay procedure.
2. Materials and methods
2.1. Animals
Adult transgenic (hb9:GFP) zebrafish (Danio rerio, AB strain) were obtained from the Zebrafish International Resource Center at the University of Oregon (Eugene, OR). The fish were kept in fish tanks (Aquatic Habitats) at the NCTR/FDA zebrafish facility containing buffered water (pH 7.5) at 28.5 °C, and were fed daily live brine shrimp and Zeigler dried flake food (Zeiglers, Gardeners, PA). Handling and maintenance of zebrafish were in compliance with the NIH Guide for the Care and Use of Laboratory Animals and approved by the NCTR/FDA IACUC. The day–night cycle was maintained at 14:10 h, and spawning and fertilization were stimulated by the onset of light. Fertilized zebrafish embryos were collected from the bottom of the tank. The eggs/embryos were placed in Petri dishes and washed thoroughly with buffered egg water (reverse osmosis water containing 60 mg sea salt [(Crystal Sea®, Aquatic Eco-systems, Inc, Apopka, FL) per liter of water (pH 7.5)] and then allowed to develop in an incubator at 28.5 °C for further experiments.
2.2. Embryo dechorionation
Although, for experimental ease of handling embryos with chorions intact (Murphey and Zon, 2006), most zebrafish embryo toxicities have been studied using embryos without dechorionation (Anderson et al., 2007; Choi et al., 2007; Hultman et al., 2008; Jung et al., 2005; Khersonsky et al., 2003), there are discrepancies in results being reported in screening systems due to differential uptake/metabolism of chemicals between embryos and adults, which is reportedly resolved when embryos are dechorionated prior to treatment (Wendler et al. unpublished data discussed in (Lammer et al., 2009)). Therefore, we used manually dechorionated embryos in all our assays. Embryos at ~27 h were manually dechorionated under a dissecting microscope using a pair of watchmaker’s forceps.
2.3. Reagents
Ethanol (200 Proof, Cat # 2716 GEA) was purchased from Decon Labs, Inc (King of Prussia, PA).
2.4. Treatment of zebrafish embryos with ethanol and arraying of embryos in multi-well plates
Ethanol exposures (1%, 1.5%. 2%, and 2.5% v/v) were carried out as follows. Embryos were placed in Petri dishes (75 embryos/30 ml buffered egg water). Twenty-eight hour dechorionated embryos were used. Ethanol treatments at various doses continued for 20 h. Untreated control groups of embryos were examined in parallel. Post-treatment zebrafish embryos (~48 h old) were arrayed (one embryo/well) manually in 384-well plates (BD Falcon, Cat # 353270). Twenty five microliters of fish water containing 0.016% tricaine was added to each well. After 20 min plates were centrifuged at 32×g for 1 min to orient the embryos flat on the bottom of the wells.
2.5. Zebrafish embryos grown at two different temperatures for detection of changes in axon growth
Embryos were manually dechorionated at 24 hpf and a subset of embryos were allowed to grow at 22 °C and another at 28.5 °C for 24 h before being arrayed in a 384-well plate for image acquisition.
2.6. High-throughput image acquisition
For live imaging, ImageXpress micro (Molecular Devices, Sunnyvale, CA) was used for automated imaging. A fluorescent image of each embryo was captured automatically using a Semrock 2X PlanApo objective (binning2; gain2). In the MetaXpress software, under Acquisition Loops, laser-based focusing and shading correction were enabled. Under Autofocus, the equipment was directed to focus on the plate bottom and offset by bottom thickness. The first well acquired was the initial well for finding the sample. Safe working distance operations were enabled. Under Wavelength, FITC was selected with an exposure of 100 ms. The autofocus was set to Laser with Z-offset. Proper image acquisition was confirmed in several wells to ensure that gain and exposure levels didn’t result in images with saturated regions. Plate acquisition then commenced. The instrument automatically acquired images from all wells and archived them in a SQL server database as low resolution montages of the entire plate as well as individual high resolution TIFF files. A 384-well plate required ~10 minutes for image acquisition and storage.
After image acquisition, two types of motor neuron identification were performed. In the first identification method, the entire notochords of zebrafish were detected using TIF images by importing them into MetaXpress software for analysis using the Neurite Outgrowth Module (an application module available from Molecular Devices) to create an image overlay. The focus of the module was counting and measuring the length of axons off the notochord. The application settings identified the notochord as a cell body and the axons as outgrowths of the cell body. The application settings for identification of cell bodies were as follows: ~ max width, 1000 μm; intensity above local background, 1000 gray levels; minimum area, 20,000 μm2. For identification of outgrowths, a maximum width of 25 μm and outgrowth intensity above local background of 250 gray levels was utilized. In the second identification method, the same subset of five motor neurons were detected using TIF images imported into MetaXpress software for analysis using a custom journal, the Select Axon journal (Supplemental Fig. 1). This complex interactive journal (possibly insert figure) processed each image through a series of filters to remove GFP background noise. The user was then allowed to draw an area around the axons of interest, which were then analyzed with the Neurite Outgrowth Module which was configured in the following manner: max width, 1000 μm; intensity above local background, 20 gray levels; minimum area, 1000 μm2, outgrowth maximum width of 25 μm and outgrowth intensity above local background of 400 gray levels was utilized.
2.7. Data analysis
Data from images, processed using the first identification method, were imported into AcuityXpress and a plate layout was created. Data were filtered to exclude wells that were not in focus, wells without embryos, and wells containing embryos that were unhealthy or in an improper orientation using the following settings under Data Types, Cell Measurement, Cell: (Neurite Outgrowth) in the Dataset Wizard: cell processes≥1; 80,000 μm2≤cell body area≥300,000 μm2; mean outgrowth intensity≥80; max process length≤250 μm. After creation of the dataset, the data view was configured in multiple rows by treatment and well name filtering resulting in an n of 15 per experimental group. After filtering, data were exported as a summary log to Microsoft Excel and then pasted into Sigma Plot 9.0/Sigma Stat 3.1 for analysis. Use of the interactive journal in the second identification method allowed the user to exclude wells that were not in focus, wells without embryos, and wells containing embryos that were unhealthy or in an improper orientation during analysis. For experiments with different concentrations of ETOH, n=17. For experiment of temperature differences, n=65. For experiment comparing control, 0.1% DMSO, and 2.5% ETOH, n=19. Data from analyzed subsets were then automatically exported into Excel. This data was then statistically analyzed using Sigma Plot 9.0/Sigma Stat 3.1.
2.8. Statistical analysis
One Way ANOVA and Holm-Sidak pair-wise multiple comparison post-hocs were used to determine statistical significance with p<0.05. For comparing temperature differences, a t-test was used to determine statistical significance with p<0.05.
3. Results and discussion
Dechorionated embryos (28 hpf) were treated in batches with ethanol at 1% (n=48), 1.5% (n=48), 2% (n=48) and 2.5% (n=48). Untreated embryos ( n=48) were used as control. Acquired images were analyzed using the AcuityXpress software. A schematic diagram of the trunk segment of a 48 hpf embryo showing motoneurons and axons is presented in Fig. 1. The spinal cord and notochord and motor neurons reside on the floor plate with axons descending from the spinal cord at the same ventral root, crossing the horizontal myoseptum (dashed line) through the trajectory point, and then diverge along axon-specific pathways corresponding to each hemisegment are shown. Three populations of secondary motoneurons are the CaP-like (Caudal Primary neuron-like), the MiP-like (Middle Primary neuron-like) and the RoP-like (Rostral Primary neuron-like) that reside in the spinal cord. Studies using immunolabelling with anti-acetylated alpha-tubulin antibody have indicated that zebrafish embryos exposed to 2.5% ethanol show significantly higher rates of motor neuron axon defects (Murphey and Zon, 2006). In addition, immunolabelling of primary and secondary motor neurons, using znp-1 and zn-8 have shown that embryos exposed to 2% and 2.5% ethanol exhibit significantly higher rates of primary and secondary motor neuron axon defects compared to controls (Sylvain et al., 2010). An application module similar to the one we used in this high throughput assay has been successfully used for efficiently quantifying angiogenic vessels in transgenic (VEGFR2:GRCFP) zebrafish embryos treated with anti-angiogenic compounds (Tran et al., 2007). Thus far no reports are available on high throughput analyses comparing axon lengths after drug exposure in zebrafish. A part of a 384-well plate arrayed with the embryos is shown in Fig. 2. This plate shows representative images used to measure and compare axon lengths in the control and ethanol-treated embryos that are shown in Fig. 3. For all groups, GFP-positive (captured by the FITC filter) images are shown along with the overlay images and merged GFP/overlay images derived from the MetaXpress Neurite Outgrowth module. The data presented expose some of the limitations of this method. For example in the controls (Fig. 3A–C), the overlay shows that some axons were missed from being measured or the full-length of the axon was not measured. In addition, this method picked up some non-axonal signals that it measured as part of axons (loops in 2% ethanol-treated embryos, Fig. 3D–F and in 2.5% ethanol treated embryos, Fig. 3G–I). Additionally, images were imported into MetaXpress software for analysis using a custom journal, the Select Axon journal as described in Materials and methods section (Supplementary Fig. 1 and Fig. 4A). Quantification of the data show a significant reduction in average axon length in the 1.5%, 2% and 2.5% ethanol-treated embryos compared to that in the controls (Fig. 4B). However, the differences between 1.5% and 2% EtOH groups and between 2% and 2.5% EtOH groups were not significant.
Fig. 1.
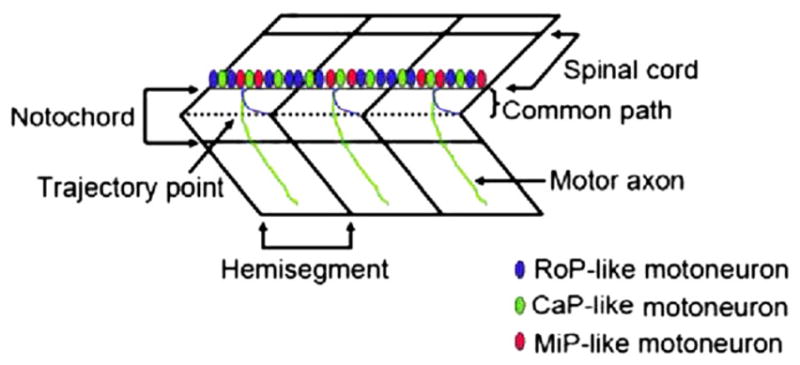
A schematic diagram of the trunk segment of a 48 hpf embryo showing moto-neurons and axons. The spinal cord and notochord are indicated. The layer in between (not marked) on which motor neurons reside is the floor plate. Their axons descend from the spinal cord at the same ventral root, cross the horizontal myoseptum (dashed line) through the trajectory point, and then diverge along axon-specific pathways corresponding to each hemisegment. Three populations of secondary motoneurons are the CaP-like, the MiP-like and the RoP-like that reside in the spinal cord.
Fig. 2.

A low resolution montage of a region of the 384-well plate arrayed with the zebrafish embryos in the wells is shown. Embryos are manually arrayed into the plate using a transfer pipet. Using a multi-channel pipet, excess water is aspirated from the wells and 25 μl fish water containing tricaine (0.016%) is added to each well.
Fig. 3.

Representative images from a 384-well plate used for high content automatic image capture and analysis of hb9:GFP transgenic zebrafish embryos. A panel of control (untreated) and ethanol-treated embryos (48 hpf) are presented. Representative images of GFP expression captured by FITC filter (green), overaly (red) and overlay (red plus green) are shown, respectively for each group. Control (A, B, C); 2% ethanol (D, E, F); and 2.5% ethanol (G, H, I). EtOH=Ethanol.
Fig. 4.

Average axon lengths in the control and ethanol-treated embryos derived from the acquired images. Using a custom journal, the Select Axon journal following the method detailed in the “Materials and methods” section, lengths of axons in the specific regions (marked in dotted red lines) were calculated from the archived images Representative images for control, 1%, 1.5%, 2% and 2.5% ETOH (ethanol) are shown (A). Values for average axon lengths are presented as mean +/− SD (B). Significance (*) level was set at p<0.05. NS=no significant difference.
When zebrafish embryos were exposed to ethanol from 8 to 24 hpf abnormal axonogenesis was noticeable in 3 day-old embryos (Sylvain et al., 2010). The embryos treated with ethanol (> 1.5% v/v) were smaller than controls, exhibited pericardial edema and some of their ventral axons curved abnormally within the ventral musculature or terminated prematurely (Sylvain et al., 2010). In our study, we exposed 28 hpf embryos in which primary neurons and axons were already developed to varying doses of ethanol for 20 h (static exposure). At 48 hpf, these embryos showed reductions in axon (secondary ventral motor axon) length, indicating that ethanol did affect secondary motor axon development. In our study, however, we specifically focused on the efficacy of the HCS methodology we developed in order to measure axon lengths in a 384-well plate that had one embryo in each well. Although, we cannot directly compare the data with that reported by Sylvain et al. (2011) due to the difference in treatment conditions (duration) and age of exposure, data from our high content analyses of axon length are consistent with their observation that ethanol negatively affected motor axon development.
In another set of experiments, we analyzed the effects of two different temperatures on axon development. Embryos at 24 hpf were grown at 22°C or 28.5°C for another 24 h and the average axon lengths between the two groups were analyzed (Fig. 5). Using a second identification method, the same subset of five axons were selected (Fig. 5A) and images were imported into MetaXpress software for analysis using a custom journal, the Select Axon journal (described in Materials and methods section). The data showed that there was no significant difference between these two groups (Fig. 5B).
Fig. 5.

High content automatic image capture and analysis of axon lengths of hb9:GFP transgenic zebrafish embryos grown at two different temperatures. A panel of embryos grown for 24 h starting at 24 hpf at 22 °C and 28.5 °C were analyzed for axon growth. The analysis was at the actual age of 48 hpf. Representative images for 22 °C and 28.5 °C (A) and average axon lengths (B) are shown. Data are calculated from the archived images following the method detailed in the “Materials and methods” section. Values are presented as mean +/− SD. Significance (*) level was set at p<0.05.
In conclusion, we provide data based on a high content imaging and analysis method using the Neurite Outgrowth Application module. This module can be successfully used to analyze axonogenesis in zebrafish embryos both in vivo (using transgenic fish with promoter-driven expression of fluorescent proteins in the axons) and in vitro (using immunolabelling of axons with anti-acetylated α-tubulin). Further efforts are underway to standardize the protocol in order to increase the signal-to-noise ratio to achieve more efficiency in the measurement method. This high content imaging method can, in a time-efficient manner (~10 min/384-well plate), provide data in high-throughput on safety assessments of individual drugs or a library of compounds.
Supplementary Material
Acknowledgments
This work was supported by the National Center for Toxicological Research (NCTR)/U.S. Food and Drug Administration (FDA). We thank Melanie Dumas for her help in zebrafish breeding.
Footnotes
4. Disclaimer
This document has been reviewed in accordance with United States Food and Drug Administration (FDA) policy and approved for publication. Approval does not signify that the contents necessarily reflect the position or opinions of the FDA nor does mention of trade names or commercial products constitute endorsement or recommendation for use. The findings and conclusions in this report are those of the authors and do not necessarily represent the views of the FDA.
Supplementary materials related to this article can be found online at doi:10.1016/j.ntt.2011.08.013.
Conflict of interest
Nothing declared.
References
- Anderson C, Bartlett SJ, Gansner JM, Wilson D, He L, Gitlin JD, et al. Chemical genetics suggests a critical role for lysyl oxidase in zebrafish notochord morphogenesis. Mol Biosyst. 2007;3:51–9. doi: 10.1039/b613673g. [DOI] [PMC free article] [PubMed] [Google Scholar]
- Arenzana FJ, Carvan MJ, III, Aijon J, Sanchez-Gonzalez R, Arevalo R, Porteros A. Teratogenic effects of ethanol exposure on zebrafish visual system development. Neurotoxicol Teratol. 2006;28:342–8. doi: 10.1016/j.ntt.2006.02.001. [DOI] [PubMed] [Google Scholar]
- Bilotta J, Barnett JA, Hancock L, Saszik S. Ethanol exposure alters zebrafish development: a novel model of fetal alcohol syndrome. Neurotoxicol Teratol. 2004;26:737–43. doi: 10.1016/j.ntt.2004.06.011. [DOI] [PubMed] [Google Scholar]
- Bretaud S, Lee S, Guo S. Sensitivity of zebrafish to environmental toxins implicated in Parkinson’s disease. Neurotoxicol Teratol. 2004;26:857–64. doi: 10.1016/j.ntt.2004.06.014. [DOI] [PubMed] [Google Scholar]
- Carvan MJ, III, Loucks E, Weber DN, Williams FE. Ethanol effects on the developing zebrafish: neurobehavior and skeletal morphogenesis. Neurotoxicol Teratol. 2004;26:757–68. doi: 10.1016/j.ntt.2004.06.016. [DOI] [PubMed] [Google Scholar]
- Cheesman SE, Layden MJ, Von Ohlen T, Doe CQ, Eisen JS. Zebrafish and fly Nkx6 proteins have similar CNS expression patterns and regulate motoneuron formation. Development. 2004;131:5221–32. doi: 10.1242/dev.01397. [DOI] [PubMed] [Google Scholar]
- Choi TY, Kim JH, Ko DH, Kim CH, Hwang JS, Ahn S, et al. Zebrafish as a new model for phenotype-based screening of melanogenic regulatory compounds. Pigment Cell Res. 2007;20:120–7. doi: 10.1111/j.1600-0749.2007.00365.x. [DOI] [PubMed] [Google Scholar]
- Cudd TA. Animal model systems for the study of alcohol teratology. Exp Biol Med (Maywood) 2005;230:389–93. doi: 10.1177/15353702-0323006-06. [DOI] [PubMed] [Google Scholar]
- Dlugos CA, Rabin RA. Ethanol effects on three strains of zebrafish: model system for genetic investigations. Pharmacol Biochem Behav. 2003;74:471–80. doi: 10.1016/s0091-3057(02)01026-2. [DOI] [PubMed] [Google Scholar]
- Dlugos CA, Rabin RA. Ocular deficits associated with alcohol exposure during zebrafish development. J Comp Neurol. 2007;502:497–506. doi: 10.1002/cne.21320. [DOI] [PubMed] [Google Scholar]
- Driever W, Fishman MC. The zebrafish: heritable disorders in transparent embryos. J Clin Invest. 1996;97:1788–94. doi: 10.1172/JCI118608. [DOI] [PMC free article] [PubMed] [Google Scholar]
- Driscoll CD, Streissguth AP, Riley EP. Prenatal alcohol exposure: comparability of effects in humans and animal models. Neurotoxicol Teratol. 1990;12:231–7. doi: 10.1016/0892-0362(90)90094-s. [DOI] [PubMed] [Google Scholar]
- Fetcho JR, Liu KS. Zebrafish as a model system for studying neuronal circuits and behavior. Ann N Y Acad Sci. 1998;860:333–45. doi: 10.1111/j.1749-6632.1998.tb09060.x. [DOI] [PubMed] [Google Scholar]
- Flanagan-Steet H, Fox MA, Meyer D, Sanes JR. Neuromuscular synapses can form in vivo by incorporation of initially aneural postsynaptic specializations. Development. 2005;132:4471–81. doi: 10.1242/dev.02044. [DOI] [PubMed] [Google Scholar]
- Gerhard GS. Small laboratory fish as models for aging research. Ageing Res Rev. 2007;6:64–72. doi: 10.1016/j.arr.2007.02.007. [DOI] [PubMed] [Google Scholar]
- Gerhard GS, Cheng KC. A call to fins! Zebrafish as a gerontological model. Aging Cell. 2002;1:104–11. doi: 10.1046/j.1474-9728.2002.00012.x. [DOI] [PubMed] [Google Scholar]
- Gerlai R, McNamara A. Anesthesia induced retrograde amnesia is ameliorated by ephrinA5-IgG in mice: EphA receptor tyrosine kinases are involved in mammalian memory. Behav Brain Res. 2000;108:133–43. doi: 10.1016/s0166-4328(99)00139-4. [DOI] [PubMed] [Google Scholar]
- Gerlai R, Lee V, Blaser R. Effects of acute and chronic ethanol exposure on the behavior of adult zebrafish (Danio rerio) Pharmacol Biochem Behav. 2006;85:752–61. doi: 10.1016/j.pbb.2006.11.010. [DOI] [PMC free article] [PubMed] [Google Scholar]
- Haffter P, Granato M, Brand M, Mullins MC, Hammerschmidt M, Kane DA, et al. The identification of genes with unique and essential functions in the development of the zebrafish, Danio rerio. Development. 1996;123:1–36. doi: 10.1242/dev.123.1.1. [DOI] [PubMed] [Google Scholar]
- Hultman KA, Scott AW, Johnson SL. Small molecule modifier screen for kit-dependent functions in zebrafish embryonic melanocytes. Zebrafish. 2008;5:279–87. doi: 10.1089/zeb.2008.0542. [DOI] [PMC free article] [PubMed] [Google Scholar]
- Jones KL, Smith DW, Ulleland CN, Streissguth P. Pattern of malformation in offspring of chronic alcoholic mothers. Lancet. 1973;1:1267–71. doi: 10.1016/s0140-6736(73)91291-9. [DOI] [PubMed] [Google Scholar]
- Jung DW, Williams D, Khersonsky SM, Kang TW, Heidary N, Chang YT, et al. Identification of the F1F0 mitochondrial ATPase as a target for modulating skin pigmentation by screening a tagged triazine library in zebrafish. Mol Biosyst. 2005;1:85–92. doi: 10.1039/b417765g. [DOI] [PubMed] [Google Scholar]
- Kalberg WO, Provost B, Tollison SJ, Tabachnick BG, Robinson LK, Eugene Hoyme H, et al. Comparison of motor delays in young children with fetal alcohol syndrome to those with prenatal alcohol exposure and with no prenatal alcohol exposure. Alcohol Clin Exp Res. 2006;30:2037–45. doi: 10.1111/j.1530-0277.2006.00250.x. [DOI] [PubMed] [Google Scholar]
- Kari G, Rodeck U, Dicker AP. Zebrafish: an emerging model system for human disease and drug discovery. Clin Pharmacol Ther. 2007;82:70–80. doi: 10.1038/sj.clpt.6100223. [DOI] [PubMed] [Google Scholar]
- Key B, Devine CA. Zebrafish as an experimental model: strategies for developmental and molecular neurobiology studies. Methods Cell Sci. 2003;25:1–6. doi: 10.1023/B:MICS.0000006849.98007.03. [DOI] [PubMed] [Google Scholar]
- Khersonsky SM, Jung DW, Kang TW, Walsh DP, Moon HS, Jo H, et al. Facilitated forward chemical genetics using a tagged triazine library and zebrafish embryo screening. J Am Chem Soc. 2003;125:11804–5. doi: 10.1021/ja035334d. [DOI] [PubMed] [Google Scholar]
- Lammer E, Kamp HG, Hisgen V, Koch M, Reinhard D, Salinas ER, et al. Development of a flow-through system for the fish embryo toxicity test (FET) with the zebrafish (Danio rerio) Toxicol In Vitro. 2009;23:1436–42. doi: 10.1016/j.tiv.2009.05.014. [DOI] [PubMed] [Google Scholar]
- Lockwood B, Bjerke S, Kobayashi K, Guo S. Acute effects of alcohol on larval zebrafish: a genetic system for large-scale screening. Pharmacol Biochem Behav. 2004;77:647–54. doi: 10.1016/j.pbb.2004.01.003. [DOI] [PubMed] [Google Scholar]
- Mathur P, Guo S. Differences of acute versus chronic ethanol exposure on anxiety-like behavioral responses in zebrafish. Behav Brain Res. 2011;219:234–9. doi: 10.1016/j.bbr.2011.01.019. [DOI] [PMC free article] [PubMed] [Google Scholar]
- Mathur P, Berberoglu MA, Guo S. Preference for ethanol in zebrafish following a single exposure. Behav Brain Res. 2011;217:128–33. doi: 10.1016/j.bbr.2010.10.015. [DOI] [PMC free article] [PubMed] [Google Scholar]
- Matsui JI, Egana AL, Sponholtz TR, Adolph AR, Dowling JE. Effects of ethanol on photo-receptors and visual function in developing zebrafish. Invest Ophthalmol Vis Sci. 2006;47:4589–97. doi: 10.1167/iovs.05-0971. [DOI] [PMC free article] [PubMed] [Google Scholar]
- Miklosi A, Andrew RJ. The zebrafish as a model for behavioral studies. Zebrafish. 2006;3:227–34. doi: 10.1089/zeb.2006.3.227. [DOI] [PubMed] [Google Scholar]
- Murphey RD, Zon LI. Small molecule screening in the zebrafish. Methods. 2006;39:255–61. doi: 10.1016/j.ymeth.2005.09.019. [DOI] [PubMed] [Google Scholar]
- Ninkovic J, Bally-Cuif L. The zebrafish as a model system for assessing the reinforcing properties of drugs of abuse. Methods. 2006;39:262–74. doi: 10.1016/j.ymeth.2005.12.007. [DOI] [PubMed] [Google Scholar]
- Park HC, Shin J, Appel B. Spatial and temporal regulation of ventral spinal cord precursor specification by Hedgehog signaling. Development. 2004;131:5959–69. doi: 10.1242/dev.01456. [DOI] [PubMed] [Google Scholar]
- Parng C, Seng WL, Semino C, McGrath P. Zebrafish: a preclinical model for drug screening. Assay Drug Dev Technol. 2002;1:41–8. doi: 10.1089/154065802761001293. [DOI] [PubMed] [Google Scholar]
- Parng C, Roy NM, Ton C, Lin Y, McGrath P. Neurotoxicity assessment using zebrafish. J Pharmacol Toxicol Methods. 2007;55:103–12. doi: 10.1016/j.vascn.2006.04.004. [DOI] [PubMed] [Google Scholar]
- Peng J, Wagle M, Mueller T, Mathur P, Lockwood BL, Bretaud S, et al. Ethanol-modulated camouflage response screen in zebrafish uncovers a novel role for cAMP and extracellular signal-regulated kinase signaling in behavioral sensitivity to ethanol. J Neurosci. 2009;29:8408–18. doi: 10.1523/JNEUROSCI.0714-09.2009. [DOI] [PMC free article] [PubMed] [Google Scholar]
- Salas C, Broglio C, Duran E, Gomez A, Ocana FM, Jimenez-Moya F, et al. Neuropsychology of learning and memory in teleost fish. Zebrafish. 2006;3:157–71. doi: 10.1089/zeb.2006.3.157. [DOI] [PubMed] [Google Scholar]
- Staisey NL, Fried PA. Relationships between moderate maternal alcohol consumption during pregnancy and infant neurological development. J Stud Alcohol. 1983;44:262–70. doi: 10.15288/jsa.1983.44.262. [DOI] [PubMed] [Google Scholar]
- Streisinger G, Walker C, Dower N, Knauber D, Singer F. Production of clones of homozygous diploid zebra fish (Brachydanio rerio) Nature. 1981;291:293–6. doi: 10.1038/291293a0. [DOI] [PubMed] [Google Scholar]
- Sylvain NJ, Brewster DL, Ali DW. Zebrafish embryos exposed to alcohol undergo abnormal development of motor neurons and muscle fibers. Neurotoxicol Teratol. 2010;32:472–80. doi: 10.1016/j.ntt.2010.03.001. [DOI] [PubMed] [Google Scholar]
- Sylvain NJ, Brewster DL, Ali DW. Embryonic ethanol exposure alters synaptic properties at zebrafish neuromuscular junctions. Neurotoxicol Teratol. 2011;33:313–21. doi: 10.1016/j.ntt.2010.12.001. [DOI] [PubMed] [Google Scholar]
- Tran TC, Sneed B, Haider J, Blavo D, White A, Aiyejorun T, et al. Automated, quantitative screening assay for antiangiogenic compounds using transgenic zebrafish. Cancer Res. 2007;67:11386–92. doi: 10.1158/0008-5472.CAN-07-3126. [DOI] [PubMed] [Google Scholar]
- Vogt A, Cholewinski A, Shen X, Nelson SG, Lazo JS, Tsang M, et al. Automated image-based phenotypic analysis in zebrafish embryos. Dev Dyn. 2009;238:656–63. doi: 10.1002/dvdy.21892. [DOI] [PMC free article] [PubMed] [Google Scholar]
- William CM, Tanabe Y, Jessell TM. Regulation of motor neuron subtype identity by repressor activity of Mnx class homeodomain proteins. Development. 2003;130:1523–36. doi: 10.1242/dev.00358. [DOI] [PubMed] [Google Scholar]
Associated Data
This section collects any data citations, data availability statements, or supplementary materials included in this article.