

Scientific drilling at a submarine mud volcano shows that geofluid migration stimulates methanogenesis in the deep biosphere.
Abstract
Microbial life inhabiting subseafloor sediments plays an important role in Earth’s carbon cycle. However, the impact of geodynamic processes on the distributions and carbon-cycling activities of subseafloor life remains poorly constrained. We explore a submarine mud volcano of the Nankai accretionary complex by drilling down to 200 m below the summit. Stable isotopic compositions of water and carbon compounds, including clumped methane isotopologues, suggest that ~90% of methane is microbially produced at 16° to 30°C and 300 to 900 m below seafloor, corresponding to the basin bottom, where fluids in the accretionary prism are supplied via megasplay faults. Radiotracer experiments showed that relatively small microbial populations in deep mud volcano sediments (102 to 103 cells cm−3) include highly active hydrogenotrophic methanogens and acetogens. Our findings indicate that subduction-associated fluid migration has stimulated microbial activity in the mud reservoir and that mud volcanoes may contribute more substantially to the methane budget than previously estimated.
INTRODUCTION
One of the missions of scientific ocean drilling is to enhance the understanding of the impact of geodynamic processes—such as the subduction of oceanic plates into the Earth’s mantle—on the deep subseafloor biosphere. Previous studies on the deep biosphere have demonstrated that microbes in ocean sediments generally experience long-term energy limitation (1, 2). Throughout millions of years of burial, the increasing pressure and temperatures create an ever more challenging environment for sustaining life, unless bioavailable water and energy substrates are supplied from exogenous biotic and/or abiotic sources (3). Submarine mud volcanoes occurring along the margins of convergent plates are surface expressions of natural conduits that transport low-density, deformable sediments from several kilometers below the seafloor up toward the seafloor. These migration pathways may supply subsurface-derived water, gaseous compounds such as methane (CH4), and even microbes to the overlying hydrosphere and atmosphere (4–7). In particular, methane emission from mud volcanoes is a significant (up to ~10%) source of fossil (radiocarbon-free) methane to the atmosphere (6).
Previous geological and geochemical studies at multiple geographic locations suggest that most CH4 erupting from submarine mud volcanoes originates either from destabilization of gas hydrates immediately beneath the relatively shallow sedimentary layers or from migration of fluids from deeper hydrocarbon accumulations (4, 5). Because of the high-pressure and low-temperature conditions in submarine mud volcano sediments, a large fraction of this migrated CH4 is sequestrated in shallow mud volcano sediments as gas hydrates (5). Gas hydrate stability primarily depends on temperature and pressure (water depth). With normal sea-bottom temperatures of 2° to 4°C, gas hydrate can exist if water depths exceed 250 to 400 m (ca. >25 to 40 atm) (8).
Recent studies have shown that variations in dissolved organic matter and CH4 input from deep sediment layers, as well as variations in rates of fluid advection, control microbial community composition and metabolism in surface sediments at mud volcano sites (9–11). For example, at the Haakon Mosby mud volcano in the Norwegian Sea, microbial communities performing anaerobic oxidation of methane (AOM) consume up to ~40% of upward transported CH4 (9). At the Amsterdam mud volcano in the Eastern Mediterranean Sea, acetoclastic methanogenesis was observed in ~60-cm-deep sediments, likely supported by high concentrations of acetate (up to 1878 μM) produced in deeper layers there (10). Similarly, rate measurements and genetic data from an active brine seep mud volcano in the northern Gulf of Mexico revealed a predominance of acetoclastic over hydrogenotrophic methanogenesis (11). Still remaining to be explored, however, were the composition and metabolism of microbial communities at greater depths in mud volcano sediments than could be sampled by traditional near-surface coring surveys.
Carbon and hydrogen isotopic compositions of CH4, considered together with molar ratios of CH4 to higher hydrocarbons (C1/C2+), can help identify CH4 production pathways (12–14). A previous assessment of these chemical signals in more than 200 onshore mud volcanoes estimated that 76% of CH4 released is thermogenic, 4% is microbial, and 20% is a mixture of methane from both origins (15). Mud volcanoes emitting thermogenic CH4 are generally associated with strongly tectonized petroliferous sedimentary basins. In contrast, the factors controlling the presence, distribution, and quantity of microbially generated CH4 in mud volcano fluids are less understood. The sources of CH4 at offshore subduction zones remain largely elusive, mainly because of the lack of opportunities to directly sample deep subseafloor materials and characterize their microbiology and biogeochemistry in situ. In 2009 and 2012, using the drillship Chikyu, we established Site C9004 by drilling into mud volcano no. 5 (KMV#5) in the Kumano forearc basin of the Nankai Trough, Japan (Fig. 1A). While a submarine mud volcano has been drilled once before, during Ocean Drilling Program Leg 160 in the Mediterranean Sea (16), the deep biosphere and carbon cycling of such environments remain underexplored. In the Kumano Basin, 13 mud volcanoes have been observed at anticlines along the landward megasplay faults (Fig. 1, B and C) (17–20). Chemosynthetic macrofaunal communities occur at seep environments on the summits of these features (19). Previous investigations of surface sediments of mud volcanoes in the area inferred that the erupting fluids consist of water derived from dehydration of clay minerals in subducted sediments and basaltic crust, mixed with thermogenic hydrocarbons originating from the old accretionary prism beneath the forearc basin (19, 20). KMV#5 is one of the active mud volcanoes in the area (17, 19). A release of CH4 was observed here in response to a large earthquake in 2004 [moment magnitude (Mw) 7.5] (21). Furthermore, biogenic CH4 production has been implicated as an additional hydrocarbon source at this site (19, 21). KMV#5 was therefore a prime location at which to investigate the relationship between methanogenesis and mud volcanism.
Fig. 1. Location of the study sites (KMV#5) and seismic profiles of the Kumano forearc basin.
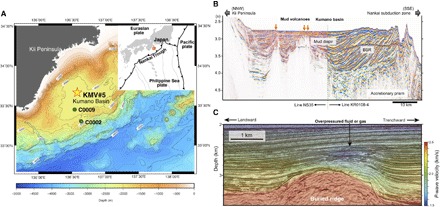
(A) Bathymetric map showing the location of KMV#5 in the Kumano forearc basin and IODP Sites C0002 and C0009. (B) Transect seismic cross-section in the middle part of the Kumano Basin based on the data from Morita et al. (17). (C) P-wave velocity predicted by three-dimensional (3D) tomography inversion during 3D prestack depth migration based on the data from Tsuji et al. (18). The overpressure zone (fluid or gas accumulation zone) is identified as a low-amplitude and low-velocity zone at 400 to 700 mbsf in the forearc basin sequence. The low-velocity zone, which is located above the ridge because of the megasplay fault displacement, suggests that the overpressured fluids are moving upward along the interpreted ancient megasplay faults. The mud volcanoes are located along the northern extension of the megasplay faults.
We recovered sediment core samples from Site C9004 down to 200 m below seafloor (mbsf) using a hydraulic piston coring system (HPCS) and a gas-tight hybrid-pressure coring system (Hybrid-PCS) (22). We show here how geological, geochemical, and microbiological analyses on the core material yield constraints on the origins of water and CH4 in the migrating muds, and provide insights into the presence and activity of microbial life within the Nankai accretionary complex.
RESULTS
Mud volcano sediments
Sediment samples were composed primarily of clay-rich mud, including consolidated to semiconsolidated breccias, which were most likely mixed with fractured sediments by diapiric mud intrusion. After core recovery, small grains of methane hydrates (millimeters to centimeters in diameter) were often observed and collected on the core-cutting area (fig. S1, A and B). X-ray computed tomography (CT) scans of Hybrid-PCS cores also showed that methane hydrates filled pore spaces and veins of sediments (22). The in situ temperature was measured during HPCS coring using the third-generation advanced piston corer temperature tool (APCT-3) at 4, 22, 59, and 121 mbsf, yielding an estimated temperature gradient of 29 ± 0.3°C km−1 (fig. S2). Linear extrapolation of this geothermal gradient places the lower depth limit of the gas hydrate stability zone (GHSZ) [that is, the deepest horizon where pressures and temperatures remain suitable for hydrate formation and stability (19)] at an estimated ~590 m below the summit. The summit of KMV#5 is elevated 112 to 160 m above the regional seafloor, so the base of the GHSZ corresponds to 430 to 478 m below the regional seafloor. This is comparable to the depth of the bottom-simulating reflector (BSR) observed in seismic profiles of the sedimentary basin surrounding KMV#5 (411 to 463 mbsf; figs. S1D and S2).
Fluid chemistry
Geochemical analyses of pore water samples show that chlorinity (Cl−) decreased sharply from seawater-like values (545 mM) at 0 mbsf to 130 to 150 mM at 4 mbsf and then remained constant downcore (Fig. 2A). Concurrent with the Cl− depletion, the oxygen and hydrogen isotopic compositions of water (δ18OH2O and δDH2O) shift toward high (ca. 6‰) and low (ca. −13‰) values relative to seawater (ca. 0‰), respectively (fig. S3, A and B). This trend can be attributed to the addition of water from the dehydration of clay minerals (16, 20) that typically occurs in deeper layers at temperatures ranging from 60° to 160°C (23). Conversely, δDH2O and δ18OH2O values of water obtained from methane hydrate melts were higher than those of pore water (Fig. 2, B and C, and fig. S3, A and B). The original δ18O and δD values of pore water before the formation of methane hydrates are estimated to be +4.3 to +5.3‰ and −9.2 to −16.2‰, respectively (Fig. 2, B and C). These values are based on the averaged δ18O and δD of hydrate water and known isotopic fractionation factors of oxygen and hydrogen in water between structure I hydrate and liquid water (fig. S1C and Supplementary Methods). Using the measured and estimated original δ18O and δD values of pore water, we calculated the average hydrate saturation in pore space to be ~22% (maximum, 58%) and ~14% (maximum, 58%), respectively (fig. S4 and Supplementary Methods). The relatively low and constant hydrate saturation from ~5 mbsf down to 120 mbsf is consistent with small hydrate grains homogeneously precipitated in muddy sediments throughout the GHSZ (fig. S4 and Supplementary Methods). Relatively constant values of Cl−, δ18OH2O, and δDH2O below ~5 mbsf indicate that the pore fluids below ~5 mbsf consist mainly of the original water from dehydration of clay minerals and that the effect of seawater diffusing from the overlying water column is negligible.
Fig. 2. Chloride concentration and stable isotopic compositions of pore water in sediments of KMV#5.
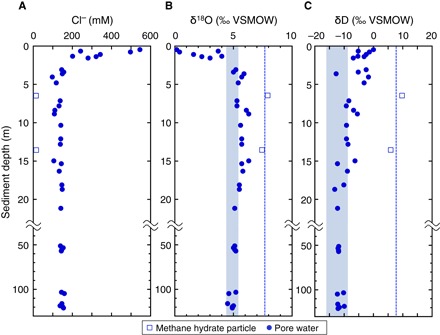
Vertical profile of Cl− (A), δ18O (B), and δD (C) of pore water in sediments. Circle and square plots represent pore water sample and water from dissociated gas hydrate fragment, respectively. Dashed line represents the averaged isotopic value of methane hydrates, and blue-filled range denotes original δ18O and δD values of pore water before the formation of methane hydrates.
Hydrocarbon gases, dissolved inorganic carbon, and sulfate
The SO42− concentrations decrease from ~20 mM near the seafloor to less than 1 mM around 4 mbsf (Fig. 3C and table S1). The measured CH4 concentrations in headspace gas were <1 mM in shallow sediments above 2 mbsf. In the sediments below, CH4 content ranged from 2 to 26 mM (Fig. 3A and table S1). The ratio of methane to ethane concentration (C1/C2) in the headspace gas increased from ~120 near sediment surface to ~500 at 2 mbsf. Below that depth, the C1/C2 ratio ranged from 249 to 1593 (Fig. 4A and table S1). The concentration ratio of ethane to propane (C2/C3) was 2 to 12 (table S1). The carbon isotopic compositions of CH4 (δ13CCH4) increased from ~−20‰ near sediment surface to ~−35‰ at 2 mbsf. In the sediments below, δ13CCH4 values were constant at −34.3 ± 2.3‰. The hydrogen isotopic compositions (δDCH4) were also constant at −186 ± 15‰ (Figs. 3B and 4C). Analyses of the methane isotopologues 12CH4, 13CH4, 12CH3D, and 13CH3D (24, 25) in two Hybrid-PCS samples obtained from 6.5 and 61.5 mbsf returned “clumped” isotopologue (Δ13CH3D) temperatures of °C and °C (95% confidence interval), respectively (Figs. 3B and 4D and table S2).
Fig. 3. Depth profiles of biogeochemical parameters in sediments of KMV#5.
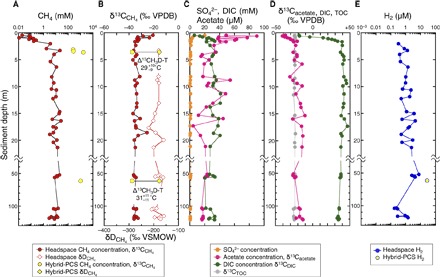
(A) Vertical profiles of CH4 concentrations. (B) δ13C and δD of methane. (C) Concentrations of SO42−, acetate, and dissolved inorganic carbon (DIC). (D) δ13C of acetate, DIC, and total organic carbon (TOC). (E) H2 concentrations. Δ13CH3D temperatures are shown in (B).
Fig. 4. Graphs of stable isotopic gas classifications in sediments of KMV#5.
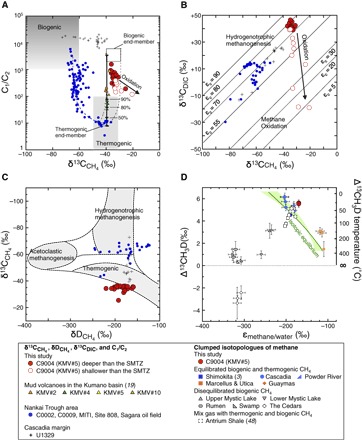
(A) Relationship between C1/C2 and δ13CCH4 with respect to gas source (12) at KMV#5. Black solid line represents the most plausible two–end-member mixing scenario between biogenic and thermogenic hydrocarbons, and the black dashed curves show the possible range based on varying assumptions. Blue dashed curve shows the scenario between the biogenic hydrocarbon with normal δ13CCH4 (−65‰) and thermogenic hydrocarbons. Percentage labels represent contribution of biogenic methane to the total methane. (B) Relationships between δ13CCH4 and δ13CCO2 with isotope fractionation lines (14). (C) Relationships between δ13CCH4 and δDCH4 with respect to gas source (14). In (A) to (C), the data from the other mud volcanoes in the Kumano Basin (19), Nankai Trough area (see Supplementary Methods), and Cascadia margin (27) are plotted. (D) Clumped isotopologues of methane from KMV#5 and other locations (3, 47, 48). Solid green curve represents isotopic equilibrium, with εmethane/water calibration [εmethane/water = (D/H)methane/(D/H)water − 1] given by Horibe and Craig (60). Green shading represents ranges of εmethane/water calibrations from other published studies (47).
The concentration of DIC increased from 6 mM near the seafloor to ca. 35 mM at ~4 mbsf and scattered around 30 to 40 mM below the depth (Fig. 3C and table S1). The δ13C value of DIC (δ13CDIC) increased steeply from −20‰ near the seafloor to +40‰ at ~2 mbsf and decreased slightly to +35‰ from 15 to 125 mbsf (Figs. 3D and 4B and table S1). The high δ13CDIC values at depth are most likely related to isotopic fractionation during microbial CO2 reduction (26). Relative constancy of the DIC concentration with depth suggests either that CO2 reduction occurred below the cored depths or that there may be an additional source of CO2 (perhaps thermogenic) to the migrating fluids (27).
Gas concentrations in samples recovered under in situ pressure
Hybrid-PCS samples obtained from 6.5 and 61.5 mbsf were used for the analysis of in situ gas concentrations on the Chikyu (table S3) (22). The CH4 content in the Hybrid-PCS cores ranged from 1.6 to 11.0 m3-CH4·m−3 (as CH4 amount per sediment volume at the standard temperature and pressure), corresponding to concentrations of 246 to 1705 mM, respectively (806 mM on average; Fig. 3A). Because these concentrations far exceed solubility (<54 mM at 120 mbsf), most CH4 should be present in hydrate form in situ. Given these data, methane hydrate saturation in pore space was calculated to be 2.8 to 22.6% (10.4% on average).
Acetate
The concentrations of acetate in the pore water were high in the top 4 m (up to 90 μM at 0.6 mbsf) relative to those deeper than 4 mbsf and decreased to 10 to 20 μM at 20 mbsf. Below 20 mbsf, the concentrations remained at approximately 20 μM (Fig. 3C and table S1). The vertical acetate concentration profile suggests that it is produced largely at shallow depths in situ. The relatively constant acetate concentrations below ~20 mbsf suggest either well-balanced production and consumption or little biological cycling of acetate at depths below 20 mbsf. The δ13C values of acetate (δ13Cacetate) increase from −41‰ on the seafloor to −22‰ at 4 mbsf, showing a trend similar to the δ13CDIC profile (Fig. 3D). Below 4 mbsf, the δ13Cacetate values (−26‰ to −13‰), which are high compared to the δ13C values of TOC (δ13CTOC, −24.4 ± 0.5‰), suggest the occurrence of fermentative production in the presence of low rates of acetoclastic methanogenesis. This is because the δ13C of acetate derived from fermentation is close to that of TOC, and acetoclastic methanogenesis involves preferential consumption of 12C-acetate, which will enrich 13C in the residual acetate pool (28). Furthermore, the large isotopic difference between DIC and acetate (ca. 58.8 ± 7‰) indicates acetogenic CO2 reduction via the Wood-Ljungdahl pathway as a second possible source of acetate (28). Thermal decomposition of organic matter is the third possible source of acetate. For example, δ13C values of acetic acid in oilfield waters of the San Joaquin Basin in California range from +0.6 to −19.3‰ and are generally higher than those of coproduced oils (29). The deviation between the δ13C values of acetic acid and oil was reported to be larger than 5‰. The δ13Cacetate values higher than δ13CTOC values below 4 mbsf could be attributed to a deep source of acetate.
Hydrogen
H2 concentrations measured onboard were scattered, ranging from 176 to 7760 nM (Fig. 3E and table S1). The gas concentrations of H2 and hydrocarbon gases in the headspace gas that we report should be taken as minimum estimates because of degassing during core recovery and sampling. Despite degassing, the measured H2 concentrations are more than two orders of magnitude higher than concentrations of H2 in pore waters of stratified continental margin sediments (30). A Hybrid-PCS sample at 61.5 mbsf yielded an estimated in situ H2 concentration of 28.1 μM (Fig. 3E and table S3), which is more than three orders of magnitude higher than in typical continental margin sediments (30) but slightly lower than the 1 to 500 μM (49 μM on average) observed in 1500- to 2500-mbsf sediments at Integrated Ocean Drilling Program (IODP) Site C0020 off the Shimokita Peninsula, Japan (3).
Cell counts
The fluorescence image–based analysis of SYBR Green I–stained cells (31) shows that relatively small microbial populations are present throughout the conduit of the intruded mud (Fig. 5A). Cell numbers decrease from 105 cells cm−3 at 2.6 mbsf to 102 cells cm−3 at 5.2 mbsf and then slightly increase again. Below 15 mbsf, cell numbers range from 101 to 103 cells cm−3 (Fig. 5A and table S4). In general, cell abundances in deeper mud volcano sediments are at least three orders of magnitude lower than those observed at similar depths in the surrounding Kumano sedimentary basin (Fig. 5A) and at other locations on continental margins (32). Instead, the cell abundances of deep mud volcano sediments are similar to those observed in the submarine mud volcanoes in the Ryukyu Trench off Tanegashima Island, southern Japan (7), deep sediments associated with lignite coalbeds at ~1.9 to 2.5 km below seafloor (kmbsf) at IODP Site C0020 (3), or the most oligotrophic open ocean sediments of the South Pacific Gyre (1).
Fig. 5. Depth profiles of cell abundance, taxonomic composition of microbial communities, potential activities, and in situ energy yields in sediments of KMV#5.
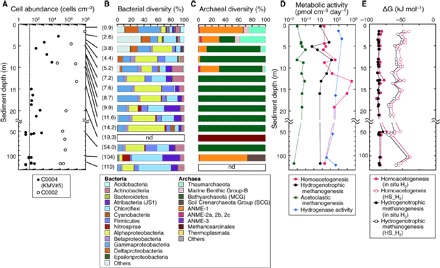
(A) Cell abundance in the mud volcano samples (black dots) and the Kumano Basin sediment at Site C0002 (white dots), approximately 30 km south of KMV#5. The dashed line indicates the minimum quantification limit of sedimentary microbial cells, representing the upper limit of 95% confidence intervals of negative controls. (B and C) Taxonomic compositions of bacterial (B) and archaeal (C) communities in mud volcano sediments based on 16S ribosomal RNA (rRNA) gene sequences. Number in parentheses indicates the sample depth. nd, not detected. (D) Potential activities of homoacetogenesis, hydrogenotrophic methanogenesis, acetoclastic methanogenesis, and hydrogenase assessed by radiotracer incubation experiments. (E) Gibbs free energy yields of homoacetogenesis and hydrogenotrophic methanogenesis under in situ conditions (H2, 28.1 mM) and headspace H2 concentrations.
Taxonomic composition of microbial communities
Among the total (bacterial and archaeal) 16S rRNA gene (16S) sequence reads from all sediment core samples (436,687 reads), almost all 16S sequences detected from deep mud volcano sediments were derived from psychrophilic to mesophilic microbes. The diversity index (Chao-1) of 16S sequence reads showed that the richness of bacterial communities was generally higher than that of archaeal communities, decreased with increasing depth in shallow sediments down to 5.2 mbsf, and was relatively constant in deeper sediments (table S5). Cluster and community network analyses based on the β-diversity also showed that both bacterial and archaeal communities in deeper sediments differed compositionally from those inhabiting shallow sediments above 5.2 mbsf (figs. S5 and S6).
In shallow sediments above 5.2 mbsf, 16S sequences related to Gammaproteobacteria, Deltaproteobacteria (Desulfobacterales-relatives), and the ANME-1 group were detected predominantly, suggestive of the occurrence of AOM consortia (Fig. 5, B and C). Similarly, numbers of 16S sequences for Acidobacteria, Thaumarchaeota (Nitrosopumilus-relatives), and Marine Benthic Group-B [alternatively, Deep-Sea Archaeal Group (DSAG) or “Lokiarchaeota”] decreased with increasing depth. These trends suggest that bacterial and archaeal communities in shallow sediments rely on substrates supplied from the downward diffusing seawater (33).
In deeper sediments, bacterial 16S sequences within Alphaproteobacteria (Sphingomonadales, Rhizobiales), Gammaproteobacteria (Alteromonadales, Pseudomonadales), Betaproteobacteria (Burkholderiales), Chloroflexi, “Atribacteria” (JS1 group), Actinobacteria (OPB41 group), and Firmicutes (Bacillales, Clostridiales) were predominantly detected (Fig. 5B). Archaeal 16S sequences were mostly classified to “Bathyarchaeota” (34, 35), previously designated as the Miscellaneous Crenarchaeotic Group (MCG; Fig. 5C). Archaeal 16S related to Methanosarcinales dominated sediments at 19.3 mbsf (15,892 reads), where only four and one sequence reads were related to Bathyarchaeota and South African Gold Mine Euryarchaeota Group (SAGMEG), respectively. At 104 mbsf, we detected sequences of the Soil Crenarchaeota Group (SCG), ANME-1, and Methanosarcinales-relatives, comprising 26.9, 71.5, and 1.5% in the total 16S read number (20,714 reads), respectively (Fig. 5C).
Potential rates of methanogenesis and acetogenesis
14C-radiotracer incubation analyses showed that the potential activities of homoacetogenesis, hydrogenotrophic methanogenesis, and acetoclastic methanogenesis were 14 to 34,900, 0.6 to 128, and 0.004 to 0.10 pmol cm−3 day−1, respectively (Fig. 5D and table S6). These data indicate that both acetogenesis and methanogenesis via CO2 reduction occur in deep mud volcano sediments, their activities being a few orders of magnitude higher than that of acetoclastic methanogenesis. The potential activities of acetoclastic and hydrogenotrophic methanogenesis are comparable to those measured in the marine sediments at the northern Cascadia margin (36). The activities of methanogenesis and acetogenesis in the shallowest sample are one to two orders of magnitude lower than those below 5 mbsf. The activity of acetogenesis at 13 mbsf is four orders of magnitude higher than that in the shallowest sample. This is consistent with the low activity of methanogenesis and acetogenesis in the sulfate reduction zone in which sulfate reducers outcompete methanogens and acetogens for H2 (2, 30). Co-occurring homoacetogenesis and hydrogenotrophic methanogenesis are thermodynamically feasible given Gibbs free energy yields under in situ conditions of −84.1 ± 2.7 kJ mol−1 and −86.0 ± 1.4 kJ mol−1, respectively (Fig. 5E). Even if the energy yields were calculated by using the (lower) headspace H2 concentrations (ranging from 176 to 7760 nM), the resultant Gibbs free energies of −56.1 ± 9.0 kJ mol−1 for homoacetogenesis and −61.4 ± 9.2 kJ mol−1 for hydrogenotrophic methanogenesis still indicate that the co-occurrence of both metabolic reactions is feasible.
Potential hydrogenase activity
We measured hydrogenase activity in deep mud volcano sediments by incubation with 3H2, ranging from 0.03 to 2.27 μmol H2 cm−3 day−1 [mean = 0.70 ± 0.75 μmol H2 cm−3 day−1 (n = 6); Fig. 5D and table S6]. Such activities are comparable to those previously observed in sediments at the Equatorial Pacific and the Gulf of Mexico continental slope (37). The relatively high values were observed in shallow sediment samples around the sulfate-methane transition zone (SMTZ; see Discussion). The cell-specific hydrogenase activity estimated by dividing the activity value by the respective cell concentration ranged from 1.7 × 10⁻² to 61 nmol H2 cell−1 day−1 (table S6).
Lipid biomarkers
Reflecting the low cell abundance in deep mud volcano sediments, microbial intact polar lipids (IPLs) were only found in relatively low concentrations (<100 ng g−1 of sediment dry weight in most samples; table S7). The IPL contents in deeper mud volcano sediments are at least two orders of magnitude lower than those observed in normal subseafloor sediments at the same depth range (38). Bacterial IPLs were barely detected, and most of the archaeal IPLs were composed of monoglycosidic glycerol-dibiphytanyl-glycerol-tetraethers (GDGTs), possibly because of their high preservation potential (39). Archaeal core lipids representing fossil biomass were generally more abundant than IPLs (39) and consisted of both diethers [or archaeol (AR)] and tetraethers (or GDGTs). Both AR and hydroxylated AR (OH-AR) were detected as major archaeal diether lipids.
H-shaped GDGTs (H-GDGTs) were detected in all samples and were also observed with additional mono-, di-, and trimethylation in the isoprenoidal chain (40). The H-GDGTs are characteristic membrane lipids of thermophilic and hyperthermophilic archaea, including members of the methanogens, Thermococcales and Thermoplasmatales. H-GDGTs are most likely derived from the relict biomolecules of thermophilic communities (see Supplementary Text). Intact ARs were only found in the deepest sample examined (120 mbsf) and composed of phosphatidylglycerol (PG), monoglycosyl (G), and diglycosyl (2G) headgroups, including a PG-OH-AR. The latter IPL is a signature lipid of the Methanosarcinales (41), and correspondingly, PG-OH-AR is a major archaeal IPL in cold seeps dominated by Methanosarcinales-related ANME-2 (42). The detection of PG-OH-AR and other phosphoglycosylated and glycosylated ARs coincided with the highest concentration of core OH-AR and AR, suggesting the presence of an active methanogenic population in deeply buried mud volcano sediments.
Cultivation of methanogens
We tried to cultivate methanogenic communities from six sediment samples from KMV#5 (0.66, 3.99, 12.10, 12.82, 14.97, and 18.10 mbsf; see Supplementary Methods). After cultivation for ~9 months, the growth of spherical cells was observed in cultures only from 12.82 mbsf, resulting in successful pure isolation of the hydrogenotrophic methanogen strain 1H1 (fig. S7, A and B). Phylogenetic analysis of the 16S rRNA gene showed that strain 1H1 is closely related to Methanosarcina mazei (fig. S7E and Supplementary Text). The isolate can grow on H2/CO2, acetate, methanol, dimethylamine, and trimethylamine; however, formate, dimethylsulfide, ethanol, 1-propanol, 2-propanol, cyclopentanol, 1-butanol, and 2-butanol did not support cell growth. The optimum growth temperature of strain 1H1 was at 40°C in the possible range of 2° to 50°C (fig. S7C). While the isolate can grow under the wide range of NaCl concentrations, it preferentially grows under very low salinity conditions (fig. S7D).
DISCUSSION
On the basis of the vertical profiles of CH4 and SO42−, we locate the SMTZ, where most of the methane is consumed by microbial AOM coupled to microbial sulfate reduction, between 1 and 3 mbsf. Other geochemical signals are consistent with an SMTZ at this depth. The shift in δ13C value of CH4 (δ13CCH4) from −35‰ at 2 mbsf to −20‰ at the seafloor (Fig. 3B) is consistent with preferential consumption of 12C-methane during microbial AOM (14). A concomitant drop in the ratio of methane to ethane concentration (C1/C2) in the headspace gas from ~500 at 2 mbsf to 119 at the seafloor (table S1) is also consistent with the consumption of CH4 within the upwelling muds at a depth near 2 mbsf. The decrease of CH4 concentration in conjunction with the increase of δ13CCH4 values from the SMTZ to seafloor, and the constant δ13CCH4 value below the SMTZ, indicates that CH4 was derived from larger depths and consumed by AOM near sediment surface. The consumption of CH4 by AOM is indicated by the low C1/C2 ratios and high δ13CCH4 values, with low δ13CDIC values of the data shallower than the SMTZ (Fig. 4, A and B).
The average δ13C (−34.3 ± 2.3‰) values of methane below the SMTZ are within the typical range of thermogenic methane (Fig. 4A) (12, 14). However, relatively high C1/C2 ratios (249 to 1593) in the headspace gas below the SMTZ compared to the ordinary C1/C2 ratios of thermogenic gas imply either a predominance of biologically produced CH4 or preferential consumption of thermogenic C2+ hydrocarbons (Fig. 4A) (19). The C1/C2 ratios, which are slightly lower than the typical C1/C2 ratios (>1000) of biogenic CH4, and the δ13C values of ethane ranging from −32 to −26‰ indicate a minor contribution of thermogenic hydrocarbons. The C2/C3 ratios are greater than ~1 (table S1), suggesting that C2+ hydrocarbons are predominantly derived from a thermogenic source in which ethane is generally enriched to propane (43). Thermogenic gas here was probably generated from sedimentary organic matter below ~2 kmbsf, where estimated in situ temperatures exceed 80°C (44), and transported with the ascending fluids and muds (see Supplementary Text). When the previously reported data in the Nankai Trough area (fig. S8 and Supplementary Text) and the northern Cascadia margin (27) are plotted, the C1/C2 ratio and the δ13CCH4 at KMV#5 and other mud volcanoes in the Kumano Basin (19) deviate from all possible mixing curves of ordinary biogenic methane with normal δ13CCH4 (~−65‰) and C1/C2 (>1000) and thermogenic gas (δ13CCH4, ~−40‰; C1/C2, ~8) (Fig. 4A). The trend is rather consistent with a biogenic methane end-member that carries a relatively high δ13C value (~−35‰). Such elevated δ13C values and high C1/C2 (>100) are unusual for biogenic gases and, under some isotope-based classification schemes [for example, the study of Whiticar (14)], would be typed as thermogenic methane generated from high-maturity organic-rich shales (45). However, such highly mature shales probably do not occur in the Nankai Trough subduction zone (17, 18). The accretionary prism here is dominated by younger hemipelagic sediments that are quite different from, for example, the old [>100 million years (Ma)] and thick shales found in North America (45) on which the aforementioned interpretive schemes were partially based. As we discuss below, KMV#5 is not the first site where biogenic CH4 containing isotopically heavy (13C-enriched) carbon has been observed in marine sediments.
The isotope separation between δ13CCH4 and δ13CDIC, expressed as the isotope separation factor εc (εc ≈ δ13CDIC − δ13CCH4) (14), was 73.9 ± 3.5‰ below the SMTZ (Fig. 4B). We interpret the large εc to indicate hydrogenotrophic methanogenesis (Fig. 4B) (14). The lighter 12C in DIC is preferentially consumed by microorganisms during hydrogenotrophic methanogenesis, leaving the residual DIC pool enriched in 13C (a process sometimes termed “substrate depletion”) (14, 26). As more DIC converts to CH4, both the accumulated methane and the remaining DIC pools become increasingly 13C-enriched, with CH4 here approaching values of ca. −34‰. Such enrichment of 13C has been observed in other areas in which biological methanogenesis is the dominant source of CH4, including hydrate-bearing sediment at IODP Site U1329 in the northern Cascadia margin (δ13CCH4, up to −39.5‰; δ13CCO2, up to +25.7‰; C1/C2, ~103 to 105) (Fig. 4, A and B) (27) and Tertiary hemipelagic sediments in the Middle America Trench off Guatemala (δ13CCH4, up to −39.0‰; δ13CCO2, up to +27.6‰; C1/C2, ~102 to 105) (46).
The δDCH4 values of the methane in KMV#5 are very constant at ca. −185‰. The difference between δDCH4 (−186 ± 15‰) and δD of the original pore water (−9.2 to −16.2‰) before methane hydrate precipitation is consistent with observed ranges of δD values for biogenic methane in marine sediments [δDCH4 = δDH2O − 160‰ (or 180‰)] (13, 14). In contrast, thermogenic gases produced from a highly mature marine or humic source rock will typically be >−150‰ (13).
On the basis of these relationships between δ13CCH4, δ13CCH4, δ13CDIC, and C1/C2 (Fig. 4), we infer that the hydrocarbon gas in KMV#5 consists of a mixture of gas of biogenic origin (nearly entirely CH4) with a small amount of thermogenic gas. A two–end-member mixing curve between biogenic gas characterized by δ13CCH4 = −39.5 to −29‰ and C1/C2 = 2000 to 6200 and thermogenic gas with δ13CCH4 = −45 to −40‰ and C1/C2 = 8 to 11 (table S8 and Supplementary Text) suggests that biogenic CH4 comprises >90% of the methane (Fig. 4A). Given the in situ methane concentration in the Hybrid-PCS sample at ~806 mM in pore water (~256 mol m−3 in wet sediment; Fig. 4A), we estimate the concentrations of biogenic CH4 and thermogenic CH4 to be ~725 mM (~230 mol m−3) and ~81 mM (26 mol m−3), respectively. Although thermogenic CH4 was estimated to account for less than 10% of total CH4, the concentration of thermogenic CH4 amounting to ~81 mM is substantially higher than the CH4 solubility at in situ condition (44 to 54 mM), suggesting that expulsion of thermogenic CH4 may help drive migration of the fluid and sediment here.
Analyses of methane isotopologues provide additional evidence for a low-temperature, nonthermogenic origin of CH4 in the mud volcano fluids. The ca. 30°C apparent equilibrium temperatures obtained from clumped isotopologue analyses of samples from 6.5 and 61.5 mbsf (Figs. 3B and 4D and table S2) suggest a predominance of methane that has been generated or biogeochemically cycled at relatively low temperatures (≪50°C). Similar Δ13CH3D values as well as δ13CCH4 and δDCH4 values between the two samples suggest that CH4 at 6.5 and 61.5 mbsf have the same origin(s). The Δ13CH3D values and D/H fractionation between CH4 and the original pore water plot close to other biogenic gases from deep sedimentary environments (Fig. 4D) (47). Although the δD values of methane are 20‰ higher than expected for equilibrium, the KMV#5 data points are much closer to equilibrated biogenic gases than to previously reported thermogenic gases. These findings are consistent with generation of methane by microbes at low temperature and low growth rates (47, 48).
We calculate the maximum amount of time required to generate the total biogenic CH4 to be 1.82 Ma, by dividing the in situ biogenic CH4 concentration in the wet sediment (maximum, 398 mol m−3) by the potential hydrogenotrophic methanogenesis rate (minimum, 0.6 pmol cm−3 day−1). This estimated duration does not exceed the age of nannofossils in sediments at KMV#5, which are late Early Miocene to early Middle Miocene (13.6 to 18.2 Ma) (17). The potential activity of hydrogenotrophic methanogenesis at KMV#5 is comparable to those measured at the northern Cascadia margin (36). Because incubations used to determine the potential methane production rate are conducted under high H2 supply, rates of methanogenesis may be even slower in situ than indicated by the incubations. Relatively slow production of biogenic CH4 is compatible with the near attainment of hydrogen isotopic equilibrium between methane and coexisting water at the temperature indicated by the methane isotopologue data (~30°C) (Fig. 4D) (47, 48).
We further estimated the average temperature at which the biogenic CH4 was generated based on (i) the measured Δ13CH3D values, (ii) estimated biogenic fraction to total CH4 (>90%), and (iii) the possible Δ13CH3D temperatures of a thermogenic CH4 end-member (80° to 220°C) (see Supplementary Text). Assuming simple mixing between a single biogenic CH4 end-member (δ13C, −39.5‰; δD, −166‰) and a thermogenic CH4 end-member (δ13C, −40‰; δD, −229‰) (these values are assumed based on the data from Nankai Trough area; see Supplementary Text), we plotted mixing curves between the two end-members, consistent with a Δ13CH3D temperature of 30°C for the CH4 mixture (fig. S9 and Supplementary Methods). The mixing diagram indicates that the Δ13CH3D of the average biogenic component of CH4 is <5.9‰ (>16°C in Δ13CH3D apparent equilibrium temperature). The possible range of the minimum Δ13CH3D temperature for the biogenic CH4 is 13° to 17°C (fig. S9 and Supplementary Methods). On the basis of the in situ temperature profile in KMV#5 and the surrounding sedimentary basin, we suggest that biogenic CH4 has been produced at 300 to 900 mbsf in the forearc basin, where temperatures range from 16° to 30°C (figs. S2 and S9). The minimum depth of the methanogenic zone was estimated to be ~200 to 400 mbsf, depending on the assumed clumped isotope temperature of the biogenic CH4 end-member (13° to 17°C) (fig. S9).
A 3D seismic volume over the study area showed that zones of high pore pressure occur at similar depths in the Kumano Basin along the megasplay fault (Fig. 1C) (18). Because the mud volcanoes in the basin are located along this megasplay fault, these elevated pressure zones were thought to be the source of mud volcanoes (Fig. 1C) (18). Such observations are consistent with the age of the sediments of KMV#5, which are late Early Miocene to early Middle Miocene (17), indicating that the mud is originally derived from the bottom of forearc basin and not from the old accretionary prism. Together, our data indicate that biogenic CH4 production in KMV#5 proceeds slowly in the deeper forearc basin (which sources the intruded mud) and is stimulated to action by a supply of water via the megasplay fault. Note that the pore water in the mud volcano sediments was freshened by the dewatering of clay minerals, which occurred in the old accretionary prism below the forearc basin (fig. S2). Furthermore, a previous study inferred that the fluid in the mud volcanoes was derived from dehydration of sedimentary smectite and basaltic saponite in subducted sediments and basaltic crust (20). Such a deeply sourced low-salinity fluid could conceivably travel upward along the megasplay fault (Fig. 6).
Fig. 6. Schematic figure illustrating methanogenesis in the deep mud volcano sediments associated with fluid migration via the megasplay fault.
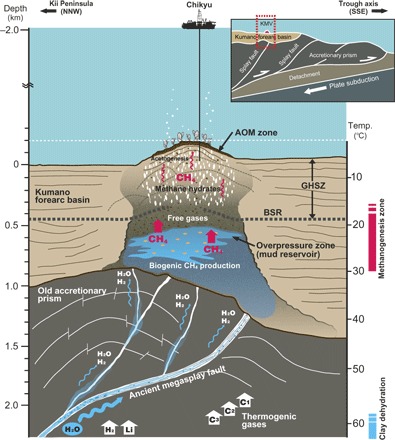
The cross-section is based on seismic profiles (see Fig. 1 and fig. S1).
The high concentration of H2 observed at KMV#5 might be related to the supply of deeply sourced fluid, stimulating methanogenesis and other anaerobic respiratory metabolisms mediated by H2, such as homoacetogenesis. The first use of Hybrid-PCS demonstrated that the in situ H2 concentration in deep mud volcano sediments is three orders of magnitude higher than those previously measured in marine sediment samples (30). However, the origin of H2 is still under debate: In normal marine sediments, microbial H2 production and consumption are closely coupled via interspecies hydrogen transfer in syntrophic relationships, and H2 concentrations are kept at a low level to outcompete other hydrogenotrophic microbes that use terminal electron acceptors, which yield less free energy, while at the same time providing the minimal amount of energy needed to sustain the population (30). However, in KMV#5, the high H2 concentrations suggest that H2 production and consumption are not coupled tightly, that is, a lack of microorganisms using H2 or a supply of H2 exceeding microbial consumption. Considering the total amount of H2 necessary for the large amount of biogenic methane via hydrogenotrophic CO2 reduction, as well as relatively low organic content in the mud volcano sediment and old accretionary prism, it is most likely that contributions of low-biomass communities to the vast H2 production in situ (fermentation) would be much smaller than that of H2 from abiotic processes. Given the geological setting of the Nankai subduction zone, we suggest that the high concentration of H2 is possibly derived from coseismic fault friction and/or water-rock interactions in the old accretionary prism, as is the case with deeply derived lithium (Li) in the same mud volcano fluids (49). It has been experimentally demonstrated that fault friction mechanoradically produces a large amount of H2 (50). Cell-specific hydrogenase activity in the deepest sample (61 nmol H2 cell−1 day−1) was three orders of magnitude higher than both the shallowest sample (1.7 × 10⁻² nmol H2 cell−1 day−1 at 1.5 mbsf; table S6) and the previously reported values (37). The generally high cell-specific hydrogenase activity in deep mud volcano sediments may be due to a high dependence of microbial communities upon deeply sourced H2 as their energy source. The high cell-specific hydrogenase activity, as well as the high potential rates of hydrogenotrophic methanogenesis and homoacetogenesis, suggests that microbial communities in the deep mud volcano biosphere have been stimulated by the geogenic H2 and water in the Nankai accretionary complex.
On the basis of the high potential rate of homoacetogenesis and the relationship of vertical profiles of δ13Cacetate, δ13CTOC, and δ13CDIC, we infer a large contribution of acetate production by homoacetogenesis to the acetate pool at depths shallower than the SMTZ. We infer that the acetate is mainly produced at shallow depths in situ on the basis of the vertical concentration profile of acetate (Fig. 3C). The observed higher potential rate of homoacetogenesis than that of hydrogenotrophic methanogens is peculiar, however, because of the slight thermodynamic preference of hydrogenotrophic methanogenesis over homoacetogenesis throughout the cored depths (Fig. 5E). However, the high potential rate of homoacetogenesis observed by our low-temperature incubation (4°C) is consistent with previous studies that incubated anoxic paddy soil or lake sediment and reported homoacetogenesis outcompeting hydrogenotrophic methanogenesis for H2 at temperatures below 15° to 20°C (51). Considering that the Δ13CH3D temperature data indicate the occurrence of methanogenesis in the deeper forearc basin at a temperature of ~15°C, we speculate that homoacetogenesis predominates in lower temperature horizons, including the cored depths, especially those shallower than ~20 mbsf.
The much lower cell abundances in the deep mud volcano sediments relative to those observed in the Kumano sedimentary basin at the same depths (down to 120 mbsf) (Fig. 5A) suggest that microbes are derived not from the surrounding sediments through which the mud rises but from the original mud reservoir. The mud reservoir, a deeper and older sedimentary realm than the surrounding basin sediments, is presumably more sparsely populated than the shallow basinal sediments. Our DNA and lipid data revealed that relatively small communities occur even in the deeply derived mud volcano sediments. More than 99.9% of the total 16S sequence reads are classified into taxonomic clusters that predominantly involve psychrophilic to mesophilic microbes, suggesting that most microbes are derived from the original mud reservoir in the forearc sedimentary basin. β-diversity analysis shows that both bacterial and archaeal communities in deep sediment samples are compositionally different from those in the shallow sulfate reduction and AOM zones (figs. S5 and S6). This trend indicates that some commonly distributed bacterial members (for example, Sphingomonadales, Atribacteria, and Chloroflexi) are derived potentially from the mud reservoir and that they contribute to carbon cycling in these sediments (Fig. 5B). Archaeal communities in deep mud volcano samples are predominantly composed of Bathyarchaeota (34, 35) and Methanosarcinales-relatives, which are markedly different from shallow communities dominated by ANME-1, Marine Benthic Group-B, and Nitrosopumilus-relatives (Fig. 5C and figs. S5 and S6). The detection of Methanosarcinales-relatives in the deep mud volcano samples is consistent with the detection of intact PG-OH-AR, which is a signature lipid of the Methanosarcinales-related ANME-2 at 120 mbsf. Recent metagenomic studies of Bathyarchaeota show that two genomes contain divergent homologs of the genes necessary for CH4 metabolism, including methyl-coenzyme M reductase (34), and for homoacetogenesis and fermentations (52). The presence of Bathyarchaeota in the mud volcano community suggests that those archaeal members might play some ecological roles in carbon cycling; however, it is currently not known whether the detected Bathyarchaeota are capable of methanogenesis, acetogenesis, or fermentation in the mud reservoir.
In addition to those presumably psychrophilic to mesophilic members that have often been observed in cold to warm subseafloor sediments, the 16S gene library includes sequences of some unexpected members, which may reflect environmental conditions in the mud reservoir or the deeper old accretionary prism. For example, the occurrence of SCG archaea, which have been detected so far mainly in methanogenic low-salinity terrestrial soils (53, 54) and rarely in deep subseafloor sediments, may point to low-salinity conditions in the mud reservoir. This would be consistent with a selection or preferential stimulation of population members that prefer low-salinity conditions for their osmoregulatory functions because of the freshwater supply from clay dehydration. Furthermore, the successful isolation of strain 1H1 [related to M. mazei, which grows at temperatures between 2° and 50°C with optimum growth at 40°C, and under low NaCl concentrations down to 0 g liter−1 (fig. S7 and Supplementary Text)] strongly supports our notion that hydrogenotrophic methanogenesis occurs in the warm, low-salinity environment, as predicted by the pore water chemistry, clumped methane isotopologue, and seismic survey data (Fig. 6).
It is important to discuss here the carbon budget within KMV#5. The CH4 contents in sediments of KMV#5 averaged 6.4 m3 CH4·m−3 with a maximum value of 11 m3 CH4·m−3 at standard temperature and pressure. Such CH4 contents are comparable to values determined by using gas-tight coring at the Haakon Mosby mud volcano in the Norwegian Sea (average of 15 m3 CH4·m−3, maximum of 34 m3 CH4·m−3 as hydrate-bound CH4) (8). In the active Haakon Mosby mud volcano, the temperature gradient is very high, up to 17°C m−1, because of the high flux of warm fluid through a central conduit toward the seafloor. Thus, gas hydrate occurrence is limited to shallow depths below seafloor (1 to 15 mbsf), and the total mass of hydrate-bound CH4 there was estimated to be 102.5 kt, equal to 2 × 10⁸ m3 (8). On the basis of the data obtained from such active mud volcanoes, the total budget of CH4 hydrates stored in submarine mud volcanoes in the world was previously estimated to be ~1010 to 1012 m3 (5). However, the temperature gradient at KMV#5 (29°C km−1) is notably lower than other active submarine mud volcanoes, resulting in a vast and stable cylindrical GHSZ down to 590 m below the summit. We calculated the methane hydrate saturation in pore space to be 2.8 to 22.6% (10.4% in average) by using the data from Hybrid-PCS samples; this is comparable to Haakon Mosby (up to 21.3%) (8). Furthermore, the methane hydrate saturation in pore space is consistent with estimates based on the values of δ18OH2O and δDH2O below ~5 mbsf (14 to 22% on average), indicating that methane hydrates are most likely homogenously present in the conduit of the intruded mud throughout the GHSZ.
If the KMV#5 muddy sediments contain 6.4 m3 CH4·m−3 in situ as measured in Hybrid-PCS samples, then the cylindrical conduit (~1000 m in diameter, 590 m in depth down to the lower boundary of GHSZ) should harbor 3.2 × 10⁹ m3 of CH4. This is one order of magnitude larger than previous estimates of the amount of CH4 in other active submarine mud volcanoes (~108 m3) (5, 8). Given the global distribution of submarine mud volcanoes along the plate convergent margin, we infer that mud volcanoes of the type found in the Kumano Basin are quantitatively more important reservoirs of CH4 than previously thought. As there are at least 10 mud volcanoes whose mud volcanic activity is similar to or less than KMV#5 in this area (17, 19), the total CH4 budget in all submarine mud volcanoes of the Kumano Basin is at least ~1010 m3, which is comparable to the previous minimum estimate of CH4 in submarine mud volcanoes worldwide (5). The global CH4 budget in submarine mud volcanoes is most likely underestimated; if we assume that the total amount/quantity of methane could apply to the global submarine mud volcanoes, then the total budget of methane might be one order of magnitude higher than the previous estimate (~1011 to 1013 m3). Nevertheless, to accurately characterize the CH4 budget and its biogeochemical significance in submarine mud volcanic systems, further systematic investigations at various geologic and oceanographic settings are necessary.
Our results suggest that the previous assessment of “biogenic” versus “thermogenic” based on C1/C2 and δ13CCH4 is not simply applicable to some environments found in complex plate convergent margins. In terrestrial mud volcanoes, the elevated δ13CCH4 values (−46.5‰ on average) and mostly high C1/C2 (>500) have been attributed to a thermogenic source, in which a molecular separation during the gas migration causes high C1/C2 ratios (15). Given this interpretation, the fraction of thermogenic gas in the terrestrial mud volcanoes was estimated to be ~76%. In marked contrast, our results suggest that such elevated δ13CCH4 and C1/C2 values are possibly consistent with biogenic gas. If this is the case for other mud volcanoes, then the contribution of biogenic methane might be significantly larger than previously estimated. Because mud volcanoes are a significant source of radiocarbon-free methane to the atmosphere (6), the contribution of subseafloor microbial activity to global carbon cycling may be larger than has been assumed.
In conclusion, this study provides a comprehensive view of the mechanism of biogenic CH4 production in the deep mud volcano biosphere. Geogenic reactions caused by heat and/or pressure in the landward old accretionary prism provide water through clay dehydration, hydrogen, and other organic substrates to the overlying forearc sedimentary basin, coincidently stimulating in situ microbial activities such as hydrogenotrophic methanogenesis. As a consequence of such geosphere-biosphere interactions, large amounts of biogenic CH4 are stored as methane hydrates in the mud volcano interior or as free gas in the overpressured sedimentary basin. Similar interactions are possibly globally distributed beneath the ocean along the plate convergent margins, and this type of geobiological system could contribute more substantially to the global carbon budget than previously thought.
MATERIALS AND METHODS
Sample collection by scientific ocean drilling
All sediment samples used in this study were obtained at Site C9004 on the summit of KMV#5 in the central Kumano Basin of the Nankai Trough [33°67.581′N, 136°56.8085′E; 1986.7-m water depth (Fig. 1A)]. Shallow sediment samples at Site C9004 were collected using a 4-m piston corer by the research vessel Hakuhomaru during the KH06-04 cruise in 2006. Shallow to deep sediment samples were obtained by using HPCS down to 200 m below the summit during the Japan Agency for Marine-Earth Science and Technology (JAMSTEC) Expeditions 903 and 906 of the drilling vessel Chikyu in 2009 and 2012, respectively. During Expedition 906, in addition to HPCS cores, pressure-conserved sediment cores were recovered by using Hybrid-PCS (22), immediately ice-shocked onboard to prevent temperature increase, and then transferred to the Pressure Core Analysis and Transfer System (PCATS) (Geotek Co. Ltd.) for subsequent gas production tests and geochemical analyses.
During the transfer of the Hybrid-PCS core using PCATS, x-ray CT scanning as well as γ-ray and P-wave velocity measurements were simultaneously conducted. On the basis of the nondestructive physical property data, the core was cut into subsections at the selected point under high-pressure conditions, and then the subsection was transferred to a short aluminum chamber. Gas production tests were conducted using the short high-pressure core samples: Under the controlled depressurization, gas was forced out from the high-pressure chamber, collected by an inverted graduated cylinder in a water column for the volume measurement. A part of the extracted gas was sampled for the compositional analysis. Gas samples for analyses of H2 concentration and clumped isotopes of methane (Δ13CH3D) were collected directly from the depressurized manifold during the production test and then stored in preevacuated glass vials and stainless steel cylinders, respectively.
Measurement of pore water chemistry and gas compositions
All pore water sample acquisition and measurements were carried out in the geochemistry laboratory onboard the Chikyu. In short, Cl− and SO42− concentrations in this study were analyzed by titration and ion chromatography, respectively, according to the IODP standard protocols.
Sediment samples for headspace gas analysis were collected using tip-cut plastic syringes immediately after core recovery. The syringe end was tightly capped with a silicone-rubber stopper on the core-cutting area of the Chikyu, transferred to a glass vial in a N2-flushed glove bag, and then capped with a Teflon-coated rubber septum and aluminum seal for subsequent geochemical analyses. Hydrocarbon compositions in headspace gas and Hybrid-PCS gas samples were measured by using gas chromatography (GC)–flame ionization detector and GC–thermal conductivity detector on the Chikyu. H2 concentrations in headspace gas and Hybrid-PCS samples were measured using a GC–trace reduction gas detector (30) immediately after sampling. The total H2 volume in a Hybrid-PCS sample (core 5P-2 at 61.5 mbsf; table S3) was calculated by multiplying the averaged concentration of two subsamples collected during the production test to the total gas volume in the high-pressure chamber. The H2 concentration in pore water was then calculated by dividing the total H2 volume by pore volume.
Analysis of stable isotopic compositions
δ18OH2O and δH2O were analyzed by laser absorption spectroscopy (Liquid Water Isotope Analyzer, Los Gatos Research), deployed on the Chikyu. DIC concentration and δ13CDIC were measured with a Thermo Finnigan Delta Plus XP isotope ratio mass spectrometer (IRMS) connected to a Flash EA 1112 Automatic Elemental analyzer via a ConFlo III interface (55). The acetate concentration and δ13Cacetate were determined by isotope ratio monitoring–liquid chromatography–mass spectrometry (irm-LC-MS) (Thermo Finnigan Delta Plus XP IRMS connected to LC IsoLink) (28). TOC content and δ13CTOC were determined, after removal of carbonate with HCl, by using a Thermo Finnigan Delta Plus XP IRMS instrument connected to a Flash EA 1112 Automatic Elemental analyzer via a ConFlo III interface. The δ13C values of hydrocarbon gases and δDCH4 were determined via irm-GC-MS (21, 55) (Thermo Finnigan Delta Plus XP IRMS connected to TRACE GC via GC Combustion III) and high-temperature conversion interface, respectively. The Δ13CH3D of methane in Hybrid-PCS gas samples was measured by tunable infrared laser direct absorption spectroscopy (3, 25, 47).
Cell counts
Plugs of 1-cm3 sediment were collected from the innermost part of the cores using sterilized syringes (tips cut off) and then immediately fixed with 2% (w/v) paraformaldehyde for ~12 hours at 4°C, washed twice with phosphate-buffered saline (PBS) buffer, and suspended in PBS-ethanol solution (1:1) at a final dilution volume of 10% (v/v). Cell counts were performed by both manual microscopic observation and image-based cell enumeration techniques using SYBR Green I fluorescent dye (31).
DNA extraction and molecular analysis
All sediment samples used for molecular analyses were immediately frozen at −80°C and then stored in deep freezers before use. DNA was extracted from 10 g of the frozen sample using the PowerMax Soil DNA Isolation Kit (MO BIO Laboratories Inc.) according to the manufacturer’s instructions. Despite the generally low cell abundance in deep mud volcano sediments, bacterial and archaeal 16S fragments were directly obtained by polymerase chain reaction (PCR) without any multiple displacement amplification. To identify the taxonomic composition, we sequenced the V1-V2 and V3-V4 hypervariable regions of bacterial and archaeal 16S genes, respectively, using a GS FLX sequencer. In short, PCR amplification for sequencing was performed using domain-specific primers (EUB27F and EUB338Rmix for Bacteria, and UNIV530F and ARC912R for Archaea) with 454 FLX Titanium adapters A and B and a six-base sample identifier tag (56). No PCR products were obtained from 19.3 and 119 mbsf each for bacterial and archaeal 16S, respectively (Fig. 5, B and C). No PCR amplifications could be seen in all negative control experiments. Detailed methods for taxonomic classification of the sequence reads, data processing for operational taxonomic unit picking, and β-diversity analyses were described in Supplementary Methods.
Activity measurements and thermodynamic calculations
Sediment samples used for activity measurements by incubation with 14C-labeled substrates were collected from whole-round core sections that were immediately cut after core recovery and stored under anoxic conditions flushed with Ar at 4°C until onshore distribution to vials. A sulfate-free mineral solution, in which Cl− was adjusted to 86 mM, was added to make slurries. The headspace was flushed by N2, and H2 concentrations were adjusted to 20 μM in water before 14C-labeled substrates (bicarbonate and acetate, 2 MBq) were added to each vial. After incubation for 130 days at 4°C, the activities associated with hydrogenotrophic and acetoclastic methanogenesis, as well as homoacetogenesis, were measured using modifications of previously described methods (36, 57). The instrument detection limit of the liquid scintillation counting was 0.4 Bq. The method detection limit was determined by the analysis of negative control samples prepared by the autoclave sterilization of sediment samples before the injection of 14C-labeled substrates. Hydrogenotrophic methanogenesis and acetogenesis from the negative control samples with 14C-bicarbonate did not exceed the instrument detection limit (0.4 Bq, equal to 0.0002 pmol cm−3 day−1), and acetoclastic methanogenesis from the negative control with 14C-labeled acetate was 9 Bq (equal to 0.004 pmol cm−3 day−1). Sediment samples used for hydrogenase activity measurement were collected from the core-cutting area using sterilized tip-cut plastic syringes immediately after core recovery. Hydrogenase activity was measured as described previously (37). In short, samples were incubated with a tritium gas headspace, and because of the activity of the hydrogenase enzyme, tritiated water will be produced and its activity can be quantified by liquid scintillation counting.
The Gibbs free energies for homoacetogenesis, hydrogenotrophic methanogenesis, and acetoclastic methanogenesis were calculated on the basis of in situ geochemical and geophysical measurement data [H2 concentration is 28.1 μM, and CH4 concentrations are saturated values (44 to 54 mM)], as described previously (2). We also calculated the energy yield by using the H2 concentration measured by headspace gas, because the in situ H2 concentration analyzed from only one Hybrid-PCS sample was uncertain.
Analysis of lipid biomarkers
Total lipid extracts were obtained from ~20 g of freeze-dried sediments using a modified Bligh and Dyer protocol (38), after adding an internal standard (phosphatidylcholine C21:0/21:0). Analysis of IPLs was performed by high-performance LC electrospray ionization MS (HPLC-ESI-MS). Chromatographic separation was achieved on a Waters Acquity BEH C18 column (58) with a Dionex Ultimate 3000RS UHPLC coupled to a maXis quadrupole time-of-flight mass spectrometer (Bruker Daltonics) equipped with an ESI source. Detection of lipids was performed in positive ionization mode while scanning a mass-to-charge (m/z) range from 150 to 2000. MS2 scans were obtained in data-dependent mode, and for each MS full scan, up to three MS2 experiments, targeting the most abundant ions, were performed. Active exclusion limits the times a given ion is selected for fragmentation (three times every 0.5 min) and thus allowed us to also obtain MS2 data of less abundant ions. Lipid identification was achieved by monitoring exact masses of possible parent ions (present as either H+, NH4+, or Na+ adducts) in combination with characteristic fragmentation patterns (59). Lipid quantification was achieved by comparison of parent ion responses relative to known amounts of an internal standard (58).
Cultivation of mud volcano microbial communities
Batch-type cultivation of microbial communities in KMV#5 was tested using six sediment samples at 20° and 55°C under the anaerobic condition. Strain 1H1 was successfully isolated from the primary enrichment culture obtained from a sample at 12.82 mbsf. The detailed methods for cultivation conditions including the media used, isolation of strain 1H1, taxonomic identification, and physiological characterizations are described in Supplementary Methods.
Supplementary Material
Acknowledgments
We thank all crews, drilling team members, and technical staffs on the deep-sea drilling vessel Chikyu and the research vessel Hakuhomaru for support with core sampling from KMV#5 during JAMSTEC Chikyu Expeditions 903, 906, and KH06-04 cruises. We are also grateful to IODP for providing sediment core samples from Site C0002 during Expedition 315. We are grateful to S. Fukunaga, S. Hashimoto, K. Iijima, A. Imajo, H. Machiyama, Y. Nishio, S. Tanaka, H. Tomiyama, and N. Xiao for useful discussions and/or technical assistance. This is a contribution to the Deep Carbon Observatory. Funding: This study was supported, in part, by the Japan Society for the Promotion of Science (JSPS) Strategic Fund for Strengthening Leading-Edge Research and Development (to JAMSTEC and F.I.), the JSPS Funding Program for Next Generation World-Leading Researchers (GR102 to F.I.), the Grant-in-Aid for Science Research (nos. 23681007, 26287128, and 17H01871 to A.I.; no. 26251041 to F.I.; no. 17H06105 to N.Y.), and the East Asia and Pacific Summer Institutes program through the NSF and JSPS (no. 1308171 to D.H.C.). Lipid analyses by M.Y.Y. and shipboard work by F.S. were financed by the European Research Council under the European Union’s Seventh Framework Programme—“Ideas” Specific Programme (no. 247153 to K.-U.H.). Author contributions: A.I. and F.I. designed the study. F.I. led the project as the chief scientist of JAMSTEC Chikyu Expeditions 903 and 906. Y.K. coordinated Expeditions 903 and 906 as the expedition project manager. A.I., F.I., R.R.A., T.H., Y.M., T. Toki, G.L.A., J.A., D.H.C., T.F., Y.I., H.I., J.K., H.K., K.-i.N., Y.N., M.N., H.R., S.S., F.S., A.T., W.T., T. Terada, H.T., and Y.T.Y. collected and analyzed the sediment core samples and data as shipboard scientists. S.H., S.K., Y.O., S.O., K.T., D.T.W., M.Y.Y., K.-U.H., M.I., M.A.L., S.M., V.J.O., T. Tuji, U.T., and N.Y. analyzed the samples and data as shore-based scientists. A.I. and F.I. cowrote the manuscript. All authors discussed the results and commented on the manuscript. Competing interests: The authors declare that they have no competing interests. Data and materials availability: All data needed to evaluate the conclusions in the paper are present in the paper and/or the Supplementary Materials. The 16S rRNA gene sequences in this study were all deposited in the DNA Data Bank of Japan/European Molecular Biology Laboratory/GenBank nucleotide sequence databases under accession no. DRA001034. The 16S rRNA gene sequence of strain 1H1 was also available under accession no. LC170394. Strain 1H1 has been deposited in the Japan Collection of Microorganisms (JCM 19936). Additional data related to this paper may be requested from the authors.
SUPPLEMENTARY MATERIALS
Supplementary material for this article is available at http://advances.sciencemag.org/cgi/content/full/4/6/eaao4631/DC1
Supplementary Text
Supplementary Methods
fig. S1. Photographs and Raman spectra of methane hydrate and a seismic profile of KMV#5.
fig. S2. Thermal gradient based on the temperatures measured in situ at KMV#5 and IODP site C0009.
fig. S3. Chloride concentrations versus stable isotopic compositions of water.
fig. S4. Depth profile of the estimated methane hydrate saturation in pore space based on δ18O and δD.
fig. S5. Average linkage clustering analysis based on the Bray-Curtis dissimilarity distance of 16S rRNA genes.
fig. S6. Community network analysis based on Spearman’s correlation coefficient.
fig. S7. Characteristics of the isolated methanogenic archaeon strain 1H1.
fig. S8. Chemical and stable isotopic compositions of hydrocarbon gases in the Nankai Trough area.
fig. S9. Mixing curves of Δ13CH3D between biogenic and thermogenic methane end-members consistent with a final clumped isotopologue temperature of 30°C for the resultant mixture.
table S1. Geochemical data from KMV#5 analyzed in this study.
table S2. δ13C-CH4, δD-CH4, and Δ13CH3D temperature of Hybrid-PCS sediment core samples.
table S3. Production test of gasses from Hybrid-PCS sediment core samples.
table S4. Cell concentration in sediment core samples from KMV#5.
table S5. Diversity indices of microbial communities in sediment core samples from KMV#5 based on 16S rRNA gene sequence analysis.
table S6. Activity of methanogenesis, acetogenesis, and hydrogenase based on radiotracer incubation analyses.
table S7. Concentration of archaeal core and IPLs.
table S8. Thermogenic and biogenic end-member values for mixing calculation.
REFERENCES AND NOTES
- 1.D’Hondt S., Inagaki F., Zarikian C. A. A., Abrams L. J., Dubois N., Engelhardt T., Evans H. F., Ferdelman T., Gribsholt B., Harris R. N., Hoppie B. W., Hyun J.-H., Kallmeyer J., Kim J., Lynch J. E., McKinley C. C., Mitsunobu S., Morono Y., Murray R. W., Pockalny R., Sauvage J., Shimono T., Shiraishi F., Smith D. C., Smith-Duque C. E., Spivack A. J., Steinsbu B. O., Suzuki Y., Szpak M., Toffin L., Uramoto G., Yamaguchi Y. T., Zhang G.-l., Zhang X.-H., Ziebis W., Presence of oxygen and aerobic communities from seafloor to basement in deep-sea sediment. Nat. Geosci. 8, 299–304 (2015). [Google Scholar]
- 2.Hoehler T. M., Jørgensen B. B., Microbial life under extreme energy limitation. Nat. Rev. Microbiol. 11, 83–94 (2013). [DOI] [PubMed] [Google Scholar]
- 3.Inagaki F., Hinrichs K.-U., Kubo Y., Bowles M. W., Heuer V. B., Hong W.-L., Hoshino T., Ijiri A., Imachi H., Ito M., Kaneko M., Lever M. A., Lin Y.-S., Methé B. A., Morita S., Morono Y., Tanikawa W., Bihan M., Bowden S. A., Elvert M., Glombitza C., Gross D., Harrington G. J., Hori T., Li K., Limmer D., Liu C.-H., Murayama M., Ohkouchi N., Ono S., Park Y.-S., Phillips S. C., Prieto-Mollar X., Purkey M., Riedinger N., Sanada Y., Sauvage J., Snyder G., Susilawati R., Takano Y., Tasumi E., Terada T., Tomaru H., Trembath-Reichert E., Wang D. T., Yamada Y., Exploring deep microbial life in coal-bearing sediment down to ~2.5 km below the ocean floor. Science 349, 420–424 (2015). [DOI] [PubMed] [Google Scholar]
- 4.Kopf A. J., Significance of mud volcanism. Rev. Geophys. 40, 1005 (2002). [Google Scholar]
- 5.Milkov A. V., Worldwide distribution of submarine mud volcanoes and associated gas hydrates. Mar. Geol. 167, 29–42 (2000). [Google Scholar]
- 6.A. V. Milkov, Global distribution of mud volcanoes and their significance in petroleum exploration as a source of methane in the atmosphere and hydrosphere and as a geohazard, in Mud Volcanoes, Geodynamics and Seismicity. NATO Science Series (Series IV: Earth and Environmental Series), G. Martinelli, B. Panahi, Eds. (Springer, 2005), vol. 51, pp. 29–34. [Google Scholar]
- 7.Hoshino T., Toki T., Ijiri A., Morono Y., Machiyama H., Ashi J., Okamura K., Inagaki F., Atribacteria from the subseafloor sedimentary biosphere disperse to the hydrosphere through submarine mud volcanoes. Front. Microbiol. 8, 1135 (2017). [DOI] [PMC free article] [PubMed] [Google Scholar]
- 8.Pape T., Feseker T., Kasten S., Fischer D., Bohrmann G., Distribution and abundance of gas hydrates in near-surface deposits of the Håkon Mosby Mud Volcano, SW Barents Sea. Geochem. Geophys. Geosyst. 12, Q09009 (2011). [Google Scholar]
- 9.Niemann H., Lösekann T., de Beer D., Elvert M., Nadalig T., Knittel K., Amann R. I., Sauter E. J., Schlüter M., Klages M., Foucher J. P., Boetius A., Novel microbial communities of the Haakon Mosby mud volcano and their role as methane sink. Nature 443, 854–858 (2006). [DOI] [PubMed] [Google Scholar]
- 10.Lazar C. S., Parkes R. J., Cragg B. A., L’Haridon S., Toffin L., Methanogenic activity and diversity in the centre of the Amsterdam Mud Volcano, Eastern Mediterranean Sea. FEMS Microbiol. Ecol. 81, 243–254 (2012). [DOI] [PubMed] [Google Scholar]
- 11.Joye S. B., Samarkin V. A., Orcutt B. N., MacDonald I. R., Hinrichs K.-U., Elvert M., Teske A. P., Lloyd K. G., Lever M. A., Montoya J. P., Meile C. D., Metabolic variability in seafloor brines revealed by carbon and sulphur dynamics. Nat. Geosci. 2, 349–354 (2009). [Google Scholar]
- 12.Bernard B. B., Brooks J. M., Sackett W. M., Natural gas seepage in the Gulf of Mexico. Earth Planet. Sci. Lett. 31, 48–54 (1976). [Google Scholar]
- 13.Schoell M., The hydrogen and carbon isotopic composition of methane from natural gases of various origins. Geochim. Cosmochim. Acta 44, 649–661 (1980). [Google Scholar]
- 14.Whiticar M. J., Carbon and hydrogen isotope systematics of bacterial formation and oxidation of methane. Chem. Geol. 161, 291–314 (1999). [Google Scholar]
- 15.Etiope G., Feyzullayev A., Baciu C. L., Terrestrial methane seeps and mud volcanoes: A global perspective of gas origin. Mar. Pet. Geol. 26, 333–344 (2009). [Google Scholar]
- 16.Dählmann A., de Lange G. J., Fluid–sediment interactions at Eastern Mediterranean mud volcanoes: A stable isotope study from ODP Leg 160. Earth Planet. Sci. Lett. 212, 377–391 (2003). [Google Scholar]
- 17.S. Morita, J. Ashi, K. Aoike, S. Kuramoto, Evolution of Kumano Basin and sources of clastic ejecta and pore fluid in Kumano Mud volcanoes, Eastern Nankai Trough, in Proceedings of the International Symposium on Methane Hydrates and Fluid Flow in Upper Accretionary Prisms (Prism Fluid 2004), Kyoto, Japan, 2004. [Google Scholar]
- 18.Tsuji T., Ashi J., Strasser M., Kimura G., Identification of the static backstop and its influence on the evolution of the accretionary prism in the Nankai Trough. Earth Planet. Sci. Lett. 431, 15–25 (2015). [Google Scholar]
- 19.Pape T., Geprägs P., Hammerschmidt S., Wintersteller P., Wei J., Fleischmann T., Bohrmann G., Kopf A. J., Hydrocarbon seepage and its sources at mud volcanoes of the Kumano forearc basin, Nankai Trough subduction zone. Geochem. Geophys. Geosyst. 15, 2180–2194 (2014). [Google Scholar]
- 20.Menapace W., Völker D., Kaul N., Tryon M. D., Kopf A. J., The role of mud volcanism and deep-seated dewatering processes in the Nankai Trough accretionary prism and Kumano Basin, Japan. Geochem. Geophys. Geosyst. 18, 2486–2509 (2017). [Google Scholar]
- 21.Tsunogai U., Maegawa K., Sato S., Komatsu D. D., Nakagawa F., Toki T., Ashi J., Coseimic massive methane release from a submarine mud volcano. Earth Planet. Sci. Lett. 341–344, 79–85 (2012). [Google Scholar]
- 22.Kubo Y., Mizuguchi Y., Inagaki F., Yamamoto K., A new hybrid pressure-coring system for the drilling vessel Chikyu. Sci. Drill. 17, 37–43 (2014). [Google Scholar]
- 23.You C.-F., Gieskes J. M., Hydrothermal alteration of hemi-pelagic sediments: Experimental evaluation of geochemical processes in shallow subduction zones. Appl. Geochem. 16, 1055–1066 (2001). [Google Scholar]
- 24.Stolper D. A., Lawson M., Davis C. L., Ferreira A. A., Neto E. V. S., Ellis G. S., Lewan M. D., Martini A. M., Tang Y., Schoell M., Schoell M., Sessions A. L., Eiler J. M., Formation temperatures of thermogenic and biogenic methane. Science 344, 1500–1503 (2014). [DOI] [PubMed] [Google Scholar]
- 25.Ono S., Wang D. T., Gruen D. S., Sherwood Lollar B., Zahniser M. S., McManus B. J., Nelson D. D., Measurement of a doubly substituted methane isotopologue, 13CH3D, by tunable infrared laser direct absorption spectroscopy. Anal. Chem. 86, 6487–6494 (2014). [DOI] [PubMed] [Google Scholar]
- 26.G. E. Claypool, I. R. Kaplan, The origin and distribution of methane in marine sediments, in Natural Gases in Marine Sediments, I. R. Kaplan, Ed. (Plenum Press, 1974), pp. 99–139. [Google Scholar]
- 27.Pohlman J. W., Kaneko M., Heuer V. B., Coffin R. B., Whiticar M., Methane sources and production in the northern Cascadia margin gas hydrate system. Earth Planet. Sci. Lett. 287, 504–512 (2009). [Google Scholar]
- 28.Heuer V. B., Pohlman J. W., Torres M. E., Elvert M., Hinrichs K.-U., The stable carbon isotope biogeochemistry of acetate and other dissolved carbon species in deep subseafloor sediments at the northern Cascadia Margin. Geochim. Cosmochim. Acta 73, 3323–3336 (2009). [Google Scholar]
- 29.Franks S. G., Dias R. F., Freeman K. H., Boles J. R., Holba A., Fincannon A. L., Jordan E. D., Carbon isotopic composition of organic acids in oil field waters, San Joaquin Basin, California, USA. Geochim. Cosmochim. Acta 65, 1301–1310 (2001). [Google Scholar]
- 30.Lin Y.-S., Heuer V. B., Goldhammer T., Kellermann M. Y., Zabel M., Hinrichs K.-U., Towards constraining H2 concentration in subseafloor sediment: A proposal for combined analysis by two distinct approaches. Geochim. Cosmochim. Acta 77, 186–201 (2011). [Google Scholar]
- 31.Morono Y., Terada T., Kallmeyer J., Inagaki F., An improved cell separation technique for marine subsurface sediments: Applications for high-throughput analysis using flow cytometry and cell sorting. Environ. Microbiol. 15, 2841–2849 (2013). [DOI] [PMC free article] [PubMed] [Google Scholar]
- 32.Parkes R. J., Cragg B. A., Wellsbury P., Recent studies on bacterial populations and processes in subseafloor sediments: A review. Hydrogeol. J. 8, 11–28 (2000). [Google Scholar]
- 33.Walsh E. A., Kirkpatrick J. B., Rutherford S. D., Smith D. C., Sogin M., D’Hondt S., Bacterial diversity and community composition from seasurface to subseafloor. ISME J. 10, 979–989 (2016). [DOI] [PMC free article] [PubMed] [Google Scholar]
- 34.Evans P. N., Parks D. H., Chadwick G. L., Robbins S. J., Orphan V. J., Golding S. D., Tyson G. W., Methane metabolism in the archaeal phylum Bathyarchaeota revealed by genome-centric metagenomics. Science 350, 434–438 (2015). [DOI] [PubMed] [Google Scholar]
- 35.Meng J., Xu J., Qin D., He Y., Xiao X., Wang F., Genetic and functional properties of uncultivated MCG archaea assessed by metagenome and gene expression analyses. ISME J. 8, 650–659 (2014). [DOI] [PMC free article] [PubMed] [Google Scholar]
- 36.Yoshioka H., Maruyama A., Nakamura T., Higashi Y., Fuse H., Sakata S., Bartlett D. H., Activities and distribution of methanogenic and methane-oxidizing microbes in marine sediments from the Cascadia Margin. Geobiology 8, 223–233 (2010). [DOI] [PubMed] [Google Scholar]
- 37.Adhikari R. R., Glombitza C., Nickel J. C., Anderson C. H., Dunlea A. G., Spivack A. J., Murray R. W., D’Hondt S., Kallmeyer J., Hydrogen utilization potential in subsurface sediments. Front. Microbiol. 7, 8 (2016). [DOI] [PMC free article] [PubMed] [Google Scholar]
- 38.Lipp J. S., Morono Y., Inagaki F., Hinrichs K.-U., Significant contribution of Archaea to extant biomass in marine subsurface sediments. Nature 454, 991–994 (2008). [DOI] [PubMed] [Google Scholar]
- 39.Xie S., Lipp J. S., Wegener G., Ferdelman T. G., Hinrichs K.-U., Turnover of microbial lipids in the deep biosphere and growth of benthic archaeal populations. Proc. Natl. Acad. Sci. U.S.A. 110, 6010–6014 (2013). [DOI] [PMC free article] [PubMed] [Google Scholar]
- 40.Reeves E. P., Yoshinaga M. Y., Pjevac P., Goldenstein N. I., Peplies J., Meyerdierks A., Amann R., Bach W., Hinrichs K.-U., Microbial lipids reveal carbon assimilation patterns on hydrothermal sulfide chimneys. Environ. Microbiol. 16, 3515–3532 (2014). [DOI] [PubMed] [Google Scholar]
- 41.Koga Y., Nakano M., A dendrogram of archaea based on lipid component parts composition and its relationship to rRNA phylogeny. Syst. Appl. Microbiol. 31, 169–182 (2008). [DOI] [PubMed] [Google Scholar]
- 42.Rossel P. E., Elvert M., Ramette A., Boetius A., Hinrichs K.-U., Factors controlling the distribution of anaerobic methanotrophic communities in marine environments: Evidence from intact polar membrane lipids. Geochim. Cosmochim. Acta 75, 164–184 (2011). [Google Scholar]
- 43.B. P. Tissot, D. H. Welte, Petroleum Formation and Occurrence (Springer, 1984). [Google Scholar]
- 44.Hammerschmidt S. B., Wiersberg T., Heuer V. B., Wendt J., Erzinger J., Kopf A., Real-time drilling mud gas monitoring for qualitative evaluation of hydrocarbon gas composition during deep sea drilling in the Nankai Trough Kumano Basin. Geochem. Trans. 15, 15 (2014). [DOI] [PMC free article] [PubMed] [Google Scholar]
- 45.Tilley B., Muehlenbachs K., Isotope reversals and universal stages and trends of gas maturation in sealed, self-contained petroleum systems. Geochim. Cosmochim. Acta 339, 194–204 (2013). [Google Scholar]
- 46.Jenden P. D., Kaplan I. R., Comparison of microbial gases from the Middle America Trench and Scripps Submarine Canyon: Implications for the origin of natural gas. Appl. Geochem. 1, 631–646 (1986). [Google Scholar]
- 47.Wang D. T., Gruen D. S., Sherwood Lollar B., Hinrichs K.-U., Stewart L. C., Holden J. F., Hristov A. N., Pohlman J. W., Morrill P. L., Könneke M., Delwiche K. B., Reeves E. P., Sutcliffe C. N., Ritter D. J., Seewald J. S., McIntosh J. C., Hemond H. F., Kubo M. D., Cardace D., Hoehler T. M., Ono S., Nonequilibrium clumped isotope signals in microbial methane. Science 348, 428–431 (2015). [DOI] [PubMed] [Google Scholar]
- 48.Stolper D. A., Martini A. M., Clog M., Douglas P. M., Shusta S. S., Valentine D. L., Sessions A. L., Eiler J. M., Distinguishing and understanding thermogenic and biogenic sources of methane using multiply substituted isotopologues. Geochim. Cosmochim. Acta 161, 219–247 (2015). [Google Scholar]
- 49.Nishio Y., Ijiri A., Toki T., Morono Y., Tanimizu M., Nagaishi K., Inagaki F., Origins of lithium in submarine mud volcano fluid in the Nankai accretionary wedge. Earth Planet. Sci. Lett. 414, 144–155 (2015). [Google Scholar]
- 50.Hirose T., Kawagucci S., Suzuki K., Mechanoradical H2 generation during simulated faulting: Implications for an earthquake-driven subsurface biosphere. Geophys. Res. Lett. 38, L1703 (2011). [Google Scholar]
- 51.Conrad R., Bak F., Seitz H. J., Thebrath B., Mayer H. P., Schütz H., Hydrogen turnover by psychrotrophic homoacetogenic and mesophilic methanogenic bacteria in anoxic paddy soil and lake sediment. FEMS Microbiol. Ecol. 5, 285–293 (1989). [Google Scholar]
- 52.He Y., Li M., Perumal V., Feng X., Fang J., Xie J., Sievert S. M., Wang F., Genomic and enzymatic evidence for acetogenesis among multiple lineages of the archaeal phylum Bathyarchaeota widespread in marine sediments. Nat. Microbiol. 1, 16035 (2016). [DOI] [PubMed] [Google Scholar]
- 53.Jurgens G., Lindström K., Saano A., Novel group within the kingdom Crenarchaeota from boreal forest soil. Appl. Environ. Microbiol. 63, 803–805 (1997). [DOI] [PMC free article] [PubMed] [Google Scholar]
- 54.Kasai Y., Takahata Y., Hoaki T., Watanabe K., Physiological and molecular characterization of a microbial community established in unsaturated, petroleum-contaminated soil. Environ. Microbiol. 7, 806–818 (2005). [DOI] [PubMed] [Google Scholar]
- 55.Toki T., Uehara Y., Kinjo K., Ijiri A., Tsunogai U., Tomaru H., Ashi J., Methane production and accumulation in the Nankai accretionary prism: Results from IODP Expeditions 315 and 316. Geochem. J. 46, 89–106 (2012). [Google Scholar]
- 56.Hoshino T., Morono Y., Terada T., Imachi H., Ferdelman T. G., Inagaki F., Comparative study of subseafloor microbial community structures in deeply buried coral fossils and sediment matrices from the Challenger Mound in the Porcupine Seabight. Front. Microbiol. 2, 231 (2011). [DOI] [PMC free article] [PubMed] [Google Scholar]
- 57.Chapelle F. H., Bradley P. M., Microbial acetogenesis as a source of organic acids in ancient Atlantic Coastal Plain sediments. Geology 24, 925–928 (1996). [Google Scholar]
- 58.Wörmer L., Lipp J. S., Schröder J., Hinrichs K.-U., Application of two new LC–ESI–MS methods for improved detection of intact polar lipids (IPLs) in environmental samples. Org. Geochem. 59, 10–21 (2013). [Google Scholar]
- 59.Yoshinaga M. Y., Kellermann M. Y., Rossel P. E., Schubotz F., Lipp J. S., Hinrichs K.-U., Systematic fragmentation patterns of archaeal intact polar lipids by high-performance liquid chromatography/electrospray ionization ion-trap mass spectrometry. Rapid Commun. Mass Spectrom. 25, 3563–3574 (2011). [DOI] [PubMed] [Google Scholar]
- 60.Horibe Y., Craig H., D/H fractionation in the system methane-hydrogen-water. Geochim. Cosmochim. Acta 59, 5209–5217 (1995). [Google Scholar]
- 61.Morii H., Eguchi T., Nishihara M., Kakinuma K., König H., Koga Y., A novel ether core lipid with H-shaped C80-isoprenoid hydrocarbon chain from the hyperthermophilic methanogen Methanothermus fervidus. Biochim. Biophys. Acta 1390, 339–345 (1998). [DOI] [PubMed] [Google Scholar]
- 62.Sugai A., Uda I., Itoh Y. H., Itoh T., The core lipid composition of the 17 strains of hyperthermophilic archaea, Thermococcales. J. Oleo Sci. 53, 41–44 (2004). [Google Scholar]
- 63.Macalady J. L., Vestling M. M., Baumler D., Boekeldeide N., Kaspar C. W., Banfield J. F., Tetraether-linked membrane monolayers in Ferroplasma spp: A key to survival in acid. Extremophiles 8, 411–419 (2004). [DOI] [PubMed] [Google Scholar]
- 64.U. Berner, E. Faber, Light hydrocarbons in sediments of the Nankai accretionary prism (Leg 131, Site 808), in Proceedings of the Ocean Drilling Program, Scientific Results, I. A. Hill, A. Taira, J. V. Firth, Eds. (Ocean Drilling Program, 1993), pp. 185–195. [Google Scholar]
- 65.A. Waseda, T. Uchida, Origin and migration of methane in gas hydrate-bearing sediments in the Nankai Trough, in The Geochemical Society Special Publications 9, R. J. Hill, J. Leventhal, Z. Aizenshtat, M. J. Baedecker, G. Claypool, R. Eganhouse, M. Goldhaber, K. Peters, Eds. (Elsevier, 2004), pp. 377–387. [Google Scholar]
- 66.Toki T., Gamo T., Tsunogai U., Origins of hydrocarbons in the Sagara oil field, central Japan. Isl. Arc 15, 285–291 (2006). [Google Scholar]
- 67.Quigley T. M., Mackenzie A. S., The temperatures of oil and gas formation in the sub-surface. Nature 333, 549–552 (1988). [Google Scholar]
- 68.Tomaru H., Matsumoto R., Lu H., Uchida T., Geochemical process of gas hydrate formation in the Nankai Trough based on chloride and isotopic anomalies in interstitial water. Resour. Geol. 54, 45–51 (2004). [Google Scholar]
- 69.Maekawa T., Experimental study on isotopic fractionation in water during gas hydrate formation. Geochem. J. 138, 129–138 (2004). [Google Scholar]
- 70.Y. F. Makogon, Hydrates of Hydrocarbons (PennWell Publishing Company, 1997). [Google Scholar]
- 71.M. A. Lever, thesis, University of North Carolina (2008). [Google Scholar]
- 72.Takai K., Inoue A., Horikoshi K., Thermaerobacter marianensis gen. nov., sp. nov., an aerobic extremely thermophilic marine bacterium from the 11,000 m deep Mariana Trench. Int. J. Syst. Bacteriol. 49, 619–628 (1998). [DOI] [PubMed] [Google Scholar]
- 73.Sakai S., Imachi H., Hanada H., Ohashi A., Harada H., Kamagata Y., Methanocella paludicola gen. nov., sp. nov., a methane-producing archaeon that is the first isolate of the lineage ‘Rice Cluster I’, and proposal of the new archaeal order Methanocellales ord. nov. Int. J. Syst. Evol. Microbiol. 58, 929–936 (2008). [DOI] [PubMed] [Google Scholar]
- 74.R. Westram, K. Bader, E. Pruesse, Y. Kumar, H. Meier, F. O. Glöckner, W. Ludwig, ARB: A software environment for sequence data, in Handbook of Molecular Microbial Ecology I: Metagenomics and Complementary Approaches, F. J. de Bruijn, Ed. (John Wiley & Sons, 2011), pp 399–406. [Google Scholar]
- 75.Kumar S., Stecher G., Tamura K., MEGA7: Molecular evolutionary genetics analysis version 7.0 for bigger datasets. Mol. Biol. Evol. 33, 1870–1874 (2016). [DOI] [PMC free article] [PubMed] [Google Scholar]
- 76.Douglas P. M. J., Stolper D. A., Smith D. A., Walter Anthony K. M., Paull C. K., Dallimore S., Wik M., Crill P. M., Winterdahl M., Eiler J. M., Sessions A. L., Diverse origins of Arctic and Subarctic methane point source emissions identified with multiply-substituted isotopologues. Geochim. Cosmochim. Acta 188, 163–188 (2016). [Google Scholar]
- 77.D. Saffer, L. McNeill, T. Byrne, E. Araki, S. Toczko, N. Eguchi, K. Takahashi, Expedition 319 Scientists, in Proceedings of the Integrated Ocean Drilling Program Volume 319 (Integrated Ocean Drilling Program Management International Inc., 2010).
- 78.Harris R., Yamano M., Kinoshita M., Spinelli G., Hamamoto H., Ashi J., A synthesis of heat flow determinations and thermal modeling along the Nankai Trough, Japan. J. Geophys. Res. Solid Earth 118, 2687–2702 (2013). [Google Scholar]
- 79.Wiersberg T., Schleicher A. M., Horiguchi K., Doan M.-L., Eguchi N., Erzinger J., Origin and in situ concentrations of hydrocarbons in the Kumano forearc basin from drilling mud gas monitoring during IODP NanTroSEIZE Exp. 319. Appl. Geochem. 61, 206–216 (2015). [Google Scholar]
Associated Data
This section collects any data citations, data availability statements, or supplementary materials included in this article.
Supplementary Materials
Supplementary material for this article is available at http://advances.sciencemag.org/cgi/content/full/4/6/eaao4631/DC1
Supplementary Text
Supplementary Methods
fig. S1. Photographs and Raman spectra of methane hydrate and a seismic profile of KMV#5.
fig. S2. Thermal gradient based on the temperatures measured in situ at KMV#5 and IODP site C0009.
fig. S3. Chloride concentrations versus stable isotopic compositions of water.
fig. S4. Depth profile of the estimated methane hydrate saturation in pore space based on δ18O and δD.
fig. S5. Average linkage clustering analysis based on the Bray-Curtis dissimilarity distance of 16S rRNA genes.
fig. S6. Community network analysis based on Spearman’s correlation coefficient.
fig. S7. Characteristics of the isolated methanogenic archaeon strain 1H1.
fig. S8. Chemical and stable isotopic compositions of hydrocarbon gases in the Nankai Trough area.
fig. S9. Mixing curves of Δ13CH3D between biogenic and thermogenic methane end-members consistent with a final clumped isotopologue temperature of 30°C for the resultant mixture.
table S1. Geochemical data from KMV#5 analyzed in this study.
table S2. δ13C-CH4, δD-CH4, and Δ13CH3D temperature of Hybrid-PCS sediment core samples.
table S3. Production test of gasses from Hybrid-PCS sediment core samples.
table S4. Cell concentration in sediment core samples from KMV#5.
table S5. Diversity indices of microbial communities in sediment core samples from KMV#5 based on 16S rRNA gene sequence analysis.
table S6. Activity of methanogenesis, acetogenesis, and hydrogenase based on radiotracer incubation analyses.
table S7. Concentration of archaeal core and IPLs.
table S8. Thermogenic and biogenic end-member values for mixing calculation.