Abstract
Variation in genome content is a potent mechanism of microbial adaptation. The genomes of members of the cyanobacterial genus Acaryochloris vary greatly in gene content as a consequence of the idiosyncratic retention of both recent gene duplicates and plasmid-encoded genes acquired by horizontal transfer. For example, the genome of Acaryochloris strain MBIC11017, which was isolated from an iron-limited environment, is enriched in duplicated and novel genes involved in iron assimilation. Here, we took an integrative approach to characterize the adaptation of Acaryochloris MBIC11017 to low environmental iron availability and the relative contributions of the expression of duplicated versus novel genes. We observed that Acaryochloris MBIC11017 grew faster and to a higher yield in the presence of nanomolar concentrations of iron than did a closely related strain. These differences were associated with both a higher rate of iron assimilation and a greater abundance of iron assimilation transcripts. However, recently duplicated genes contributed little to increased transcript dosage; rather, the maintenance of these duplicates in the MBIC11017 genome is likely due to the sharing of ancestral dosage by expression reduction. Instead, novel, horizontally transferred genes are responsible for the differences in transcript abundance. The study provides insights on the mechanisms of adaptive genome evolution and gene expression in Acaryochloris.
Keywords: gene duplication, horizontal gene transfer, expression reduction, positive dosage, adaptation
Introduction
The evolution of gene dosage (i.e., gene transcript abundance) is an important mechanism of adaptation in populations of microorganisms. Gene dosage may be affected by changes in transcriptional regulation or by processes that result in gene copy number variation (CNV) within a genome, including gene duplication (Andersson and Hughes 2009; Kondrashov 2012) and horizontal gene transfer (HGT; Ochman et al. 2000). Although the role of the acquisition of novel genes by HGT (i.e., the flexible genome) for microbial adaptation to environmental change is well-known (Lawrence and Ochman 1998; Ochman et al. 2000; Schönknecht et al. 2013), there is only limited evidence of duplication driving adaptation in nature (Triglia et al. 1991; Musher et al. 2002; Duraisingh and Cowman 2005). This may in part reflect a difficulty of detection due to the transient nature of many gene duplicates in microorganisms, which may be rapidly deleted from the genome upon the relaxation of selection during laboratory study (Sandegren and Andersson 2009). By contrast, experimental evolution studies of microbial populations suggest a key role for gene duplication during the adaptation to novel environments (Kondrashov 2012). This includes adaptation to antibiotics (reviewed by Sandegren and Andersson 2009), nutrient limitation (Cairns and Foster 1991; Brown et al. 1998; Reams and Neidle 2003; Gresham et al. 2008), temperature stress (Riehle et al. 2001; James et al. 2008) and heavy metal exposure (von Rozycki and Nies 2009; Yang et al. 2010; Chow et al. 2012). As a result, the relative contributions of both duplication and HGT mechanisms within the same genome during adaptation are not clear.
Members of the cyanobacterial genus Acaryochloris provide an excellent system to investigate this issue. The genomes of these bacteria, which are unique in their use of the far-red light (>700 nm) absorbing Chlorophyll d (Chl d) as the major pigment in photosynthesis (Miyashita et al. 1996), have an extraordinarily large number of recent gene duplicates compared with other bacterial genomes (Miller et al. 2011). Acaryochloris genomes also contain multiple plasmids (Swingley et al. 2008; unpublished data), and gene content on these plasmids varies greatly among strains due to their different histories of horizontal acquisition and gene loss (Miller et al. 2011).
Although gene duplication in Acaryochloris appears to be a generally non-adaptive process, with most duplicates purged from the genome relatively quickly (Miller et al. 2011), some retained duplicates are potentially beneficial in their local environments. For example, the genome of Acaryochloris strain MBIC11017, which was isolated from the iron-limited western Pacific Ocean (Miyashita et al. 1996), contains multiple duplicated genes that contribute to different aspects of iron assimilation, including the production of low molecular weight, iron-chelating compounds (siderophores), siderophore transport and transcriptional regulation (Miller et al. 2011; fig. 1). The MBIC11017 genome also contains novel iron assimilation genes that are not found in the genome of Acaryochloris strain CCMEE 5410 (Miller et al. 2011), which was isolated from the iron-replete Salton Sea (Miller et al. 2005). This includes a gene cluster involved in siderophore synthesis (Jeanjean et al. 2008; fig. 1).
Fig. 1.—
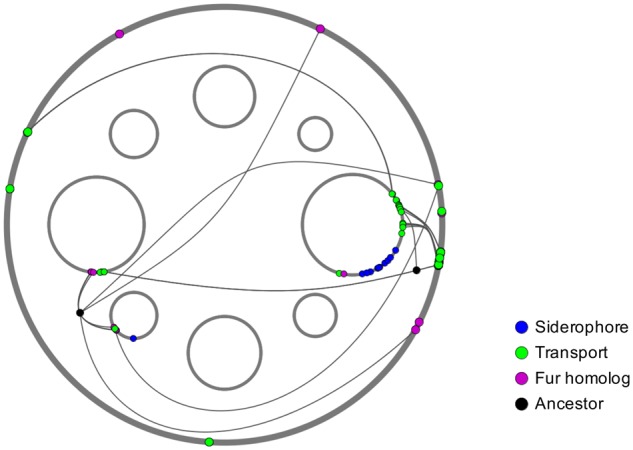
The Acaryochloris strain MBIC11017 genome, showing the chromosome (outer circle; 6.5 Mbp) and eight plasmids ranging in size from 121 to 374 kbp (inner circles, 4× scale compared with chromosome; a ninth, 2.1 kbp plasmid is not shown). Duplicated and novel iron-assimilation genes are color-coded by function, with gene duplicates connected by lines. The chromosomal copy of a duplicate pair typically has an ortholog on the Acaryochloris strain CCMEE 5410 genome and may be considered the parental copy (Miller et al. 2011).
Here, we show that MBIC11017 exhibits a faster growth rate and higher cell yield at low iron availability than CCMEE 5410, as well as a higher rate of iron assimilation. We next address whether enhanced fitness of MBIC11017 under low iron was associated with increased transcript abundance of duplicated and/or novel iron assimilation genes. We find that novel genes acquired by horizontal transfer are largely responsible for the differences between strains in iron assimilation gene transcript abundance, whereas duplicated genes are principally retained by expression reduction rather than by positive dosage effects.
Materials and Methods
Culture Conditions
All cultures of Acaryochloris strains MBIC11017 and CCMEE 5410 were grown at 30°C with constant shaking at 100 rpm and constant illumination of 13–18 µmol photons m−2 s−1 cool white fluorescent light. Cultures were either grown in 100 ml media in 250 ml Erlenmeyer flasks or in 600 ml media in 1 l Erlenmeyer flasks. Two types of media were used, one for the high iron condition and one for the low iron condition (Swingley media and Swingley0, respectively). Swingley media was prepared as previously described (Swingley et al. 2005, where it was referred to as FeMBG-11). Swingley0 was prepared as for Swingley media, except for the exclusion of ferric ammonium citrate and EDTA iron(III) sodium salt. Ferric iron content in Swingley media is 51 µM and 7.7 nM in Swingley0. In order to minimize iron contamination, all media was prepared using MilliQ filtered water in polycarbonate culture flasks that had been soaked overnight in 1 N HCl.
Growth Experiments
Growth was measured as the increase in culture optical density at 750 nm (OD750) with a Beckman Coulter DU 530 spectrophotometer (Indianapolis, IN). A regression of optical density and cell count for both Acaryochloris strains was produced in order to normalize results to cell count and cell volume (MBIC11017 cells are smaller than CCMEE 5410, with approximate diameters of 1.75 and 2.75 µm, respectively). We performed cell counts with a hemocytometer and took OD750 readings for a dilution series of cell cultures in mid-exponential phase. Between 12 and 14 counts were used for each strain. Cell count was then regressed on OD750. The regressions, which had R2 values of 0.91 for MBIC11017 and 0.97 for CCMEE 5410, were used to estimate cell density from optical density in subsequent experiments.
For each strain, triplicate independent cultures derived from the same inoculum were grown in Swingley and Swingley0 media. Media were prepared as described above using 250 ml polycarbonate flasks with a final volume of 100 ml. Approximately 1 × 10⁶ stationary phase cells from stocks maintained in Swingley0 medium were used to inoculate each flask. Growth was measured by taking OD750 readings every 24–48 h. Generation time (G) was estimated from the exponential growth phase of the culture, as determined by plotting the growth data on a semi-log plot, finding time intervals where cultures were exponentially growing and applying the following formula:
T0 and Tfare the first and last time points spanning the exponential growth phase. OD0 and ODf are the OD750 readings corresponding to T0 and Tf.
Final yield was estimated by using the final OD750 reading from the growth experiment. To determine the effect of strain and condition (i.e., Swingley vs. Swingley0 media) on final yield, the data were inverse transformed and fit to a linear model.
Iron Addition Experiment
Approximately 6 × 10⁶ cells from stocks growing in Swingley0 were inoculated into each of five flasks containing 600 ml Swingley0 media and grown as above (supplementary fig. S1, Supplementary Material online). Once the cultures had been in stationary phase for 7 days, cells were harvested for RNA extraction, intracellular iron analysis, and Chl d extraction, along with an OD750 reading (referred to as t0). After collecting data for t0, culture flasks were supplemented with EDTA iron(III) sodium salt (28 µM) and ferric ammonium citrate (23 µM) to attain the iron content of Swingley media (Swingley et al. 2005). At 12, 24, and 36 h after iron addition (t12, t24, t36), an OD750 reading was taken and samples were collected for intracellular iron analyses. Cells were also collected for RNA isolation at t36.
Intracellular Iron Collection, Digestion, and Analysis
To determine intracellular iron content, 10 ml of culture from each sample was filtered onto 0.6 µm pore size polycarbonate membrane filters (MILLIPORE product DTTP02500; Burlington, MA). Filters were inserted into 2 ml screw-top microcentrifuge tubes, and 1 ml of 5 mM EDTA pH 7.8 was added. Tubes were vortexed until cells were resusupended in the solution, and filters were then removed with a toothpick. Samples were next centrifuged for 10 min at 16,000 × g to pellet cells, and the supernatant was aspirated. This process was then repeated with 1 ml sterile Swingley0 media. Cell pellets were stored at −20°C until chemically digested for iron content analysis using optical emission spectroscopy.
A modified protocol of EPA method 3050B was used to digest cell pellets for iron content analysis (Environmental Protection Agency). Millipore water and 70% TraceMetal Grade nitric acid (Fisher Scientific, Hampton NH) were added in a 1:1 ratio to microcentrifuge tubes containing cell pellets to a final volume of 1 ml. The tubes were then vortexed to resuspend the pellet and incubated at 85°C for 4 h. Samples were removed from heat and allowed to cool. Once cool, 150 µl of a 30% solution of hydrogen peroxide were added to all samples, which were then incubated for 30 min at 60–70°C. Digestions were added to 19 ml of a 2% nitric acid solution for a final acid concentration of approximately 4.4% and a final volume of approximately 20 ml. Optical emission spectroscopy was performed on each sample by The University of Montana’s Environmental Biogeochemistry Laboratory to determine the amount of iron per milliliter of culture, which was then normalized to Acaryochloris biomass.
To account for any iron precipitation, blank controls were used. At t0, prior to iron addition, no iron was detected in the blank control. Iron concentrations in blanked samples after iron was supplemented were not negligible and varied approximately 2-fold. This variation was not meaningful as it is likely the result of accidental aspiration of precipitated iron. Consequently, the iron concentration of all blank samples were averaged and subtracted from all estimates of iron concentration for samples collected after iron addition (t12, t24, t36).
Cell collection for RNA-seq
Both strains were grown under three environmental conditions for RNA-seq analysis (supplementary fig. S2, Supplementary Material online): during exponential growth in low iron media, stationary phase (t0 of the iron addition experiment above), and following iron addition (t36 of the iron addition experiment above). For all conditions, there were five independently grown replicate cultures for each strain. For the exponential growth condition, both strains were grown to mid-exponential phase in Swingley0 media. 200 ml of cell culture from each sample were collected for RNA isolation. Cell collection was carried out via vacuum filtration onto 1.2 µm pore size polycarbonate membrane filters (MILLIPORE product RTTP04700). Using sterilized forceps, filters with cells were carefully inserted into 15 ml FalconTM tubes (Corning Inc., Corning, NY). Tubes containing cells on filters were immediately flash frozen in liquid nitrogen and stored at −80°C until RNA extraction.
RNA Extraction
RNA was isolated by guanidiumthiocyanate-phenol-chloroform extraction with PGTX extraction buffer. PGTX buffer was prepared as described by Pinto et al. (2009). The extraction protocol used is a combination of the “PGTX 95” protocol outlined in Pinto et al. (2009) and the Qiagen RNeasy Mini Handbook with modifications. FalconTM tubes containing cells on polycarbonate filters were removed from the −80°C freezer and 2 ml warmed PGTX reagent was added. Samples were vortexed to resuspend cells and incubated for 5 min at 95°C with occasional vortexing. Samples were then immediately incubated on ice for 5 min following removal of filters with sterile pipette tips. Next, 400 µl chloroform was added, and samples were incubated for 10 min at room temperature with occasional vortexing. Phase separation was then facilitated by centrifugation for 15 min at 4°C and 12,000 × g. The aqueous layer was transferred to a new tube, and an equal volume of chloroform was added. Again, extractions were incubated at room temperature for 10 min with occasional vortexing and centrifuged for 15 min at 4°C and 12,000 × g. To precipitate RNA, the aqueous layer was transferred to a new tube, 1/10 volume 3 M sodium acetate at pH 5.2 and 2.5 volume 100% ice cold ethanol were added. Tubes were mixed by inversion and precipitated overnight at −20°C.
The following day, samples were briefly chilled to −80°C and centrifuged 20 min at 4°C and 12,000 × g to pellet RNA. The supernatant was aspirated, and pellets were washed by resuspension in 1 ml 75% ethanol, and then pelleted again by centrifugation for 10 min at 4°C and 12,000 × g. This process was repeated, and then samples were cleaned according to the Qiagen RNeasy Mini RNA Cleanup protocol, including a DNase step. RNA pellets were resuspended in 100 µl RNase-free water, and 10 µl β-mercaptoethanol was added to 1 mL buffer RLT to further inhibit RNases. Finally, samples were eluted twice with 35 µl fresh RNase-free water and stored at −80°C. To check for genomic DNA contamination, 25 rounds of PCR using isiA primers was performed; following a second DNase treatment, there was no amplification in any of the RNA samples. Samples were eluted twice with 25 µl fresh RNase-free water. A small aliquot from each sample was taken for quality control and quantification and was stored at −80°C.
RNA QA/QC, Quantification, Sequencing, and Data Analysis
Fragment analysis of RNA was performed on an Agilent Technologies (Santa Clara, CA) TapeStation using an RNA ScreenTape. RIN values for the samples ranged from 6.4 to 8.2. RNA was quantified using a Qubit2.0 Fluorometer (Thermo Fisher Scientific, Waltham, MA) with the Broad Range RNA Assay Kit. RNA was sent to the Washington State University, Spokane Genomics Core for library prep with TruSeq Stranded Total with Ribo-zero (Illumina, San Diego, CA) and 50-bp single read sequencing on an Illumina HiSeq-2500.
Analysis of adapter-trimmed Illumina reads was performed using a Galaxy server (Afgan et al. 2016) maintained by the University of Montana Genomics Core Laboratory. FASTQC (Andrews 2010) was used to verify sequence quality. Reads for both Acaryochloris species were mapped to their respective genome assemblies (CCMEE 5410: accession GCA_000238775.2; MBIC11017: accession GCA_000018105.1) using Bowtie2 (Langmead and Salzberg 2012). The resulting sorted BAM files were analyzed using HT-seq Count (Anders et al. 2015) and DESeq2 (Love et al. 2014) to count the number of transcripts and perform differential expression analysis, respectively. Mapped reads were assembled using reference GFF annotations.
Results and Discussion
Acaryochloris MBIC11017 Grows Faster and to a Higher Yield than Acaryochloris CCMEE 5410 at Low Iron Concentration
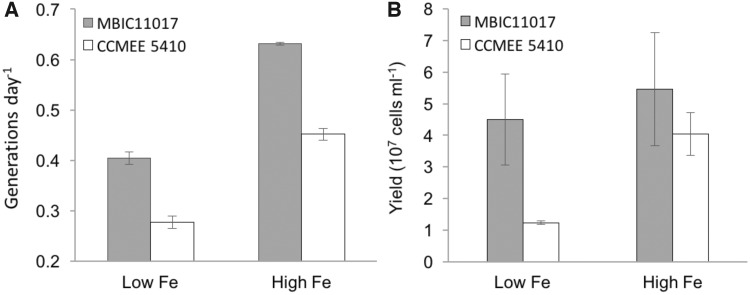
To test whether MBIC11017 is better adapted to low-iron environments than CCMEE 5410, we assayed growth rate and cell yield for both strains in media containing either low (7.7 nM) or high (51 µM) concentrations of iron. MBIC11017 grew significantly faster than CCMEE 5410 under both high and low iron conditions (fig. 2A;F(1, 8) = 203.01, P < 0.0001 for the effect of strain in a two-way ANOVA). The difference in cell size between strains likely contributes to these growth rate differences: MBIC11017 is smaller than CCMEE 5410 and thus has a higher surface area to volume ratio, which is negatively correlated with bacterial generation time (Banse 1976; Foy 1980). Although strain yields were not statistically different under high iron (P = 0.99), MBIC11017 grew to a significantly and substantially greater final yield than CCMEE 5410 under low iron (fig. 2B;P < 0.001 by Tukey HSD; F(1, 8) = 19.68 and P = 0.002 for the strain × iron interaction). We conclude that MBIC11017 is better than CCMEE 5410 at scavenging low concentrations of iron in the environment. Further, the statistically similar yields attained by MBIC11017 under both conditions suggests that its yield was effectively limited by a factor other than iron in both treatments. The lower growth rate but similar yield of MBIC11017 at low iron concentration compared with high iron concentration may reflect a cost of additional resource allocation toward iron acquisition in MBIC11017.
Fig. 2.—
(A) Growth rate in generations per day for Acaryochloris strains under low and high iron conditions. Error bars indicate standard errors. (B) Final yield in cells ml−1 for Acaryochloris strains grown under low and high iron conditions. Error bars indicate standard errors.
Acaryochloris MBIC11017 Assimilates Environmental Iron Faster than Acaryochloris CCMEE 5410
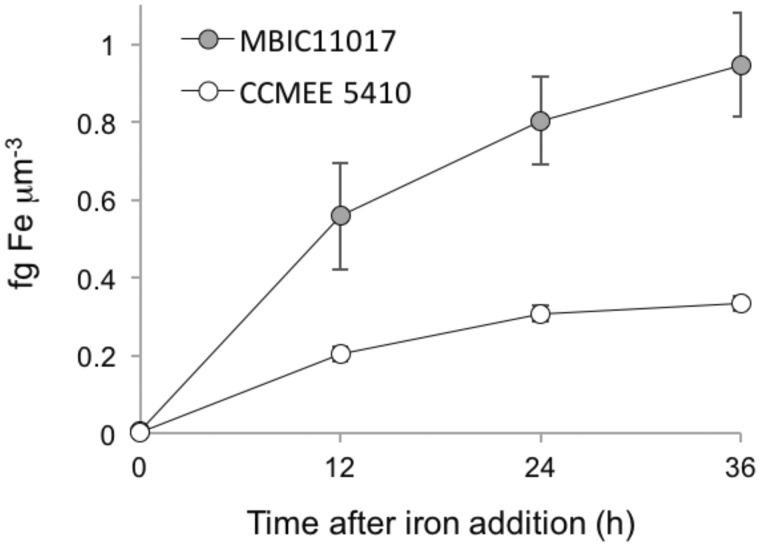
To estimate the rate of iron assimilation from the environment for each strain, we used optical emission spectroscopy to monitor the change in intracellular iron content over time. Iron was added to stationary phase cultures of both strains to a final concentration of 51 µM Fe (III). Samples were taken immediately prior to (t0) as well as 12, 24, and 36 h after iron addition (t12, t24, t36). Prior to iron addition, intracellular iron content of both strains was <0.01 fg Fe µm−3. Following addition, MBIC11017 assimilated iron three times faster than CCMEE 5410 (fig. 3; mean ± SE of 0.03 ± 0.006 vs. 0.01 ± 0.001 fg Fe µm−3 hr−1 over the first 24 h of the experiment; P = 0.0007 for the strain × time interaction).
Fig. 3.—
Cell volume-normalized intracellular iron content of Acaryochloris strains following iron addition. Error bars indicate standard errors.
Higher Levels of Expression of Iron Assimilation Genes in Acaryochloris MBIC11017
Bacterial iron assimilation proteins include siderophores, siderophore transporters and Fur transcriptional regulators. Siderophores are low molecular weight compounds with a high affinity for iron that are transported out of the cell by ATP-binding cassette (ABC) superfamily proteins (Kranzler et al. 2013). Siderophores with chelated iron are shuttled back into the cell by TonB-dependent transporters (Kranzler et al. 2013). Transcription of many siderophore synthesis and transporter genes are regulated by Fur transcriptional regulators. In E. coli and other enteric bacteria, Fur regulators exhibit metal-dependent repression (Escolar et al. 1999): when intracellular iron is high, transcription of genes under Fur regulation is repressed, whereas transcription is derepressed when intracellular iron is low (Andrews et al. 2003).
To evaluate whether phenotypic differences between strains are associated with a greater relative abundance of iron assimilation transcripts in MBIC11017, we performed an RNA-seq analysis (supplementary fig. S2, Supplementary Material online) for the following conditions: 1) exponential phase cells growing at low iron concentration (sw0); 2) stationary phase cells (t0 from the iron addition experiment described above); and 3) cells 36 h after iron addition (t36). To compare gene expression between strains, we estimated the log2-fold difference in normalized gene counts (Love et al. 2014).
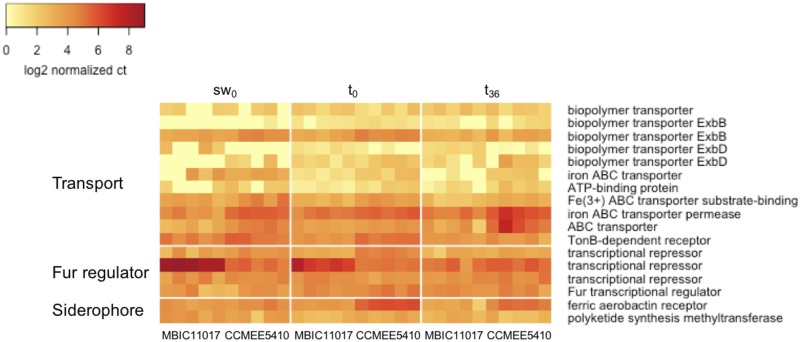
The transcriptomic data were tightly associated with observed physiological differences between MBIC11017 and CCMEE 5410. The abundance of transcripts involved in siderophore production and iron transport was greater in MBIC110017 under all conditions tested (fig. 4), consistent with the higher rate of iron assimilation (fig. 3) and greater yield at low iron (fig. 2B) of this strain. The expression of Fur homologs was also greater in MBIC11017 for the sw0 and t0 treatments (fig. 4). In Gram-negative bacteria, Fur is not only a repressor of iron-assimilation genes but is also a major regulatory protein with diverse functions (Ratledge and Dover 2000). It is therefore difficult to interpret the effects of individual Acaryochloris fur homologs without characterizing these genes. Given the toxicity of iron at high concentrations and the increased number of iron assimilation genes under regulatory control, we do speculate that these genes may be important for the maintenance of iron homeostasis in MBIC11017.
Fig. 4.—
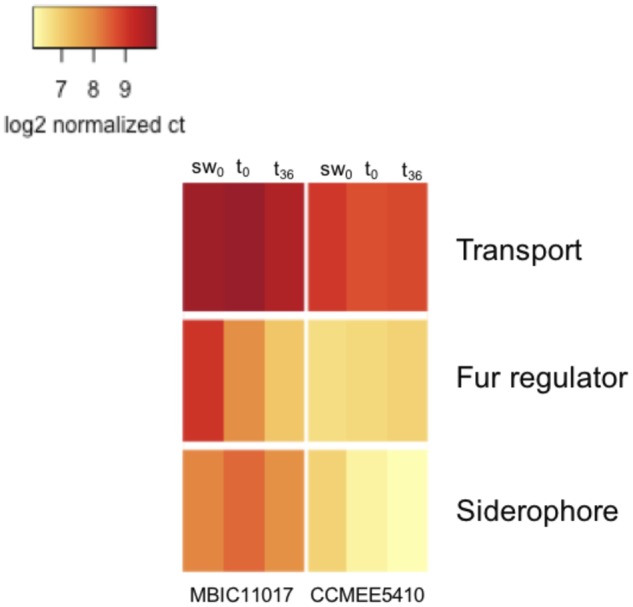
Heatmap of log2-transformed normalized gene counts for iron assimilation genes in the transport, Fur homolog, and siderophore categories, respectively.
What contributes to this greater abundance of iron assimilation transcripts in MBIC10017? Potential mechanisms discussed below include the stronger expression of single-copy orthologs present in both genomes (Class 1 genes), the enhanced expression of duplicated genes in MBIC11017 that are single-copy in CCMEE 5410 (Class 2 genes) and the expression of genes that are novel to the MBIC11017 genome (Class 3 genes).
Little Expression Divergence between Single-Copy Orthologs
Five of the 17 Class 1 genes (single-copy in both genomes) had a log2-fold difference in expression between strains with an absolute value of at least 2 for at least one condition (fig. 5; supplementary table S1, Supplementary Material online). Of these, two were more highly expressed in MBIC11017. One is an annotated ExbD biopolymer transporter gene (AM1_RS00740) with greater expression at t0 and t36. The second was an annotated (Fur) transcriptional repressor (AM1_RS05030) with greater expression during exponential growth (sw0) and stationary phase (t0). Three genes exhibited higher expression in CCMEE 5410: two annotated ABC transporters at t36 (ON05_RS11755, ON05_RS03170) and a siderophore-producing gene (ferric aerobactin receptor ON05_RS11635) at t0. We conclude that expression divergence of single-copy orthologs does not appear to make a major contribution to the physiological differences between strains.
Fig. 5.—
Heatmap of log2-transformed normalized gene expression for Class 1 genes (single-copy orthologs present in both genomes). Cells represent individual replicates.
Expression Reduction of Iron Assimilation Duplicates in MBIC11017
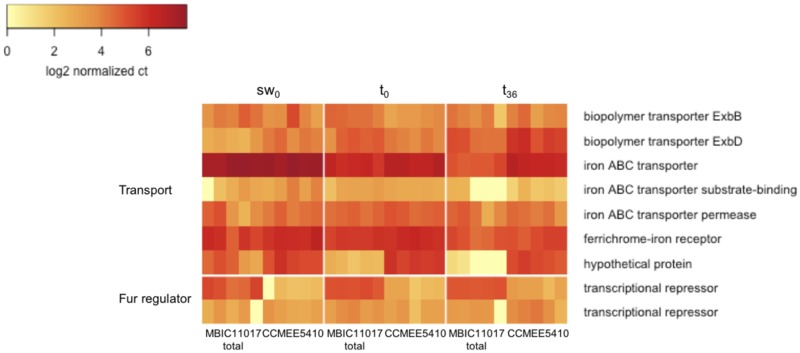
For Class 2 genes (duplicated in MBIC11017, single-copy in CCMEE 5410), we can distinguish between different potential mechanisms of MBIC11017 gene duplicate retention. Greater aggregate transcript abundance of MBIC11017 duplicates compared with expression of the CCMEE 5410 copy would be consistent with a positive dosage effect (Kondrashov 2012). Alternatively, similar expression between duplicates and the CCMEE 5410 copy would provide evidence that selection to maintain ancestral levels of gene expression following duplication resulted in expression reduction and the retention of duplicates in the MBIC11017 genome (Qian et al. 2010). Expression between strains was similar for most loci: only two of the nine Class 2 genes had log2-fold differences of at least 2 (fig. 6; supplementary table S2, Supplementary Material online). One of these encodes a TonB transporter, which had greater expression in CCMEE 5410 at t0 and t36. The other encodes a Fur transcriptional regulator which had greater expression in MBIC11017 under all treatments. These results imply that expression reduction has played a more important role for the maintenance of MBIC11017 duplicates than has positive dosage.
Fig. 6.—
Heatmap of log2-transformed normalized gene expression for Class 2 genes (duplicated in MBIC11017, single-copy in CCMEE 5410). Cells represent individual replicates (for MBIC11017, expression is summed over paralogs).
Expression reduction can arise by chance or by selection to avoid maladaptive stoichiometry following duplication, and it has been reported to be an important mechanism of duplicate retention in mammals and yeast (Qian et al. 2010; Lan and Pritchard 2016). In human and mouse, most young tandem duplicates are down-regulated and appear to be retained by the sharing of ancestral levels of dosage (Lan and Pritchard 2016). This may be a result of the epigenetic silencing of duplicates by increased promoter methylation (Rodin and Riggs 2003), which is known to decrease downstream gene expression in mammals (Weber et al. 2007). Consistent with this model, the promoters of young duplicates in human are generally heavily methylated (Keller and Yi 2014). Whether a similar mechanism contributes to expression reduction in Acaryochloris remains to be investigated, but there is some evidence for the regulation of gene expression by methylation in bacteria (Casadesús and Low 2006; Adhikari and Curtis 2016).
Gene expression of duplicates was also often asymmetric. In a majority of cases, the ancestral chromosomal copy had a greater estimated transcript abundance across all conditions (supplementary table S3, Supplementary Material online). However, there was also limited evidence for condition-dependent differences in which copy was more highly expressed (supplementary table S3, Supplementary Material online). For example, for the transporter gene exbB, one of the plasmid copies was the most highly expressed copy for sw0 and t0, whereas the chromosomal copy was most highly expressed at t36. This observed expression divergence among copies may be indicative of either sub-functionalization or neo-functionalization of duplicates (Moore and Purugganan 2005).
Transcription of Novel Genes Drives Stronger Expression of Iron Assimilation Genes in MBIC11017
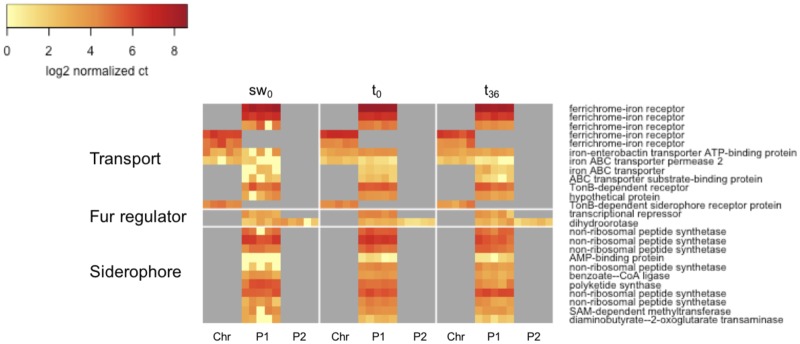
Of the 25 Class 3 genes (no ortholog in CCMEE 5410), three have also been duplicated and 20 are encoded on plasmids. Most (>80%) plasmid-encoded genes in Acaryochloris are idiosyncratic to either MBIC11017 or CCMEE 5410, which suggests that they have been acquired by HGT (Miller et al. 2011). This includes a cluster of genes (AM1_RS29740-AM1_RS29790; fig. 1) flanked by transposase genes that is homologous to a characterized siderophore-producing gene cluster in the cyanobacterium Anabaena PCC 7120 (Jeanjean et al. 2008). This cluster accounts for the vast majority of Acaryochloris transcripts that map to siderophore-producing genes (figs. 4, 5, and 7). Certain Class 3 genes exhibited particularly high transcript abundance. For example, a plasmid-encoded annotated TonB-dependent siderophore receptor (AM1_RS29960) was highly expressed under all conditions, and in the top 20 most highly expressed protein-coding genes during stationary phase t0 (supplementary table S4, Supplementary Material online). These results indicate that novel HGT-derived gene content in the MBIC11017 genome accounts for the majority of the differences in iron assimilation gene dosage between Acaryochloris strains. Although the nature of the interactions among these novel and ancestral Acaryochloris iron assimilation proteins remains to be investigated, it is of particular interest whether the highly expressed siderophore receptor AM1_RS29960 recognizes iron-chelated siderophores produced by AM1_RS29740-AM1_RS29790.
Fig. 7.—
Heatmap of log2-transformed normalized gene expression for Class 3 genes (no ortholog in CCMEE 5410). Cells represent individual replicates. Chr corresponds to genes located on the MBIC11017 chromosome; P1 and P2 correspond to paralogs located on plasmids.
Concluding Remarks
One implication of the observed pattern of expression reduction of duplicates in MBIC11017 is that there has been selection to maintain proper stoichiometry among the ancestral components of iron assimilation. According to this scenario, reductions in duplicate expression occurred before the deletion of one of the copies, thereby favoring their retention. This is consistent with the evidence for strong purifying selection (dN/dS ≈ 0.1) on retained duplicates in Acaryochloris (Miller et al. 2011). By contrast, we suggest that the activities of the novel, horizontally transferred iron assimilation genes that have become established in the Acaryochloris MBIC11017 genome may be largely independent of ancestral iron metabolism. In particular, we might expect this to be the case for the highly expressed siderophore cluster, since genes involved in secondary metabolism (such as siderophore synthesis) are more likely to be successfully horizontally transferred than those that encode proteins that participate in diverse interactions with the existing proteome (Jain et al. 1999; Nakamura et al. 2004; Puigbò et al. 2010). Further clarification of these issues will ultimately provide a deeper understanding of how novel and duplicated genes are incorporated into an existing expression network.
Supplementary Material
Supplementary data are available at Genome Biology and Evolution online.
Supplementary Material
Acknowledgments
We thank Emiko Sano for technical advice and Jim Elser, John McCutcheon, Frank Rosenzweig, and two anonymous reviewers for comments on the manuscript. This work was supported by award NNA15BB04A from the National Aeronautics and Space Administration.
Literature Cited
- Adhikari S, Curtis PD.. 2016. DNA methyltransferases and epigenetic regulation in bacteria. FEMS Microbiol Rev. 40(5):575–591. [DOI] [PubMed] [Google Scholar]
- Afgan E, et al. . 2016. The Galaxy platform for accessible, reproducible and collaborative biomedical analyses: 2016 update. Nucleic Acids Res. 44(W1):W3–W10. [DOI] [PMC free article] [PubMed] [Google Scholar]
- Anders S, Pyl PT, Huber W.. 2015. HTSeq: a Python framework to work with high-throughput sequencing data. Bioinformatics 31(2):166–169. [DOI] [PMC free article] [PubMed] [Google Scholar]
- Andersson DI, Hughes D.. 2009. Gene amplification and adaptive evolution in bacteria. Annu Rev Genet. 43:167–195. [DOI] [PubMed] [Google Scholar]
- Andrews S. 2010. FastQC: a quality control tool for high throughput sequence data. Available from: http://www.bioinformatics.babraham.ac.uk/projects/fastqc, last accessed June 4, 2018.
- Andrews SC, Robinson AK, Rodríguez-Quiñones F.. 2003. Bacterial iron homeostasis. FEMS Microbiol Rev. 27(2–3):215–237. [DOI] [PubMed] [Google Scholar]
- Banse K. 1976. Rates of growth, respiration and photosynthesis of unicellular algae as related to cell size. A review. J Phycol. 12:135–140. [Google Scholar]
- Brown CJ, Todd KM, Rosenzweig RF.. 1998. Multiple duplications of yeast hexose transport genes in response to selection in a glucose-limited environment. Mol Biol Evol. 15(8):931–942. [DOI] [PubMed] [Google Scholar]
- Cairns J, Foster PL.. 1991. Adaptive reversion of a frameshift mutation in Escherichia coli. Genetics 128(4):695–701. [DOI] [PMC free article] [PubMed] [Google Scholar]
- Casadesús J, Low D.. 2006. Epigenetic gene regulation in the bacterial world. Microbiol Mol Biol Rev. 70(3):830–856. [DOI] [PMC free article] [PubMed] [Google Scholar]
- Chow EWL, Morrow CA, Djordjevic JT, Wood IA, Fraser JA.. 2012. Microevolution of Cryptococcus neoformans driven by massive tandem gene amplification. Mol Biol Evol. 29(8):1987–2000. [DOI] [PubMed] [Google Scholar]
- Duraisingh MT, Cowman AF.. 2005. Contribution of the pfmdr1 gene to antimalarial drug-resistance. Acta Trop. 94(3):181–190. [DOI] [PubMed] [Google Scholar]
- Escolar L, Pérez-Martín J, De Lorenzo V.. 1999. Opening the iron box: transcriptional metalloregulation by the Fur protein. J Bacteriol. 181(20):6223–6229. [DOI] [PMC free article] [PubMed] [Google Scholar]
- Foy RH. 1980. The influence of surface to volume ratio on the growth rates of planktonic blue-green algae. Br Phycol J. 15(3):279–289. [Google Scholar]
- Gresham D, et al. . 2008. The repertoire and dynamics of evolutionary adaptations to controlled nutrient-limited environments in yeast. PLoS Genet. 4(12):e1000303. [DOI] [PMC free article] [PubMed] [Google Scholar]
- Jain R, Rivera MC, Lake JA.. 1999. Horizontal gene transfer among genomes: the complexity hypothesis. Proc Natl Acad Sci U S A. 96(7):3801–3806. [DOI] [PMC free article] [PubMed] [Google Scholar]
- James TC, Usher J, Campbell S, Bond U.. 2008. Lager yeasts possess dynamic genomes that undergo rearrangements and gene amplification in response to stress. Curr Genet. 53(3):139–152. [DOI] [PubMed] [Google Scholar]
- Jeanjean R, et al. . 2008. A large gene cluster encoding peptide synthetases and polyketide synthases is involved in production of siderophores and oxidative stress response in the cyanobacterium Anabaena sp. strain PCC 7120. Environ Microbiol. 10(10):2574–2585. [DOI] [PubMed] [Google Scholar]
- Keller TE, Yi SV.. 2014. DNA methylation and evolution of duplicate genes. Proc Natl Acad Sci U S A. 111(16):5932–5937. [DOI] [PMC free article] [PubMed] [Google Scholar]
- Kondrashov FA. 2012. Gene duplication as a mechanism of genomic adaptation to a changing environment. Proc Biol Sci. 279(1749):5048–5057. [DOI] [PMC free article] [PubMed] [Google Scholar]
- Kranzler C, Rudolf M, Keren N, Schleiff E.. 2013. Iron in cyanobacteria. Adv Bot Res. 65:57–105. [Google Scholar]
- Lan X, Pritchard JK.. 2016. Coregulation of tandem duplicate genes slows evolution of subfunctionalization in mammals. Science 352(6288):1009–1013. [DOI] [PMC free article] [PubMed] [Google Scholar]
- Langmead B, Salzberg SL.. 2012. Fast gapped-read alignment with Bowtie 2. Nat Methods 9(4):357–359. [DOI] [PMC free article] [PubMed] [Google Scholar]
- Lawrence JG, Ochman H.. 1998. Molecular archaeology of the Escherichia coli genome. Proc Natl Acad Sci U S A. 95(16):9413–9417. [DOI] [PMC free article] [PubMed] [Google Scholar]
- Love MI, Huber W, Anders S.. 2014. Moderated estimation of fold change and dispersion for RNA-seq data with DESeq2. Genome Biol. 15(12):550.. [DOI] [PMC free article] [PubMed] [Google Scholar]
- Miller SR, et al. . 2005. Discovery of a free-living chlorophyll d-producing cyanobacterium with a hybrid proteobacterial/cyanobacterial small-subunit rRNA gene. Proc Natl Acad Sci U S A. 102(3):850–855. [DOI] [PMC free article] [PubMed] [Google Scholar]
- Miller SR, Wood AM, Blankenship RE, Kim M, Ferriera S.. 2011. Dynamics of gene duplication in the genomes of chlorophyll d-producing cyanobacteria: implications for the ecological niche. Genome Biol Evol. 3:601–613. [DOI] [PMC free article] [PubMed] [Google Scholar]
- Miyashita H, et al. . 1996. Chlorophyll d as a major pigment. Nature 383(6599):402. [Google Scholar]
- Moore RC, Purugganan MD.. 2005. The evolutionary dynamics of plant duplicate genes. Curr Opin Plant Biol. 8(2):122–128. [DOI] [PubMed] [Google Scholar]
- Musher DM, et al. . 2002. Emergence of macrolide resistance during treatment of pneumococcal pneumonia. N Engl J Med. 346(8):630. [DOI] [PubMed] [Google Scholar]
- Nakamura Y, Itoh T, Matsuda H, Gojobori T.. 2004. Biased biological functions of horizontally transferred genes in prokaryotic genomes. Nat Genet. 36(7):760–766. [DOI] [PubMed] [Google Scholar]
- Ochman H, Lawrence JG, Groisman EA.. 2000. Lateral gene transfer and the nature of bacterial innovation. Nature 405(6784):299–304. [DOI] [PubMed] [Google Scholar]
- Pinto FL, Thapper A, Sontheim W, Lindblad P.. 2009. Analysis of current and alternative phenol based RNA extraction methodologies for cyanobacteria. BMC Mol Biol. 10:79.. [DOI] [PMC free article] [PubMed] [Google Scholar]
- Puigbò P, Wolf YI, Koonin EV.. 2010. The tree and net components of prokaryote evolution. Genome Biol Evol. 2:745–756. [DOI] [PMC free article] [PubMed] [Google Scholar]
- Qian W, Liao B-Y, Chang AY-F, Zhang J.. 2010. Maintenance of duplicate genes and their functional redundancy by reduced expression. Trends Genet. 26(10):425–430. [DOI] [PMC free article] [PubMed] [Google Scholar]
- Ratledge C, Dover LG.. 2000. Iron metabolism in pathogenic bacteria. Annu Rev Microbiol. 54:881–941. [DOI] [PubMed] [Google Scholar]
- Reams AB, Neidle EL.. 2003. Genome plasticity in Acinetobacter: new degradative capabilities acquired by the spontaneous amplification of large chromosomal segments. Mol Microbiol. 47(5):1291–1304. [DOI] [PubMed] [Google Scholar]
- Riehle MM, Bennett AF, Long AD.. 2001. Genetic architecture of thermal adaptation in Escherichia coli. Proc Natl Acad Sci U S A. 98(2):525–530. [DOI] [PMC free article] [PubMed] [Google Scholar]
- Rodin SN, Riggs AD.. 2003. Epigenetic silencing may aid evolution by gene duplication. J Mol Evol. 56(6):718–729. [DOI] [PubMed] [Google Scholar]
- Sandegren L, Andersson DI.. 2009. Bacterial gene amplification: implications for the evolution of antibiotic resistance. Nat Rev Microbiol. 7:578–588. [DOI] [PubMed] [Google Scholar]
- Schönknecht G, et al. . 2013. Gene transfer from bacteria and archaea facilitated evolution of an extremophilic eukaryote. Science 339:1207–1210. [DOI] [PubMed] [Google Scholar]
- Swingley WD, Hohmann-Marriott MF, Le Olson T, Blankenship RE.. 2005. Effect of iron on growth and ultrastructure of Acaryochloris marina. Appl Environ Microbiol. 71(12):8606–8610. [DOI] [PMC free article] [PubMed] [Google Scholar]
- Swingley WD, et al. . 2008. Niche adaptation and genome expansion in the chlorophyll d-producing cyanobacterium Acaryochloris marina. Proc Natl Acad Sci U S A. 105:2005–2010. [DOI] [PMC free article] [PubMed] [Google Scholar]
- Triglia T, Foote SJ, Kemp DJ, Cowman AF.. 1991. Amplification of the multidrug resistance gene pfmdr1 in Plasmodium falciparum has arisen as multiple independent events. Mol Cell Biol. 11:5244.. [DOI] [PMC free article] [PubMed] [Google Scholar]
- von Rozycki T, Nies DH.. 2009. Cupriavidus metallidurans: evolution of a metal-resistant bacterium. Antonie Van Leeuwenhoek 96(2):115–139. [DOI] [PubMed] [Google Scholar]
- Weber M, et al. . 2007. Distribution, silencing potential and evolutionary impact of promoter DNA methylation in the human genome. Nat Genet. 39:457–466. [DOI] [PubMed] [Google Scholar]
- Yang F, et al. . 2010. Biosequestration via cooperative binding of copper by Ralstonia pickettii. Environ Technol. 31:1045–1060. [DOI] [PubMed] [Google Scholar]
Associated Data
This section collects any data citations, data availability statements, or supplementary materials included in this article.


