Abstract
Background
Recent studies have shown that increased mobilization of Long Interspersed Nuclear Elements-1 (L1) can promote the pathophysiology of multiple neurological diseases. However, its role in Huntington’s disease (HD) remains unknown.
Material/Methods
R6/2 mice – a common mouse model of HD – were used to evaluate changes in L1 mobilization. Pyrosequencing was used to evaluate methylation content changes. L1-ORF1 and L1-ORF2 expression analysis were evaluated by RT-PCR and immunoblotting. Changes in pro-survival signaling were evaluated by L1-ORF overexpression studies and validated in the mouse model by immunohistochemistry and immunoblotting.
Results
We found an increased mobilization of L1 elements in the caudate genome of R6/2 mice (p<0.05) – a common mouse model of HD – but not in wild-type mice. Subsequent pyrosequencing and expression analysis showed that the L1 elements were hypomethylated and their respective ORFs were overexpressed in the affected tissues. In addition, a significant decrease in the pro-survival proteins such as the phosphoproteins of AKT target proteins, mTORC1 activity, and AMPK alpha levels was observed with the increase in the expression L1-ORF2.
Conclusions
These findings indicate that hyperactive retrotransposition of L1 triggers a downstream signaling pathway affecting the neuronal survival pathways via downregulation of mTORC1 activity and AMPKalpha and increasing apoptosis in neurons.
MeSH Keywords: AMP-Activated Protein Kinases, Cell Survival, Huntington’s Disease, Long Interspersed Nuclear Elements-1
Background
Huntington’s disease (HD) is an autosomal dominant neurodegenerative disease characterized by complex cognitive and psychiatric-related problems [1–3]. The symptoms are usually manifested as a mid-life onset and progress inexorably over 15–20 years [1,2,4]. The disease pathology is usually observed in the caudate nucleus and the putamen in the striatum, at least in early stages, and progress to other regions of the brain [1]. At the molecular level, the disease is caused due to the expansion of CAG repeat (Polygln) in the HTT gene on chromosome 4, which leads to an extended glutamine tract in the encoded huntingtin protein, affecting its structure and functions, and causing misfolding and aggregation in the cells [4–6].
Multiple remarkable studies have shown that autophagosomal degradation pathway as a mechanism to clear the mutant protein in cells, and its dysregulation is often implicated in the pathogenesis of HD [7–9]. Recent studies using HD models have shown that AMPKalpha, a critical regulator of autophagy, is altered in the disease conditions and its restoration can ameliorate the disease manifestations [10,11]. While these analyses provide insights into the molecular signaling driving HD pathogenesis, it is still unclear why the pathology varies among different tissues, despite the mutant protein being expressed in all tissues [12–14]. Multiple studies have reasoned that tissue-specific modifiers might co-function or modulate the disease protein attributes and lead to such tissue-specific pathological onset and progression.
Recent studies have suggested that mobile elements in the genome such as long interspersed nuclear elements-1 (LINE-1 or L1) are modified in a tissue-specific way and are associated with the pathology of multiple neurological diseases such as schizophrenia and major depressive disorder [15,16]. In addition, alterations in the L1 content of tissues are known to affect the expression of its 2 ORFs (ORF1 and ORF2), which could affect the signaling pathways to facilitate disease progression [17]. While these studies highlight the importance of the L1 content in neurological diseases, its significance in the context of Huntington’s disease remains unexplored.
Material and Methods
Mouse models
The present study was performed in accordance with the guidelines provided in the Declaration of Helsinki. All mouse experiments were performed with prior approval from the institute’s Animal Care Committee at Tongji Hospital of Tongji Medical College, Huazhong University of Science and Technology (protocol no: 10132015). Housing and all procedures using animals were in compliance with the Animals (Scientific Procedures) Act, 1986 (UK) (amended 2013) and reported as per the ARRIVE Guidelines for reporting animal research [18]. All mice were housed in individually ventilated cages (5 per cage) under specific pathogen-free (SPF) condition, temperature-controlled, and with a 12 h/12 h light/dark cycle. Animal weights were routinely monitored every other day. The wild-type and R6/2 mice – a transgenic model expressing exon 1 of human N-mut HTT containing 150 poly-Q repeats – were purchased from Jackson Laboratory (West Grove, PA, USA). The caudate regions of mouse brain from 10–12-week-old wild-type and R6/2 mice were dissected and used for L1 retrotransposition analysis. For analysis of older mice, brain samples taken at ages 6–9 months from both male and female mice.
Evaluation of L1 content in brain tissues and liver tissues
The L1 content was evaluated as copy number content of ORF1 and ORF2 in brain and liver tissues samples of both HD transgenic and control mice. The method used to determine the L1 content was followed as described previously with minor modifications [15,19]. Briefly, 500 pg of DNA was used as a template and was amplified using m5′UTR-, mORF1-, and mORF2-specific primer sets in an SYBR green assay. 5srRNA was used as internal control for the assay.
Pyrosequencing assays targeting L1 regions
DNA was extracted from mouse samples and evaluated for the status of methylation in CpG dinucleotides located in the L1 region. The 5′UTR region upstream of ORF1 in the LINE-1 element was PCR amplified and analyzed for DNA methylation using the Qiagen PyroMark assay kit (Qiagen, USA) [20]. The primer sets (5′-biotin-labeled) used for PCR amplification were: Fwd: CCAGCTGGGGAGGCGGCCTA, Rev: CTGGTAATCTCTGGAGTT and the sequencing probe used was: GCCACAGCAGCAG. Briefly, the PCR products were suspended using the PyroMark Q24 kit (Qiagen) following the manufacturer’s protocol, and the methylation status was quantified with an estimated score of 0–100, with 0 being no methylation and 100 representing complete methylation for all of the CpG dinucleotides in the region. The threshold in the assay was >5%.
Overexpression experiments
The coding DNA sequence of both L1-ORFs was amplified (GenBank: AF081114.1) and cloned into a pCMV6 vector and used for overexpression studies. For overexpression experiments, 293T cells were transfected with pCMV6–L1 ORF1 or ORF2 plasmids and analyzed for expression and other associated changes at 72 h after transfection.
Detection of apoptosis
Apoptosis was detected using a TUNEL staining kit (Promega, WI) [21]. For mouse samples, 20-micron tissue samples were processed and stained as per the manufacturer’s instructions. For cells, TUNEL staining was performed directly in cells and the absolute number of TUNEL-positive cells in randomly picked microscopy fields were noted.
Immunoblotting
The cell lysates were separated on a 4–20% gel under reducing conditions, transferred to a PVDF membrane (Bio-Rad, USA), and blotted using specific antibodies. The membrane was blocked with 3% milk and probed with primary antibodies. The primary antibodies and the dilutions used were: rabbit LC3B (79D7, Cell Signaling Technology, USA, 1: 1000), rabbit pS6 (D908K, Cell Signaling Technology, USA, 1: 1000), rabbit AMPK alpha (P0056, Sigma, USA 1: 500), rabbit CXCR (UMB2, Abcam USA, 1: 500), rabbit AMP alpha (D6D9, Cell Signaling Technology, USA, 1: 1000), rabbit AKT (C67E7, Cell Signaling Technology, USA, 1: 1000), chicken L1-ORF2 (Rockland Antibodies Inc 1: 500), mouse L1-ORF1 (Millipore, 1: 500) and mouse Actin (8H10D10 Cell Signaling Technology, USA, 1: 2000), and mouse HA (C29F4 Cell Signaling Technology, USA, 1: 2000). After the primary antibody incubation, the membrane was then washed and incubated with respective secondary antibodies conjugated with horseradish peroxidase (HRP) and developed using a chemiluminescence substrate (Super Signal West Dura, Pierce Biotechnology, USA). Densitometry analysis was performed to determine the relative fold change in protein levels. All immunoblots were done at least 3 times and a representative blot was shown.
RT-PCR
Total RNA was isolated at 72 h after transfection in cultures or brain tissue samples and reverse transcribed as described previously [22]. PCR was performed with a 7500 Applied Biosystem instrument using TaqMan probes with the Universal PCR Master Mix (Life Technologies, USA). The following primer sets were used for L1-ORFs PCR amplification: ORF1-FWD: ATGGCGAAAGGTAAACGG, ORF1-REV: TTCCAGATTT CTTTCCTAGG and ORF2-FWD: TTAACAACTAAAATAACAGGAAG, ORF2-REV: TATCTT TTTCTCTGAGATGAGTTTC Gapdh (glyceraldehyde 3-phosphate dehydrogenase): Hs02758991_g1; (Applied Biosystems, USA) was used as a control. Empty vector-transfected cells or wild-type tissue samples were used as a respective reference to determine the changes in gene expression. All samples were run in PCR as triplicates.
AKT array assay
AKT array assay kit (Full Moon Biosystems) was used to evaluate the changes in the cell survival pathway-related genes. The assays were performed as per the manufacturer’s instructions in L1- ORF2-overexpressed cell lysates. All samples were analyzed in triplicate.
Immunohistochemistry
Mouse brain tissues were fixed in 4% paraformaldehyde and paraffin-embedded for sectioning. We collected 5-micron sections corresponding to caudate regions and performed antigen retrieval using a citric acid buffer (H-3300, Vector Labs, USA). Sections were then blocked and stained for pS6 (4858, Cell Signaling Technology, USA 1: 25) or AMPK alpha (P0056, Sigma, USA 1: 50). Then, sections were processed using respective HRP conjugated secondary antibody and developed using ImmPRESS polymer detection kit (Vector Labs, USA). Sections from 5 different mice per group were analyzed.
Statistics
All statistical analyses were performed using one-way ANOVA. Statistical significance was set at p<0.05. All calculations were made using GraphPad Prism Version 6.
Results
L1 content in the brains of HD transgenic mice
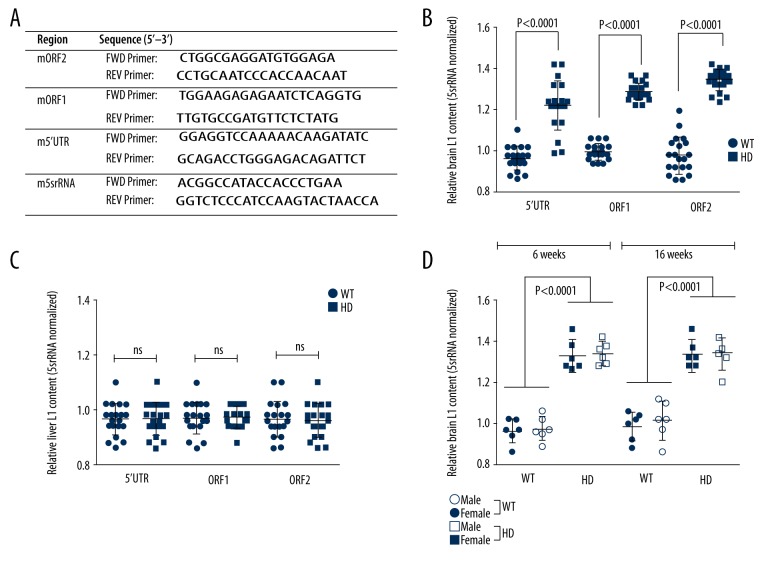
To test if there are changes in the L1 content in the HD mice, the L1 content in the 10–12-week-old HD mouse brain caudate regions were evaluated and compared to age-matched wild-type mice. The primer sets used for the analysis are provided in Figure 1A. The results showed a significant increase in the L1-ORF2 copy number in HD mouse brain tissue as opposed to the control mouse brain tissue (Figure 1). Similar results were also observed with the copy number of L1-ORF1 and the 5′UTR regions, suggesting that L1 content was increased in the HD mice (Figure 1B). However, these changes were not observed from matched liver tissues of mice, indicating that the changes were limited to brain tissues (Figure 1C). We also assessed whether this increase is specifically associated with any of the demographic factors, such as age and sex of the mice, and the results showed there was no correlation (Figure 1D), and the increase in L1 content in HD mice is irrespective of them.
Figure 1.
L1 copy content analysis in HD mice. (A) Primers used for SYBR Green PCR assay to quantify L1 content. (B) 5s-rRNA normalized L1 copy number for 5′UTR, ORF1, and ORF2 in brain caudate regions of wild-type and HD mice (age 10–12 weeks; n=20; includes equal numbers of males and females). Significantly higher L1 copy numbers in HD mice was observed compared with controls. (C) L1 content analysis in liver tissues from matched mice used for brain tissue analysis. No change in L1 copy number was observed. (D) Age- and sex-based analysis of L1copy number in WT and HD mice at 6 and 16 weeks of age (n=6). No correlation or trend with age or sex was seen. Values are mean ± standard deviation.
Decreased methylation content and increased expression of L1ORFs in HD transgenic mice
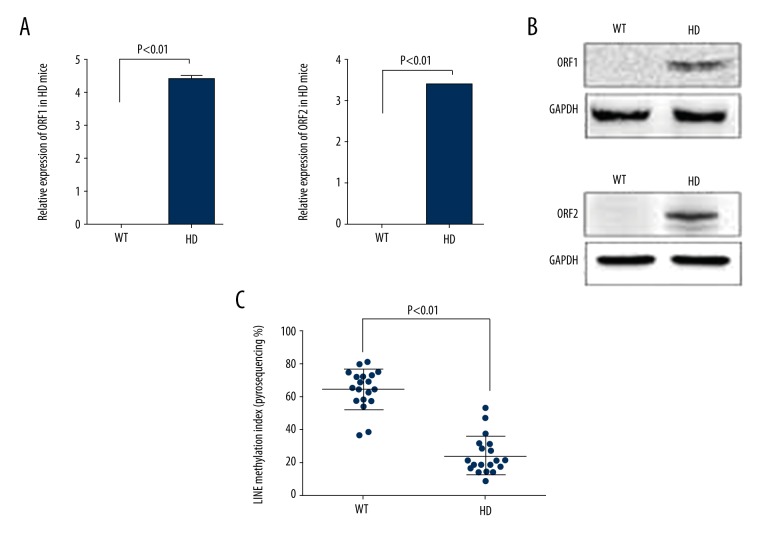
To study whether increased L1 content gets translated as an increased expression of its ORFs, the expression of L1 transcripts and protein in affected tissues (brain caudate) from HD mice were evaluated and compared to similar regions of wild-type mice. We observed elevated levels of both the transcripts ORF1 and ORF2 in the HD mice, but it was not detectable in control mice (Figure 2A; * p<0.01). Similar trends were observed in the protein levels of ORF1 and ORF2 from the HD mouse brain tissues (Figure 2B). In addition, as methylation of CpG sites represents a major mechanism for gene expression regulation, we probed for methylation content of the L1- regions. The results showed a decreased methylation content in HD mice (Figure 2C). This suggests that the increased L1 content in the mouse genome has an impaired remethylation process or, alternatively, an augmented de-methylation has occurred, which in turn causes the increased expression of L1 mRNAs.
Figure 2.
L1-ORF expression and methylation in HD mice. (A) Real-time analysis showing increased L1-ORFs expression in HD mouse brain tissues (n=10; age 10–12 weeks). (B) Immunoblot showing ORF 1 and 2 expressions in HD mice. Tissue samples from 5 different mice were analyzed independently and a representative blot is shown. (C) Methylation analysis by pyrosequencing. HD mice L1 regions are less methylated than in WT mice. Values are mean ± standard deviation (n=10; age 10–12 weeks).
Decreased mTOR activity and AMPK alpha levels in HD mice
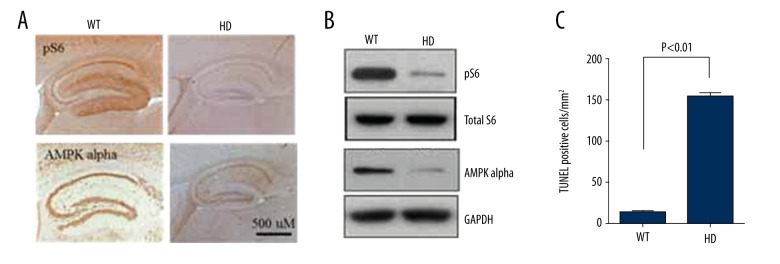
It is well known that changes in cell survival signaling pathways facilitate the disease progression in HD [1,3]. Here, we hypothesized that L1 copy number and expression changes could modulate the survival signaling pathways. In accordance with that, mouse samples indicated that both mTORC1 activity as measured through pS6 levels and AMPK α levels were downregulated in the affected regions but not in controls regions (Figure 3A). Finally, we also tested if there is any corresponding change in cell death, and the data showed that increased L1 content regions were correlated with increased cell death (Figure 3B).
Figure 3.
mTOR activity and AMPK alpha signaling in HD mice. (A, B) WT and HD mice were evaluated for mTOR activity and AMPK alpha levels. (A) Immunostaining showed decreased pS6 and AMPK alpha levels in HD mice. Five mice were analyzed, and a representative image is shown. (B) Immunoblot showing a similar decreased pattern of mTOR activity and AMPK alpha in HD mice. Tissue samples from 5 different mice were analyzed independently, and a representative blot is shown. (C) Quantification of TUNEL analysis showing increased cell death in HD mice. Three 20-micron sections from 5 mice were analyzed. Values are reported as mean ± standard deviation.
Overexpression of L1 ORF2 modulate mTOR activity and AMPK alpha in 293T cells
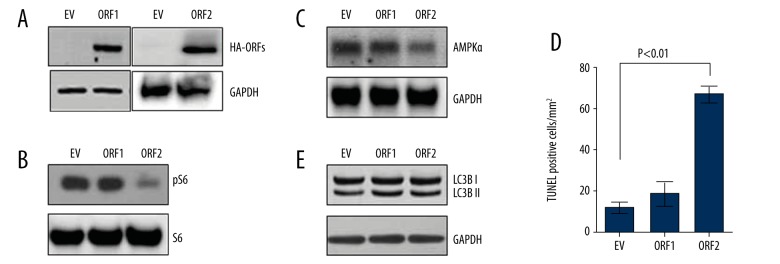
To understand the significance of L1-ORFs in HD, we overexpressed L1-ORFs in 293T cells and tested whether it can induce in vivo-like changes in mTORC1 activity and AMPKα in cells. The results indicated that overexpression of L1-ORF2 down-regulates mTOR activity as measured by the expression of pS6 and AMPKα and by cell death (Figure 4A, 4B). In contrast, ORF1 expression had no significant effect in modulating these proteins or causing cell death (Figure 4C). In addition, as recent studies showed that mTORC1 and huntingtin modulate autophagy, we also tested for autophagy induction in overexpression experiments. The results showed minimal change in autophagy induction as measured by LC3BII, indicating that the autophagy induction is not part of L1ORF2-induced signaling.
Figure 4.
L1 ORFs modulate mTOR activity and AMPKalpha in cells. (A) Overexpression of L1-ORF1 and 2 in cells. Immunoblot for HA tag confirming the expression of ORFs in cells. (B) mTOR activity in L1-ORF-overexpressed cells. Immunoblot showing decreased mTOR activity in ORF2-overexpressed cells, while no changes were observed in ORF1-overexpressed cells. (C) Immunoblot showing decreased AMPK alpha in ORF2-overexpressed cells. (D) Quantification of TUNEL-positive cells in ORF1- and ORF2-overexpressed cells. Increased numbers of TUNEL-positive cells were seen in ORF2-overexpressed cells. Values are reported as mean ± standard deviation. (E) Immunoblot of LC3B. No changes were seen in LC3B I and II levels in ORF1- and ORF2-overexpressed cells.
Overexpression of L1-ORF2 modulates cell survival signaling pathways
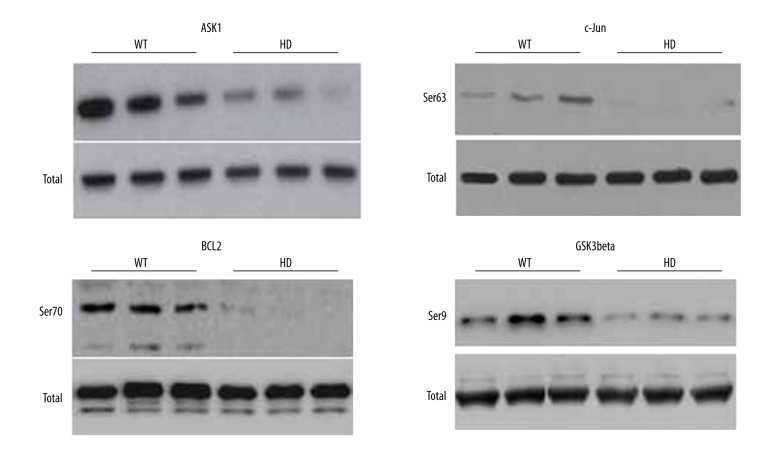
To further understand the significance of L1-ORF2 in HD progression and cell death pathways, we further tested for changes in other target proteins involved in cell survival signaling. As AKT is widely indicated as pro-survival and its activity is associated with amelioration of HD disease [23], changes in AKT target proteins were evaluated as a readout for changes in cell survival. The AKT array analysis between control and ORF2-overexpressed cells showed that ORF2 expression decreased phosphorylation of at least 13 different AKT target proteins (Table 1), suggesting that ORF2 has a direct effect in modulating cell survival signaling. Similar trends were checked in the tissue samples of HD mice, at least for ASK1, c-Jun, GSK3β, and BCL-2 (Figure 5).
Table 1.
L1-ORF2 modulates survival signaling – AKT array. ORF2-overexpressed and control cell lysates were analyzed for changes in survival signaling using AKT array. Protein phosphorylation and total levels were noted as arbitrary absorbance units and their ratio was calculated. Proteins showing greater than the 3-fold decrease in phosphorylation levels were listed along with their site and the potential kinase associated.
| Phosphorylation site | Ratio (phospho/total protein) | Amino acid sequence | Kinase involved | Biological effects/references | |
|---|---|---|---|---|---|
| ORF2 | Control | ||||
| AFX/FoxO4 (Phospho-Ser197) | 0.27 | 0.92 | RRRAApSMDSS | Akt | Cell survival [25] |
| ASK1 (Phospho-Ser83) | 0.16 | 0.72 | RGRGSpSVGGG | Akt | Cell survival [26] |
| ASK1 (Phospho-Ser966) | 0.16 | 0.66 | YLRSIpSLPVP | Unknown | Cell survival [26] |
| BAD (Phospho-Ser112) | 0.18 | 0.55 | RSRHSpSYPAG | p90RSK, PKA | Cell survival [27] |
| BAD (Phospho-Ser136) | 0.07 | 0.65 | RGRSRpSAPPN | Akt | Cell survival [28] |
| BAD (Phospho-Ser155) | 0.04 | 0. 58 | ELRRMpSDEFV | PKA | Cell survival [25,27,28] |
| BCL-2 (Phospho-Ser70) | 0.06 | 0.64 | PVARTpSPLQT | IL3, JNK | Cell survival [28,29] |
| BCL-2 (Phospho-Thr56) | 0.66 | 0.54 | SQPGHpTPHPA | Unknown | Cell survival [29] |
| BCL-XL (Phospho-Ser62) | 0.18 | 0.92 | WHLADpSPAVN | JNK | Cell survival [29] |
| c-Jun (Phospho-Ser63) | 0.08 | 0.58 | SDLLTpSPDVG | Unknown | Cell survival [30] |
| FKHR/FoxO1 (Phospho-Ser319) | 0.28 | 0.74 | RPRTSpSNAST | Akt | Cell survival [25,31] |
| FKHRL1/FoxO3a (Phospho-Ser253) | 0.15 | 0.74 | RRRAVpSMDNS | Akt | Cell survival [32] |
| GSK3b (Phospho-Ser9) | 0.11 | 0.68 | RPRTTpSFAES | Akt | Cell survival [33,34] |
Figure 5.
Immunoblot analysis of specific AKT array proteins from wild-type and HD mouse tissues. Specific AKT target proteins – ASK1, c-Jun, BCL-2, and GSK3beta – were evaluated for phosphorylation changes in brain caudate regions of HD mice. Lanes 1–3: Wild-type mice (n=3); Lanes 4–6: HD mice (n=3). Decreased phosphorylation consistent with the ORF2-overexpression effects were noted in the tissue samples.
Discussion
Polygln expansions (CAG repeats) as seen in HTT protein of HD are associated with multiple neurodegenerative diseases [23]. It is probable that in each case they develop a gain of function that may act through a common mechanism. R6/2 mice are an early transgenic model based on the polygln expansion with its ubiquitous expression in all tissues, as in mutant human gene expression [23]. Also, the progressive neurological phenotype mimics many features of human HD, including choreiform-like movements, involuntary stereotypic movements, tremors, and epileptic seizures, and thus the observations made can be correlated with the human form of HD.
Growing evidence suggests that the roles of retrotransposable elements underlie progression of multiple neuronal diseases [15,16]. Here, we report that the caudate genome of the Huntington’s disease mouse model exhibits increased copies of L1 retrotransposon and are associated with the increased transcription of its transcripts, ORF1 and ORF2. In addition, we have shown that a decrease in the methylation content of the L1 promoter is associated with increased retrotransposition and transcript expression.
L1 retrotransposition has been observed at different stages, including adult neurogenesis of the hippocampus, implying that there could be a possible modulation with age [19]. In the present study, we analyzed the potential role for confounding factors such as age, symptomatic onset, and sex, and did not find any correlation with them. Also, the lack of L1 content change in other tissues indicates that L1 copy number increase is not a global change and is possibly limited to brain tissue alone. These results raise the question of whether the L1 content changes in the brain are confined to an early neurodevelopment stage. Given that abnormalities during early brain development could lead to later clinical symptoms of neurological diseases [24], future studies directed towards analyzing the L1 content in neuronal development of R6/2 mice would be of great importance to understand the significance of this change.
Multiple mechanisms have been proposed to mediate alteration in the content of L1 in tissues. While DNA methylation is the most common mechanism, other methods, such as RNA interference, have also been shown to inhibit retrotransposition post-transcriptionally [25]. In addition, the APOBEC3 family has also been suggested to mediate L1 retrotransposition [26]. Our observations, although showing that changes in DNA methylation profiles drive retrotransposition and are correlated with increased expression, it is intriguing that these effects are mediated in a tissue-dependent manner. Future work directed towards the role of other mechanisms involved would provide more detailed information about L1 content regulation in specific tissues. In any case, our study provides the initial set of data on how DNA methylation changes regulate L1 content in HD samples.
Autophagy has been identified as one of the main degradation pathways for the removal of mutant protein aggregates [7]. Defective autophagy pathways have been shown to facilitate HD progression. Changes in mTOR signaling have been used as a readout for autophagy induction [10], but mTOR involvement in diverse cellular pathways and processes makes it difficult to delineate its specific relationship with autophagy and HD pathology. Recent studies have shown that AMPK alpha is a better readout for autophagy induction, and its activation can also ameliorate HD disease conditions in cells [10,11]. We have shown that increased expression of L1-ORF transcripts decreased the AMPK alpha expression. Additionally, our in vitro overexpression experiments suggest a direct involvement of L1-ORF in regulating these genes. These results suggest that L1 transposition, AMPK alpha and autophagy, and mutant HTT protein all function in a common pathway. We expect that these findings will promote future research on genomic instability and its relationship with mutant HTT protein and other signaling pathways to better understand the etiology of HD.
Conclusions
Our results provide the first evidence that increased L1 content is observed in HD, which leads to changes in its ORF expression and subsequent downstream signaling related to cell survival processes.
Footnotes
Source of support: This study was supported by the National Natural Science Foundation of China (NO. 81401054)
Conflict of interest
None.
References
- 1.Bates GP, Dorsey R, Gusella JF, et al. Huntington disease. Nat Rev Dis Prim. 2015;1:15005. doi: 10.1038/nrdp.2015.5. [DOI] [PubMed] [Google Scholar]
- 2.Saudou F, Humbert S. The biology of huntingtin. Neuron. 2016;89:910–26. doi: 10.1016/j.neuron.2016.02.003. [DOI] [PubMed] [Google Scholar]
- 3.Dayalu P, Albin RL. Huntington disease: Pathogenesis and treatment. Neurol Clin. 2015;33:101–14. doi: 10.1016/j.ncl.2014.09.003. [DOI] [PubMed] [Google Scholar]
- 4.Panksepp J. Affective neuroscience of the emotional BrainMind: evolutionary perspectives and implications for understanding depression. Dialogues Clin Neurosci. 2010;12(4):533–45. doi: 10.31887/DCNS.2010.12.4/jpanksepp. [DOI] [PMC free article] [PubMed] [Google Scholar]
- 5.Rüb U, Vonsattel JPV, Heinsen H, Korf H-W. The neuropathology of Huntington’s disease: Classical findings, recent developments and correlation to functional neuroanatomy. Adv Anat Embryol Cell Biol. 2015;217:1–146. [PubMed] [Google Scholar]
- 6.Neto JL, Lee J-M, Afridi A, et al. Genetic contributors to intergenerational CAG repeat instability in Huntington’s disease knock-in mice. Genetics. 2017;205:503–16. doi: 10.1534/genetics.116.195578. [DOI] [PMC free article] [PubMed] [Google Scholar]
- 7.Sarkar S, Rubinsztein DC. Huntington’s disease: Degradation of mutant huntingtin by autophagy. FEBS J. 2008;275:4263–70. doi: 10.1111/j.1742-4658.2008.06562.x. [DOI] [PubMed] [Google Scholar]
- 8.Zheng S, Clabough EBD, Sarkar S, et al. Deletion of the huntingtin polyglutamine stretch enhances neuronal autophagy and longevity in mice. PLoS Genet. 2010;6(2):e1000838. doi: 10.1371/journal.pgen.1000838. [DOI] [PMC free article] [PubMed] [Google Scholar]
- 9.Jiang Y, Chadwick SR, Lajoie P. Endoplasmic reticulum stress: The cause and solution to Huntington’s disease? Brain Res. 2016;1648:650–57. doi: 10.1016/j.brainres.2016.03.034. [DOI] [PubMed] [Google Scholar]
- 10.Walter C, Clemens LE, Müller AJ, et al. Activation of AMPK-induced autophagy ameliorates Huntington disease pathology in vitro. Neuropharmacology. 2016;108:24–38. doi: 10.1016/j.neuropharm.2016.04.041. [DOI] [PubMed] [Google Scholar]
- 11.Vázquez-Manrique RP, Farina F, Cambon K, et al. AMPK activation protects from neuronal dysfunction and vulnerability across nematode, cellular and mouse models of huntington’s disease. Hum Mol Genet. 2015;25:1043–58. doi: 10.1093/hmg/ddv513. [DOI] [PMC free article] [PubMed] [Google Scholar]
- 12.Lewandowski NM, Bordelon Y, Brickman AM, et al. Regional vulnerability in Huntington’s disease: FMRI-guided molecular analysis in patients and a mouse model of disease. Neurobiol Dis. 2013;52:84–93. doi: 10.1016/j.nbd.2012.11.014. [DOI] [PMC free article] [PubMed] [Google Scholar]
- 13.Hodges A, Strand AD, Aragaki AK, et al. Regional and cellular gene expression changes in human Huntington’s disease brain. Hum Mol Genet. 2006;15:965–77. doi: 10.1093/hmg/ddl013. [DOI] [PubMed] [Google Scholar]
- 14.Rosas HD, Goodman J, Chen YI, et al. Striatal volume loss in HD as measured by MRI and the influence of CAG repeat. Neurology. 2001;57:1025–28. doi: 10.1212/wnl.57.6.1025. [DOI] [PubMed] [Google Scholar]
- 15.Liu S, Du T, Liu Z, et al. Inverse changes in L1 retrotransposons between blood and brain in major depressive disorder. Sci Rep. 2016;6:37530. doi: 10.1038/srep37530. [DOI] [PMC free article] [PubMed] [Google Scholar]
- 16.Bundo M, Toyoshima M, Okada Y, et al. Increased L1 retrotransposition in the neuronal genome in schizophrenia. Neuron. 2014;81:306–13. doi: 10.1016/j.neuron.2013.10.053. [DOI] [PubMed] [Google Scholar]
- 17.Mavragani CP, Sagalovskiy I, Guo Q, et al. Expression of long interspersed nuclear element 1 retroelements and induction of type I interferon in patients with systemic autoimmune disease. Arthritis Rheumatol. 2016;68:2686–96. doi: 10.1002/art.39795. [DOI] [PMC free article] [PubMed] [Google Scholar]
- 18.Kilkenny C, Browne WJ, Cuthill IC, et al. Improving bioscience research reporting: The arrive guidelines for reporting animal research. Animals. 2013;4:35–44. doi: 10.1016/j.joca.2012.02.010. [DOI] [PubMed] [Google Scholar]
- 19.Muotri AR, Chu VT, Marchetto MCN, et al. Somatic mosaicism in neuronal precursor cells mediated by L1 retrotransposition. Nature. 2005;435:903–10. doi: 10.1038/nature03663. [DOI] [PubMed] [Google Scholar]
- 20.Cui J, Cai Y, Hu Y, et al. Epigenetic silencing of TPM2 contributes to colorectal cancer progression upon RhoA activation. Tumor Biol. 2016;37:12477–83. doi: 10.1007/s13277-016-5103-1. [DOI] [PubMed] [Google Scholar]
- 21.Yang S-X, Wei W-S, Ouyan Q-W, et al. Interleukin-12 activated CD8+ T cells induces apoptosis in breast cancer cells and reduces tumor growth. Biomed Pharmacother. 2016;84:1466–71. doi: 10.1016/j.biopha.2016.10.046. [DOI] [PubMed] [Google Scholar]
- 22.Subramanian B, Sun H, Yan P, et al. Mice with mutant Inf2 show impaired podocyte and slit diaphragm integrity in response to protamine-induced kidney injury. Kidney Int. 2016;90:363–72. doi: 10.1016/j.kint.2016.04.020. [DOI] [PMC free article] [PubMed] [Google Scholar]
- 23.Mangiarini L, Sathasivam K, Seller M, et al. Exon 1 of the HD gene with an expanded. 1996;87:493–506. doi: 10.1016/s0092-8674(00)81369-0. [DOI] [PubMed] [Google Scholar]
- 24.Bloom FE. Advancing a neurodevelopmental origin for schizophrenia. Arch Gen Psychiatry. 1993;50:224–27. doi: 10.1001/archpsyc.1993.01820150074008. [DOI] [PubMed] [Google Scholar]
- 25.Zhang H, Liu J, Tai Y, Zhang X, Zhang J. Identification and characterization of L1-specific endo-siRNAs essential for early embryonic development in pig. Oncotarget. 2017;8:23167–76. doi: 10.18632/oncotarget.15517. [DOI] [PMC free article] [PubMed] [Google Scholar]
- 26.Liang W, Xu J, Yuan W, et al. APOBEC3DE inhibits LINE-1 retrotransposition by interacting with ORF1p and influencing LINE reverse transcriptase activity. PLoS One. 2016;11:1–13. doi: 10.1371/journal.pone.0157220. [DOI] [PMC free article] [PubMed] [Google Scholar]
- 27.Liu W, Wang S, Wei S, et al. Receptor activator of NF-kappaB (RANK) cytoplasmic motif, 369PFQEP373, plays a predominant role in osteoclast survival in part by activating Akt/PKB and its downstream effector AFX/FOXO4. J Biol Chem. 2005;280:43064–72. doi: 10.1074/jbc.M509006200. [DOI] [PubMed] [Google Scholar]
- 28.Sobhan PK, Zhai Q, Green LC, et al. ASK1 regulates the survival of neuroblastoma cells by interacting with TLX and stabilizing HIF-1α. Cell Signal. 2017;30:104–17. doi: 10.1016/j.cellsig.2016.11.018. [DOI] [PubMed] [Google Scholar]
- 29.Thangarajan S, Ramachandran S, Krishnamurthy P. Chrysin exerts neuroprotective effects against 3-Nitropropionic acid induced behavioral despair – Mitochondrial dysfunction and striatal apoptosis via upregulating Bcl-2 gene and downregulating Bax – Bad genes in male wistar rats. Biomed Pharmacother. 2016;84:514–25. doi: 10.1016/j.biopha.2016.09.070. [DOI] [PubMed] [Google Scholar]
- 30.Solomon VR, Almnayan D, Lee H. Design, synthesis and characterization of novel quinacrine analogs that preferentially kill cancer over non-cancer cells through the down-regulation of Bcl-2 and up-regulation of Bax and Bad. Eur J Med Chem. 2017;137:156–66. doi: 10.1016/j.ejmech.2017.05.052. [DOI] [PubMed] [Google Scholar]
- 31.Karjalainen R, Pemovska T, Popa M, et al. JAK1/2 and BCL2 inhibitors synergize to counteract bone marrow stromal cell-induced protection of AML. Blood. 2017;130(6):789–802. doi: 10.1182/blood-2016-02-699363. [DOI] [PubMed] [Google Scholar]
- 32.Li G, Ying L, Wang H, et al. Rac1b enhances cell survival through activation of the JNK2/c-JUN/Cyclin-D1 and AKT2/MCL1 pathways. Oncotarget. 2016;7(14):17970–85. doi: 10.18632/oncotarget.7602. [DOI] [PMC free article] [PubMed] [Google Scholar]
- 33.Wong JC, Vo V, Gorjala P, Fiscus RR. Pancreatic-β-cell survival and proliferation are promoted by protein kinase G type Iα and downstream regulation of AKT/FOXO1. Diab Vasc Dis Res. 2017;14(5):434–49. doi: 10.1177/1479164117713947. [DOI] [PubMed] [Google Scholar]
- 34.Gilels F, Paquette ST, Beaulac HJ, et al. Severe hearing loss and outer hair cell death in homozygous Foxo3 knockout mice after moderate noise exposure. Sci Rep. 2017;7:1054. doi: 10.1038/s41598-017-01142-3. [DOI] [PMC free article] [PubMed] [Google Scholar]
- 35.Fang F, Peng T, Yang S, et al. Lycium barbarum polysaccharide attenuates the cytotoxicity of mutant huntingtin and increases the activity of AKT. Int J Dev Neurosci. 2016;52:66–74. doi: 10.1016/j.ijdevneu.2016.05.004. [DOI] [PubMed] [Google Scholar]
- 36.Romorini L, Garate X, Neiman G, et al. AKT/GSK3β signaling pathway is critically involved in human pluripotent stem cell survival. Sci Rep. 2016;6:35660. doi: 10.1038/srep35660. [DOI] [PMC free article] [PubMed] [Google Scholar]


