Abstract
The atomic force microscope (AFM) is a powerful tool for imaging individual biological molecules attached to a substrate and placed in aqueous solution. At present, however, it is limited by the speed at which it can successively record highly resolved images. We sought to increase markedly the scan speed of the AFM, so that in the future it can be used to study the dynamic behavior of biomolecules. For this purpose, we have developed a high-speed scanner, free of resonant vibrations up to 60 kHz, small cantilevers with high resonance frequencies (450–650 kHz) and small spring constants (150–280 pN/nm), an objective-lens type of deflection detection device, and several electronic devices of wide bandwidth. Integration of these various devices has produced an AFM that can capture a 100 × 100 pixel2 image within 80 ms and therefore can generate a movie consisting of many successive images (80-ms intervals) of a sample in aqueous solution. This is demonstrated by imaging myosin V molecules moving on mica (see http://www.s.kanazawa-u.ac.jp/phys/biophys/bmv_movie.htm).
One of the advantages of the atomic force microscope (AFM) (1) is its capacity to image individual biomolecules in, say, a buffered solution containing ions at physiological concentrations (2, 3). Such capacity suggests that the instrument can be used to record the dynamic behavior of such molecules. In practice, however, only very slow processes can be recorded (2, 4–6), because commercially available AFMs require minutes to form an acceptable image, and many interesting biological processes occur at much higher rates. To understand, and overcome, the factors that limit the scanning rate of an AFM, we begin by considering relations between the characteristics of the constituting components.
We consider only the “tapping mode” of AFM operation (Digital Instruments, Santa Barbara, CA). This is the mode suitable for imaging biological macromolecules, because vertical oscillation of the cantilever at (or near to) its resonance frequency reduces lateral forces between the tip and the sample (7). The oscillating tip briefly taps the surface at the bottom of each swing, resulting in a decrease in oscillation amplitude. During the x-y scan of the sample stage a feedback loop (see below) keeps this decrease (and hence the tapping force) constant; this is necessary for minimizing the deformation of soft samples. The error signal—the difference between a preset signal and the rms amplitude of the cantilever—is fed into a proportional-integral-differential (PID) feedback circuit. The PID output is amplified and then sent to the z-piezo actuator; this is repeated until the error signal returns to zero. For the three-dimentional movement of the sample stage to follow the sample topography accurately, the bandwidth of the feedback loop should be comparable to, or larger than, the frequency determined by the x-y scan velocity and the apparent width of the features on the surface. To increase the imaging bandwidth, all elements in the feedback loop have to be optimized. The first element in this loop is the cantilever. A high resonance frequency in liquid is required to generate a high tapping frequency; also required is a low spring constant, so as to minimize the tip-sample interaction force. These conflicting requirements can be met only with small cantilevers (8, 9). Every circuit in the feedback loop must have a wide bandwidth. The last element, the z-scanner, is a piezo actuator with a high resonance frequency, which in assembly must react very quickly without unwanted mechanical vibrations. Viani et al. (10, 11), using the tapping mode, have used small cantilevers with resonance frequencies ≈150 kHz to image DNA and GroEL–GroES complexes on mica, in liquid. Their frame rate was less than 1 s−1 because they used a conventional piezo-tube with a resonance frequency of ≈15 kHz in the z direction, together with feedback electronics of a limited bandwidth. Sulchek et al. (12), using a cantilever with an integrated zinc oxide piezo actuator (13), achieved an imaging bandwidth of 38 kHz and frame rate of ≈4/sec. However, their cantilever was too stiff to image soft samples. In the AFM assembly described below we have tried to optimize each element for its use in imaging samples in solution, using fast tapping operation, and an objective lens type of deflection detection device suitable for small cantilevers. Assembly of these selected components results in an imaging bandwidth of ≈60 kHz (fastest among the high-speed AFMs that use the tapping mode and are suitable for examining soft samples in liquid). Combination of this high speed with zooming-in capability (reduction of the scan area to 240 × 240 nm2) allows viewing of liquid samples of proteins on mica at a rate of 12.5 s−1.
Test Sample, Components, and Imaging
Sample Preparation.
For test purposes, myosin V was extracted from chick brains and purified as described (14). Myosin V stored at 0°C in buffer A (25 mM KCl/25 mM Imidazole, pH 7.6/2 mM MgCl2/1 mM EGTA/0.2 mM DTT) was diluted to 7 nM with buffer A. A drop (≈2 μl) of myosin V solution was placed on freshly cleaved mica (1 mm in diameter) for 3 min, rinsed with buffer A to remove unattached myosin V, and then imaged in 2 mM ATP plus buffer A without DTT.
Cantilevers.
The cantilevers, made from silicon nitride using micromachining techniques, were 140 nm thick, 2 μm wide, and 9–11 μm long. The rear side of the cantilevers was coated with gold 20 nm thick. All surfaces of the cantilevers were further coated with osmium, about 2 nm thick. The tips were grown by electron-beam deposition (15), with growth rate of about 5 nm/s. The tip length was adjusted to ≈1.0 μm. The radius of the tip end was 6–8 nm. The mechanical properties of the cantilevers were tested by measuring the spectra of their thermal motion. The resonance frequencies were 1.3–1.8 MHz in air, and 450–650 kHz in water, and the spring constants were estimated to be 150–280 pN/nm.
Deflection Detection System.
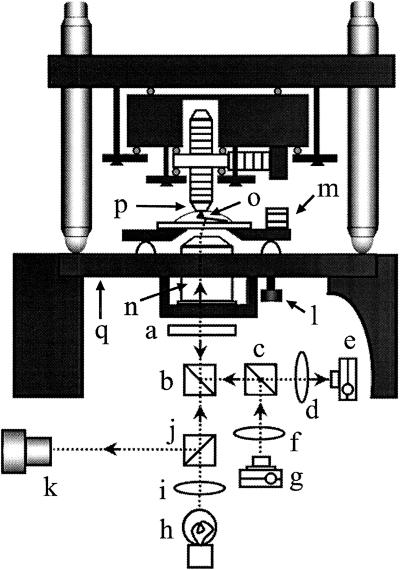
We used an optical lever method to measure the deflection of a cantilever. The optics must generate a very small incident beam spot, because our cantilevers for rapid scanning are much smaller than commercially available cantilevers. Schäffer et al. (16) designed an AFM using optics for small cantilevers, wherein a laser beam reflected from the rear side of the cantilever is collected and collimated with the same lenses as are used for focusing the incident laser beam onto the cantilever. We used the same method, but instead of using single lenses we used an objective lens (CFI Plan Fluor ELWD 20xC, Nikon) with a long working distance of 8 mm. As shown in Fig. 1, our AFM is integrated with an inverted type of optical microscope (IX50, Olympus, Tokyo). The focusing objective lens also is used to view the cantilever and the focused laser spot with the optical microscope. The focused spot is 2–3 μm in diameter. In the design of Schäffer et al., the entire optical train is tilted from the vertical so that the incident beam is normal to the plane of the cantilever. Instead of this, we used a much simpler design wherein the vertical laser beam is incident on an off-centered position of the objective lens to make the outgoing beam axis normal to the plain of the cantilever. The incident and reflected light beams were separated by polarization using a beam splitter and a quaterwave plate. The laser beam, reflected, collimated, and then slightly converged, is fed into the two closely spaced photodetectors (S2721–02, Hamamatsu Photonics, Hamamatsu City, Japan) whose photocurrents are sent to a differential amplifier with a wide bandwidth (2.5 MHz).
Figure 1.
Schematic drawing of the AFM head integrated with an inverted type of optical microscope. (a) λ/4 Plate. (b) Dichroic mirror. (c) Polarization beam splitter. (d) Focusing lens. (e) Split photodiode. (f) Collimator lens. (g) Laser diode. (h) Illumination lamp. (i) Collimator lens. (j) Half mirror. (k) Viewing system of the optical microscope. (l) Screw for adjusting the cantilever height. (m) Piezo for exciting cantilever. (n) Objective lens. (o) Cantilever. (p) Sample stage. (q) Sample stage of the optical microscope. All of the components (a–g and n) of the deflection detection system are hung down from the sample stage of the optical microscope. The scanner (see Fig. 2 also) is mounted on the same sample stage. The collimated laser beam is reflected up, incident on the objective lens at an off-centered position. The outgoing beam thus tilted about 10o from the vertical plane is focused onto the cantilever whose plane is tilted about 10o from the horizontal plane. The beam reflected at the cantilever is collimated by the objective lens, separated from the incident beam by the polarization beam splitter with λ/4 wave plate, and reflected onto the split photodiode. The optical microscope allows us to view the cantilever and the focused laser spot. The specimen is supported at the bottom of the sample stage (p), and an inverted cantilever (o) probes the specimen from below.
Scanner.
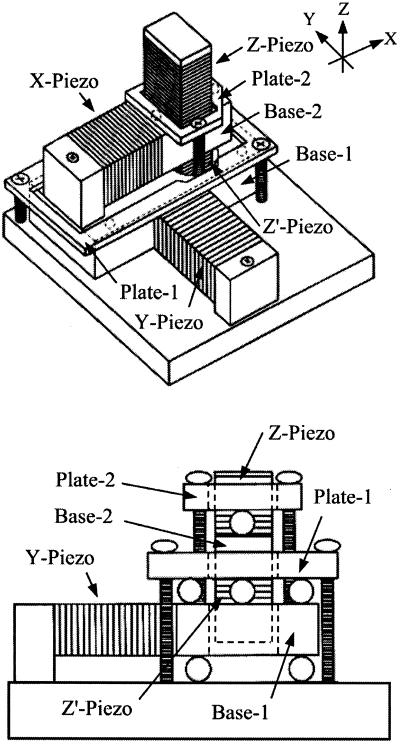
The scanner is shown in Fig. 2. Stack piezoelectric actuators (AE0203D04, Tokin, Tokyo) are used in this scanner. They have the resonance frequency of 260 kHz in free oscillation, their maximum displacement is 4.5 μm, and their capacitance is 90 nF. The y-piezo displaces base-1 on which the x- and z-scanners are mounted, while the x-piezo displaces base-2 on which the z-scanner is mounted. The z-scanner has two z-piezo actuators placed in the opposite direction to one another (the reason is described below). Base-1 is glued to the y-piezo, and base-2 is glued to the x- and z-piezo actuators. A sample stage is attached to one of the z-piezo actuators via a thin layer of vacuum grease. When the z-piezo is displaced quickly, hydrodynamic force is generated as the reaction from the sample solution to the sample stage. To minimize this reactive force, a glass of a circular-trapezoid shape with a small top surface of 1-mm diameter is used as the sample stage. To hold the mass balance, a dummy stage that has the same mass as the sample stage was attached to the other z-piezo actuator. Base-1 sits on three steel ball bearings, and its top plane is pushed down by plate-1 through three steel ball bearings. The balls are 1 mm in diameter. Base-2 is also held between base-1 and plate-2 in a similar manner. This way of holding base-1 and base-2 between two flat surfaces reduces vibrations of these bases in the z-direction and allows smooth displacements in the desired directions. However, these arrangements are not sufficient to minimize such vibrations. Quick displacements of a z-piezo exert impulsive forces on base-2, which causes vibrations of base-2, and in turn vibrates the z-piezo itself. Such impulsive forces are countered by the simultaneous displacements of the two z-piezo actuators of the same length, in the counter direction.
Figure 2.
Scanner assembly. (Lower) The side view when looked at the scanner from +x to −x. The scanner has a two-layered structure that guarantees that the x-scan and the y-scan do not interfere with each other. For structural details, see the text.
Electronics.
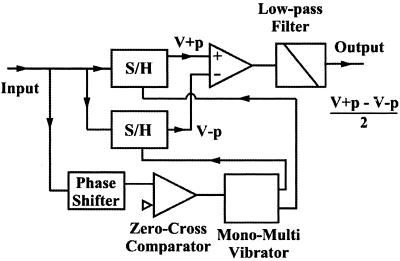
The custom-made piezo-drive amplifiers have a 1-MHz bandwidth for a 90-nF capacitive load, in 2 Vp-p output. These amplifiers are used to drive the z-piezo actuators and to drive another piezo actuator (custom-made; with a 2-MHz resonance frequency) that excites the cantilever in the tapping mode AFM operation. The x- and y-piezo actuators are driven by amplifiers (HJPZ-0.15Px3, Matsusada Precision, Tokyo) with a 25-kHz bandwidth for a 90-nF capacitive load, in 100 Vp-p output. The PID and two types of rms-to-dc circuits were custom-made. The bandwidth of the PID circuit is 300 kHz. An analog type of rms-to-dc converter with a fourth-order low-pass filter can accept up to a 1-MHz input signal and requires five waves of the signal to output an accurate rms value; in other words, five tip-sample contacts are needed to measure the tapping amplitude. To increase the conversion rate, we made a novel circuit with 1-MHz bandwidth, which requires only one wave to generate the amplitude signal (Fig. 3). The input (source) signal is divided into two. One is sent to two sample/hold (S/H) circuits. The other is sent to a 90o phase shifter, and its output is fed to a zero-cross comparator to generate rectangular wave signals. These rectangular signals are sent to a mono-stable multivibrator to generate pulses at the top and bottom peaks of the input source signal. The pulses from the mono-stable multi vibrator are used as triggers to hold the source signal by the S/Hs. The outputs from the two S/Hs are sent to a differential amplifier to generate output that represents the amplitude of the source signal. The signal generation for the x-y scan, and the data sampling are made in different ways. One is made by using a digital-signal-processor (DSP) control board integrated with A/D and D/A converters. This allows flexible controls for AFM imaging, but its operation rate is limited because of our slow DSP system. The other is made by using an external circuit that generates analog signals for the x-y scan and timing pulses for data acquisition, and by using a fast A/D board for data sampling. This system allows a fast operation (the pixel clock can go up to 1 MHz).
Figure 3.
Circuit for fast amplitude measurement. The output sinusoidal signal from the split-photodiode amplifier is fed to this circuit. The output of this circuit provides the amplitude of the sinusoidal input signal at periodicity of the input signal. For details, see the text.
AFM Head Assembly.
The sample stage of the inverted type of optical microscope was replaced with a stainless steel plate 10 mm thick. Every mechanical and optical component of the AFM is mounted on or hung from this plate. This design reduces relative movement between these components, despite vibrations of the optical microscope itself, which is susceptible to the ambient sounds or mechanical noises because of its low resonance frequency. Because we use confocal optics for focusing the laser beam onto a cantilever, as well as for viewing the cantilever and the incident spot with the optical microscope, the rear side of the cantilever must face downward (and hence, the tip must stick upward). This setup is opposite to that widely used in commercial AFMs. The cantilever is attached to a transparent glass plate via a short cantilever holder glued to the glass plate. The scanner, with a sample stage facing downward, is mounted over the cantilever (see Fig. 1).
Imaging Bandwidth.
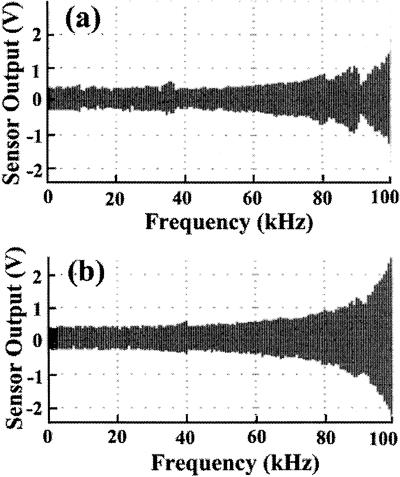
When a piezo actuator is oscillated with its one end being fixed, its resonance frequency is half the resonance frequency when it is oscillated with both ends free. So, the z-piezo actuators must have a resonance frequency of 130 kHz, without considering the mass attached to the free end of the actuators. The z-scanner in the whole scanner assembly must have a lower mechanical resonance frequency, considering the mass (of the order of g), the size (of the order of mm), and the Young's modulus (of the order of 1010–1011 N/m2) of the materials such as super invar steel and resin used in the piezo actuators. Therefore, the z-scanner is the component that is most difficult to optimize for high-speed scanning. We tested the z-scanner's ability to follow a frequency modulation of the driving signal, without a feedback system, while the tip of a cantilever remained in contact with a mica surface. The sensor output is shown as a function of the driving frequency (Fig. 4). When the z-piezo for the counterbalance was not operating, the z-scanner showed resonance vibrations around 8.5 kHz, 34 kHz, and 100 kHz (Fig. 4a). The resonance at 100 kHz is caused by the resonance of the z-piezo actuator itself. The extra amplitudes gained by resonance at the lower frequencies are, however, relatively small compared with the oscillation amplitude without resonance, indicating the value of our scanner design in suppressing the resonance vibrations. When the counterbalancer was operating (Fig. 4b), the extra amplitudes at the lower resonance frequencies were reduced, and we further noticed much less variation in the amplitude over frequencies lower than 60 kHz, compared with those without counterbalance.
Figure 4.
Oscillation of the z-scanner as a function of the driving frequency. The amplitude of the driving signal was kept constant while sweeping its frequency. The data were obtained with (b) or without (a) operating the z-piezo for the counterbalance.
The bandwidth of the whole feedback loop system was assessed by measuring the system's ability to follow a modulation of the set point while the tip was in contact with a mica surface (12). Sinusoidal signals were sent to the set point input, and the output of the PID was fed to a lock-in amplifier to measure the amplitude and the phase relative to the input sinusoidal signals. The output amplitude was almost constant up to 60 kHz, and then gradually decreased with increasing frequency. This gradual decrease is caused by the resonance oscillation of the z-scanner around 100 kHz. The phase difference was zero over the frequencies tested (up to 100 kHz). These results indicate that the component that has the lowest bandwidth in the system is the z-scanner, and therefore, the bandwidth of the system is about 60 kHz.
The minimum imaging time (t) per frame with N2 pixels of size p is given by
 |
1 |
where fs is the bandwidth of the feedback loop, and w is the apparent width of features on the surface. w is given by convolution of the tip with radius R and the sample with radius r, and is approximated as w =  (17). A scan range of 200 nm and 1002 pixels, thus a pixel size of 2 nm, can be scanned in 33 ms for w = 10 nm and fs = 60 kHz. Because the corresponding pixel time is 1.65 μs, this scan condition requires the tapping and data sampling frequencies to be equal to, or larger than 606 kHz (the reciprocal of the pixel time). One step of the x-y scan has to be completed within this pixel time.
Imaging.
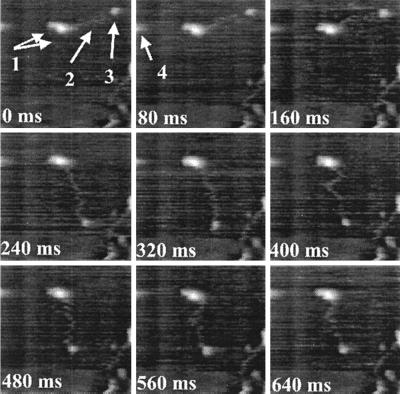
We examined whether imaging can really be made at (or near to) the maximum rate expected above. Myosin V directly attached to mica, in solution containing 2 mM ATP, was imaged successively (240-nm scan range; 1002 pixels) for 4 sec (50 frames). The scan rate was 1.25 kHz, corresponding to a tip speed of 0.6 mm/s, and the frame rate was 12.5 s−1. In the myosin V molecule located on the center of the images (Fig. 5), its two head/neck regions, one long tail, and the globular tail end are clearly resolved. The tail seems to be about 100 nm long, longer than a previous estimate based on its primary structure and the electron microscopic images (18). The angle of the long tail relative to the head/neck regions changed between the eighth and ninth frames (see the third and fourth images in Fig. 5). After this quick change, the tail and the tail end are slowly moving. The reconstructed movie and the other movies that dramatically show the changes in the locations of the myosin heads, neck, and tail regions can be viewed at http://www.s.kanazawa-u.ac.jp/phys/biophys/bmv_movie.htm. We tried faster imaging (25 frames/sec for 240-nm area with 100 × 100 pixels), but it was not successful because of the inertia of the mass attached to the free end of the x-piezo. This inertia produces mirror images on the left half area of the total image. Note that even in Fig. 5 mirror images are noticed (indicated by arrow-4 in the second image).
Figure 5.
Successive images of myosin V on mica in buffer solution. The same area of 240 × 240 nm2 was imaged 50 times with 100 × 100 pixels. Only nine successive images are shown. The tip speed is 0.6 mm/s (scan rate, 1.25 kHz), and the frame rate is 12.5/s. The tapping frequency is 620 kHz, the amplitude of the cantilever's free oscillation is 12 nm, and the set point is about 11.5 nm. In the first image, the head/neck regions, the long tail, and the globular tail end are marked with arrow 1, arrow 2, and arrow 3, respectively. A mirror image of one of the head region is marked with arrow-4 in the second image. The still panels here appear noisier than the dynamic images in the movie on the web site http://www.s.kanazawa-u.ac.jp/phys/biophys/bmv_movie.htm. The two head/neck regions are overlapped in the z direction, and therefore, they are not well resolved and do not show a typical “Y” shape. Dynamic images of myosin V that show “Y” shape are also presented at http://www.s.kanazawa-u.ac.jp/phys/biophys/bmv_movie.htm.
Discussion
The components that limit the imaging rate of our AFM are first the x-scanner, and second the z-scanner and the cantilever. An upper limit of the imaging rate that is reachable by improving these components can be estimated. We used super invar steel for base-2. To minimize the inertia of the mass, we may be able to use hard ceramics for base-2, which can reduce the mass to a quarter, and therefore can increase the imaging rate four times. Cantilevers smaller than those we made can be constructed. For instance, a silicon nitride cantilever, 42 nm thick, 6 μm long, and 2 μm wide, may be possible, although this will be probably the smallest size, considering how it has to be used in practice. This small cantilever with a gold coat will have the likely resonance frequency of ≈2.5 MHz in air and the spring constant of ≈200 pN/nm. The resonance frequency in water must be around 1.2 MHz, about two times larger than that of our present cantilevers. In the tapping mode operation with this cantilever the pixel imaging time can be reduced to 0.83 μs, which corresponds to 17 ms of the imaging time, for 1002 pixels. If the second harmonic oscillation can be used, the imaging time can be reduced to 8.3 ms. The speed limit of our z-scanner arises from the resonance frequency of the piezo actuator. Piezo actuators with higher resonance frequency are available, but their maximum displacement is shorter. Considering the necessary displacement size, say, 1 μm, the maximum resonance frequency will be about 1 MHz when one end of such a piezo actuator is fixed. This is about seven times larger than that used in this study. Considerations made here suggest that an upper limit of the imaging time seems to be 10∼20 ms, as long as we use the optical deflection detection method as well as the tapping mode operation.
The long tail of a myosin V molecule changed its orientation in less than ≈30 ms (just before the change, the tail end located at y ≈ 214 nm (i.e., at almost the end of the frame scan), while just after the change the tail end located at y ≈ 64 nm). On the other hand, after the quick change the tail moved slowly. This marked contrast suggests that this quick orientational change may be driven by ATP. However, at present we must reserve judgment, because we could not observe repeated orientational change with the same myosin V molecule. To decide this, we have to record images for a much longer time, because the ATPase rate of myosin V alone is very small (≈0.05/s). At present our AFM system cannot store many images at once. In the near future we may be able to resolve this problem.
In life science, it has been a dream to view the nanometer-scale dynamic behavior of individual biopolymers in solution. The capacity of acquiring successive images every 80 ms will allow a large expansion in the scope of biological processes that can be examined in real time. In the near future we should be able to see the behavior of processive motors [such as kinesin (19) and myosin V (20)] walking along their tracks, or of molecular chaperones assisting a polypeptide chain to fold (21). Such direct observations will be a great help in understanding the mechanisms by which biomolecular machines operate.
Acknowledgments
We thank Keichi Mukai and Ryuki Tsunekawa for their help in making the AFM head, Takeshi Sakamoto and Tatsuya Kinosita for preparing myosin V, and Professor Manuel Morales (University of the Pacific) for his continuous encouragement and for reviewing this manuscript. This work was supported by the Proposal-Based New Industry Creative Type Technology R&D Promotion Program from the New Energy and Industrial Technology Development Organization (NEDO) of Japan to T.A.
Abbreviations
- AFM
atomic force microscope
- PID
proportional-integral-differential: S/H, sample/hold
References
- 1.Binnig G, Quate C F, Gerber C. Phys Rev Lett. 1986;56:930–933. doi: 10.1103/PhysRevLett.56.930. [DOI] [PubMed] [Google Scholar]
- 2.Drake B, Prater C B, Weisenhorn A L, Gould S A, Albrecht T R, Quate C F, Cannell D S, Hansma H G, Hansma P K. Science. 1989;243:1586–1589. doi: 10.1126/science.2928794. [DOI] [PubMed] [Google Scholar]
- 3.Bustamante C, Rivetti C, Keller D J. Curr Opin Struct Biol. 1997;7:709–716. doi: 10.1016/s0959-440x(97)80082-6. [DOI] [PubMed] [Google Scholar]
- 4.Guthold M, Bezanilla M, Eire D A, Jenkins B, Hansma H G, Bustamante C. Proc Natl Acad Sci USA. 1994;91:12927–12931. doi: 10.1073/pnas.91.26.12927. [DOI] [PMC free article] [PubMed] [Google Scholar]
- 5.Kassas S, Thomson N H, Smith B L, Hansma H G, Zhu X, Guthold M, Bustamante C, Kool E T, Kashlev M, Hansma P K. Biochemistry. 1997;36:461–468. doi: 10.1021/bi9624402. [DOI] [PubMed] [Google Scholar]
- 6.Oberleithner H, Scneider S, Bustamante J-O. Pflügers Arch Eur J Physiol. 1996;432:839–844. doi: 10.1007/s004240050206. [DOI] [PubMed] [Google Scholar]
- 7.Putman C A J, Van der Werf K O, De Grooth B G, Van Hulst N F, Greve J. Appl Phys Lett. 1994;64:2454–2456. [Google Scholar]
- 8.Schäffer T E, Viani M, Walters D A, Drake B, Runge E K, Cleveland J P, Wendman M A, Hansma P K. Proc SPIE. 1997;3009:48–52. [Google Scholar]
- 9.Walters D A, Viani M, Paloczi G T, Schäffer T E, Cleveland J P, Wendman M A, Gurley G, Elings V, Hansma P K. Proc SPIE. 1997;3009:43–47. [Google Scholar]
- 10.Viani M B, Schäffer T E, Paloczi G T, Pietrasanta L I, Smith B L, Thompson J B, Richter M, Rief M, Gaub H E, Plaxco K W, et al. Rev Sci Instrum. 1999;70:4300–4303. [Google Scholar]
- 11.Viani M B, Pietrasanta L I, Thompson J B, Chand A, Gebeshuber I C, Kindt J H, Richter M, Hansma H G, Hansma P K. Nat Struct Biol. 2000;7:644–647. doi: 10.1038/77936. [DOI] [PubMed] [Google Scholar]
- 12.Sulchek T, Hsieh R, Adams J D, Minne S C, Quate C F, Adderton D M. Rev Sci Instrum. 2000;71:2097–2009. [Google Scholar]
- 13.Minne S C, Manalis S R, Quate C F. Appl Phys Lett. 1995;67:3918–3920. [Google Scholar]
- 14.Cheney R E. Methods Enzymol. 1998;298:3–18. doi: 10.1016/s0076-6879(98)98003-x. [DOI] [PubMed] [Google Scholar]
- 15.Keller D J, Chih-Chung C. Surf Sci. 1992;268:333–339. [Google Scholar]
- 16.Schäffer T E, Cleveland J P, Ohnesorge F, Walters D A, Hansma P K. J Appl Phys. 1996;80:3622–3627. [Google Scholar]
- 17.van Noort S J T, van der Werf K O, de Grooth B G, Greve J. Biophys J. 1999;77:2295–2303. doi: 10.1016/S0006-3495(99)77068-2. [DOI] [PMC free article] [PubMed] [Google Scholar]
- 18.Cheney R E, O'Shea M K, Heuser J E, Coelho M V, Wolenski J S, Espreafico E M, Forscher P, Larson R E, Mooseker M S. Cell. 1993;75:13–23. doi: 10.1016/S0092-8674(05)80080-7. [DOI] [PubMed] [Google Scholar]
- 19.Vale R D, Funatsu T, Pierce D W, Romberg L, Harada Y, Yanagida T. Nature (London) 1996;380:451–453. doi: 10.1038/380451a0. [DOI] [PMC free article] [PubMed] [Google Scholar]
- 20.Sakamoto T, Amitani I, Yokota E, Ando T. Biochem Biophys Res Commun. 2000;272:586–590. doi: 10.1006/bbrc.2000.2819. [DOI] [PubMed] [Google Scholar]
- 21.Saibil H. Curr Opin Struct Biol. 2000;10:251–258. doi: 10.1016/s0959-440x(00)00074-9. [DOI] [PubMed] [Google Scholar]


