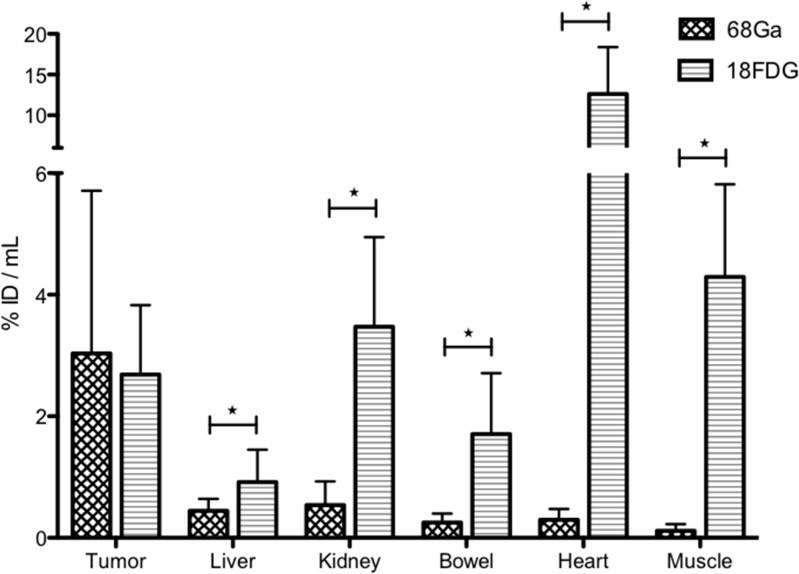
Figure 2. PET images analysis.
Comparison of uptakes obtained in 68Ga-pPET and 18FDG PET. For normal organs, values are obtained from a ROI drafted around the organ (for well- limited organs such as heart and kidney) or on the organ (for poorly-limited organs, such as liver, bowel or muscle) in each of the 2 selected images (most intense uptake). For tumors, the highest uptake in the tumor is obtained from a constant ROI of 2 mm3 drawn around the hottest spot.

