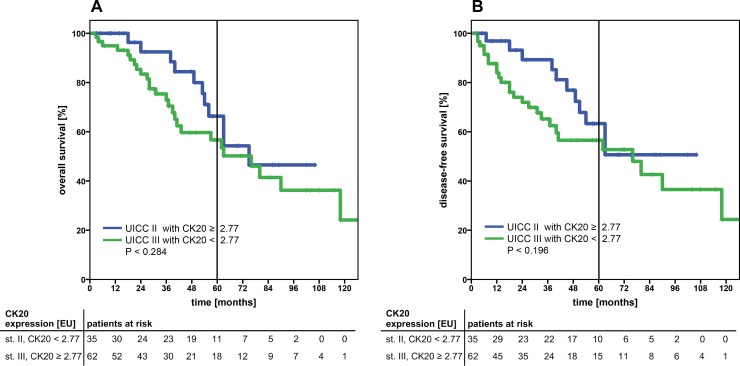
Figure 2.
Kaplan-Meier survival analysis of the cumulative overall survival (A) and disease-free survival (B) of patients with UICC stage II and high CK20 mRNA expression levels (≥ 2.77 EU cut-off) compared to UICC stage III patients with low CK20 expression levels (< 2.77 EU). Both patient sub-cohorts showed a comparable cumulative survival. The tables under each plot show the number of patients at risk at each time point in the graph. The 5-year survival is indicated by thick vertical lines. P-values were calculated by log-rank tests. CK20: cytokeratin 20; EU: expression units.

