. 2018 Jun 19;7:e34202. doi: 10.7554/eLife.34202

Figure 1. Protein turnover in neurons.

(A) Protein half-lives were determined by a dynamic SILAC approach in combination with MS. Cells were grown for 18–19 days in medium containing natural amino acids (‘light’) and then switched to a medium containing heavy isotopically labelled arginine (R10) and lysine (K8). Upon the medium change, the ‘heavy’ amino acids were incorporated into newly synthesized proteins, whereas the fraction of ‘light’ pre-existing proteins decayed over time. The cells were harvested 1, 3 and 7 days after the medium change as well as just before the medium change (t0) and the fractions of newly synthesized proteins and pre-existing proteins were determined by MS. Protein half-lives were determined based on first order exponential fitting of the fraction of pre-existing proteins over time. (B) Distribution of protein half-lives in primary hippocampal cultures ranged from <1 day to >20 days.

Figure 1.

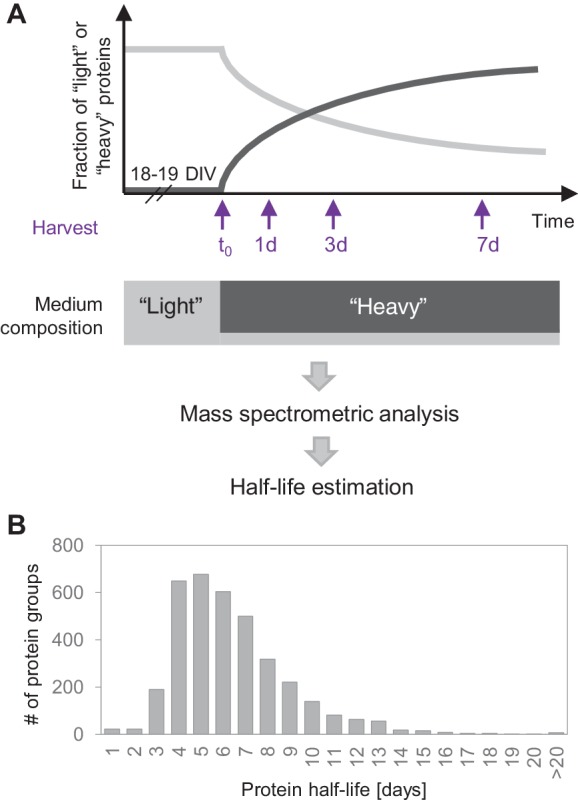
Figure 1—figure supplement 1. Data processing workflow of dynamic SILAC samples.

Figure 1—figure supplement 1.

Flow chart explaining data processing, filtering and analysis of mass spectrometric data of dynamic SILAC samples.
Figure 1—figure supplement 2. Accuracy of turnover estimation.

Figure 1—figure supplement 2.

Protein half-lives were determined based on a linear fit of the fraction of pre-existing proteins over time. Rate constants k (negative value of the slope of the fit) and the SE (standard error of the slope) are shown for each protein group. (A) Mixed cultures, (B) neuron-enriched cultures and (C) glia-enriched cultures. The mean SE of the slopes for each culture type is shown as a black line. Coefficients of determination (R2) of the linear fits for (D) mixed cultures, (E) neuron-enriched cultures and (F) glia-enriched cultures. The boxes represent the upper quartile (Q3), median and lower quartile (Q1) and the antennas represent the upper limit (maximum) and the lower limit (Q1-1.5*IQR).
Figure 1—figure supplement 3. Comparison to in vivo study.

Figure 1—figure supplement 3.

Comparison of protein half-lives determined in our in vitro study (mixed cultures) and half-lives reported in a previous in vivo study in mouse brain. Half-lives for 390 genes (determined in both studies) are significantly correlated (Spearman rank correlation = 0.62; p<0.001).
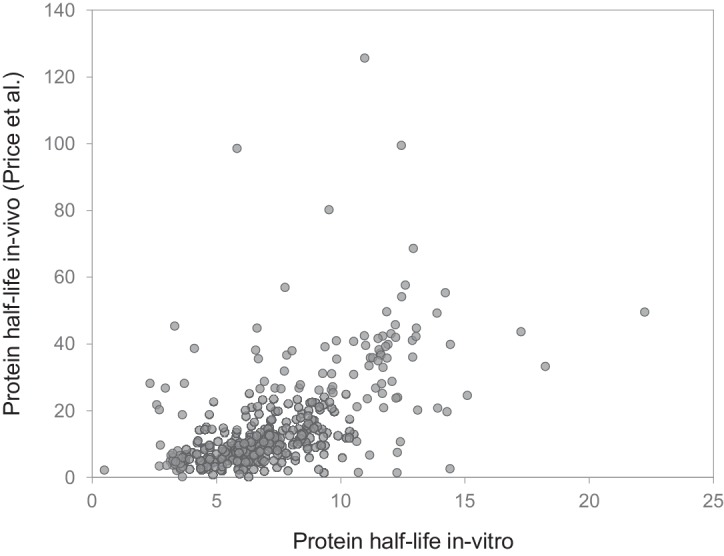
Figure 1—figure supplement 4. Protein decay clusters.

Figure 1—figure supplement 4.

The decay curves of all protein groups (from mixed, neuron-enriched and glia-enriched cultures) were assigned to one of 20 clusters using hierarchical clustering (K-Means method). Decay curves for individual protein groups are shown as grey lines, and the average decay behavior for each cluster is shown as bold black line. Proteins groups assigned to cluster 6 and 7 are excluded from half-life determination, since most of the pre-existing proteins was degraded already after 1 day resulting in inaccurate exponential fitting. For down-stream analysis, these proteins were assigned a half-life <1 day. Protein groups in cluster 20 are long-lived proteins. Due to the minimum changes during the measurement time course of 7 days, their half-lives (determined by exponential fitting) are only rough estimates.