
Figure 6. Protein turnover rates of different cell types in different cellular environments.
(A) Different cell culture types and environments for which protein turnover was investigated. (B) Protein half-life distributions for different primary neuronal culture types (mixed, neuron-enriched and glia-enriched cultures). (C and D) show protein-wise half-life comparisons for proteins in glia-enriched versus mixed cultures as well as neuron-enriched versus mixed cultures. Proteins with significantly regulated turnover rates (p<0.05 at≥2 of 3 time points, Bonferroni corrected) are highlighted in color. (E) GO over-representation analysis of proteins with significantly faster turnover rates in mixed cultures compared to neuron-enriched cultures. Selected over-represented GO terms (p<0.05) and their log2-fold over-representation are shown. (F) Same as E for proteins with significantly faster turnover rates in neuron-enriched cultures compared to mixed cultures. (G) Proposed mechanism to explain the increased turnover of glycolytic enzymes in neuron-enriched cultures. In the absence of glia cells, neurons are not supplied with lactate via the astrocyte-neuron-lactate-shuttle and hence pyruvate production relies on glycolysis exclusively. Glycolytic enzymes might be used more frequently, damaged more frequently and replaced earlier. (H) Selected proteins with significantly faster turnover rates in neuron-enriched cultures that are involved in synaptic processes. (I) Protein-wise turnover comparisons for proteins from neuron-enriched cultures maintained with or without conditioned medium. Proteins with significantly regulated turnover rates (p<0.05, Bonferroni corrected) are highlighted in color.

Figure 6—figure supplement 1. Comparison of different culture types.

Figure 6—figure supplement 2. Faster protein turnover of glycolytic enzymes in neuron-enriched cultures.
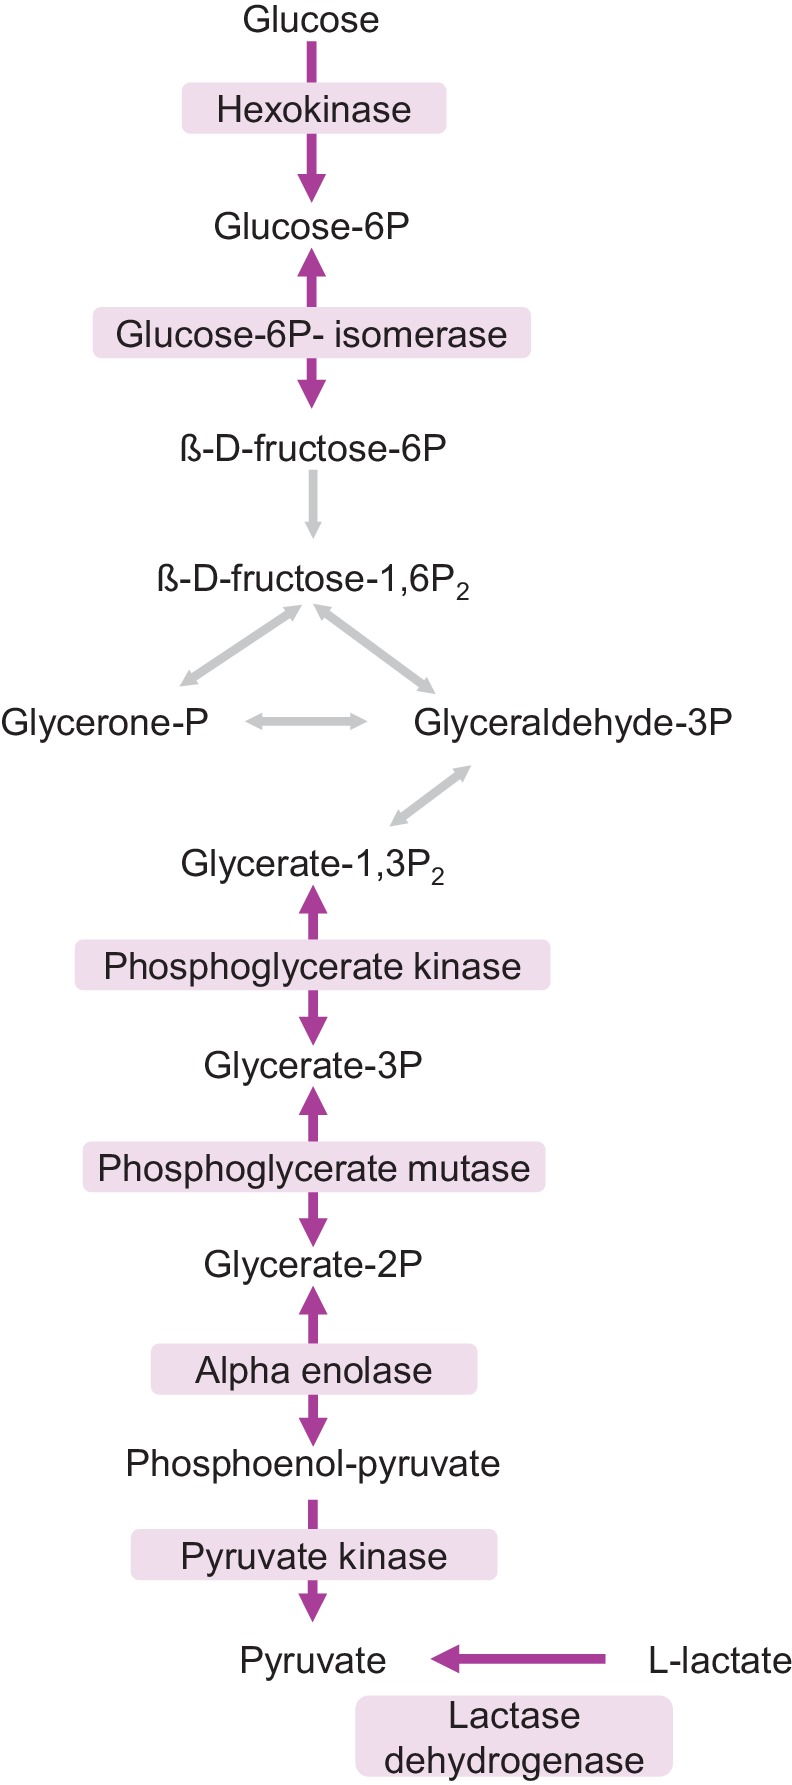
Figure 6—figure supplement 3. Comparison of neuron-enriched cultures with and without conditioned medium.

Figure 6—figure supplement 4. Proteomic comparison of glia-enriched cultures prepared from cortex and hippocampus.

Figure 6—figure supplement 5. Estimation of cell division in primary cultures.
