

Abstract
Disrupted polyamine metabolism with elevated putrescine is associated with neuronal dysfunction. Manganese (Mn) is an essential nutrient that causes neurotoxicity in excess, but methods to evaluate biochemical responses to high Mn are limited. No information is available on dose-response effects of Mn on putrescine abundance and related polyamine metabolism.
The present research was to test the hypothesis that Mn causes putrescine accumulation over a physiologically adequate to toxic concentration range in a neuronal cell line. We used human SH-SY5Y neuroblastoma cells treated with MnCl2 under conditions that resulted in cell death or no cell death after 48 h. Putrescine and other metabolites were analyzed by liquid chromatography-ultra high-resolution mass spectrometry. Putrescine-related pathway changes were identified with metabolome-wide association study (MWAS). Results show that Mn caused a dose-dependent increase in putrescine over a non-toxic to toxic concentration range. MWAS of putrescine showed positive correlations with the polyamine metabolite N8-acetylspermidine, methionine-related precursors, and arginine-associated urea cycle metabolites, while putrescine was negatively correlated with γ-aminobutyric acid (GABA)-related and succinate-related metabolites (P < 0.001, FDR < 0.01). These data suggest that measurement of putrescine and correlated metabolites may be useful to study effects of Mn intake in the high adequate to UL range.
Keywords: Dietary recommended intake, Nutritional toxicology, Neurotoxicology, Metal nutrition, In vitro toxicity testing
1. Introduction
Manganese (Mn) is an essential nutrient that causes oxidative stress, mitochondrial damage and neurotoxicity in excess (Dobson et al., 2003; Martinez-Finley et al., 2013; Zhang et al., 2008). Adequate intake (AI) levels for Mn are 2.3 mg Mn/day for men and 1.8 mg Mn/day for women (Food and Nutrition Board, 2001). The Tolerable Upper Intake Level (UL) for Mn is 11 mg/d, defined as the highest level of daily intake that is likely to pose no risk of adverse health effects in almost all individuals (Food and Nutrition Board, 2001). In the Total Diet Study (1991–1997), the 99th percentile intake for men 31–50 y was 8.33 ± 0.12 mg/d and for men 51–70 y was 6.85 ± 0.09 (US Food and Drug Administration, 2001). Some over-the-counter men’s daily multivitamin and mineral supplements contain the recommended dietary allowance (RDA) for Mn (2.3 mg), and some supplements for men over 50 y contain 2 times the RDA. Use of such supplements by susceptible men or men at the 99th percentile intake may contribute to an ongoing and unexplained increase in incidence of neurological problems, such as depression, anxiety, dementia, idiopathic Parkinson’s disease, and stroke (Chin and Vora, 2014). Methods to monitor and evaluate responses to high Mn intake are needed to test for such effects.
Blood and urinary measures of Mn are available to evaluate nutritional status, but these cannot discriminate susceptible from non-susceptible individuals. Newer biochemical methods with ultra-high-resolution mass spectrometry coupled to liquid chromatography offer powerful biochemical approaches to monitor biologic responses to diet and nutrition (Jones et al., 2012). However, these do not yet have sufficient theoretical or experimental development for application to nutritional assessment. For instance, high-resolution metabolomics (HRM) (Walker et al., 2016) supports both targeted analysis of nutrients (Accardi et al., 2016) and also targeted metabolome-wide association study (MWAS) to discover metabolites and metabolic pathways that vary in association with an essential nutrient (Go et al., 2015d). In principle, this 3-step approach [1) experimental variation in a nutrient, 2) targeted analysis of a metabolite expected to change and 3) MWAS of the targeted metabolite] provides a way to map out diverse metabolic networks associated with variation in specific nutrients.
In application of HRM methods to Parkinson’s disease patients, we found that the polyamine N8-acetylspermidine was elevated in individuals with rapid progression of Parkinson’s disease (Roede et al., 2013). In mechanistic research on environmental causes of Parkinson’s disease, we found that the Mn-containing fungicide maneb increased transcription of a polyamine transporter (Roede et al., 2014). These data circumstantially connect Mn to perturbed polyamine metabolism in a neurodegenerative disease. Several other studies show that pu-trescine, a polyamine precursor for spermidine and N8-acet-ylspermidine (Manna et al., 2013; Miller-Fleming et al., 2015; Odenlund et al., 2009; Tabor and Tabor, 1984), is increased in brain in association with neuronal damage (de Vera et al., 1997, 2002; Halonen et al., 1993; Zahedi et al., 2010) and neurologic disorders (Chen et al., 2010; Lewandowski et al., 2010; Roede et al., 2013). Because pu-trescine and other polyamines regulate ion channels and neurotransmission in brain (Paschen, 1992; Pegg and McCann, 1982), these observations raise the possibility that increased putrescine and related polyamines could be useful to evaluate excess intake of Mn.
In the present research, we used a well characterized human SH-SY5Y neuroblastoma cell line which has been previously utilized in studies characterizing neurological disorders (Petratos et al., 2008; Wu et al., 2014), Mn (Maddirala et al., 2015; Zhang et al., 2016) and polyamine metabolism (Phukan et al., 2016; Shin et al., 2016). The possible link between Mn and polyamine metabolism and its implications in neurological disorders however, are largely unknown. In this study, we determined whether systematic increase in Mn exposure caused 1) increased putrescine concentration and 2) associated changes in related metabolic pathways in association with putrescine. An additional aim of this study was to establish a nutritional dynamics1 approach to map functional pathways linked to a nutrient and provide a foundation for animal studies to test use of putrescine and related metabolites to monitor neurobiologic effects of Mn intake in the high adequate range.
2. Materials and methods
2.1. Cell culture and Mn treatment
The human neuroblastoma cell line SH-SY5Y was obtained from the American Type Culture Collection (ATCC-Manassas, VA). This cell line has been extensively characterized as an in vitro human cell model for neurodegenerative diseases including Parkinson’s disease and Alzheimer’s disease (Gao et al., 2001; Wu et al., 2014; Zhu et al., 2007). The cells exhibit dopaminergic neuronal markers (Gordon et al., 2013; Kovalevich and Langford, 2013; Xie et al., 2010) and were selected for the current studies because Mn causes mitochondrial dysfunction and oxidative stress (Fernandes et al., 2017) and these cells are susceptible to mitochondrial dysfunction and neuronal cell death induced by oxidative stress (Gao et al., 2001; Wu et al., 2014; Zhu et al., 2007). The cells were maintained, cultured and treated with Mn as previously described (Fernandes et al., 2017). Briefly, all experiments were conducted with cells at passage 3 and 4 using culture medium containing adequate Mn. Cells were supplemented with MnCl2 (Sigma) at varying concentrations (0, 1, 5, 10, 50, 100 μM) for 5 h. This incubation time was selected because cell uptake of Mn was largely stabilized by 2 h and cell death began to occur at higher concentrations (50 and 100 μM) after 10 h. Thus, we reasoned that 5 h represented a time point when Mn redistribution was largely complete and analyses were not complicated by the presence of dead cells. These exposures resulted in intracellular Mn contents as follows: 0 μM, 6.4 ± 1.0 ng Mn/mg protein; 1 μM, 12 ± 1 ng Mn/mg protein; 5 μM, 13 ± 2 ng Mn/mg protein; 10 μM, 16 ± 1 ng Mn/mg protein; 50 μM, 37 ± 2 ng Mn/mg protein; 100 μM, 49 ± 1 ng Mn/mg protein (Fernandes et al., 2017). Subsets of SH-SY5Y cells were treated with 10 μM putrescine to examine metabolic responses by high-resolution metabolomics. For experimental conditions, fetal bovine serum was decreased to 0.5%. Cells were harvested at 80% confluency.
2.2. High-resolution metabolomics (HRM)
Experiments were designed to allow targeted analysis of putrescine as well as non-targeted metabolome-wide association study (MWAS) of metabolites correlated with putrescine. To help overcome the false discovery due to multiple comparisons, the experiments were designed with nine independent biological replicates for each of the six experimental conditions of Mn concentration. Metabolic extracts were prepared as described previously (Go et al., 2014, 2015a; Soltow et al., 2013; Uppal et al., 2013, 2016, 2017). Briefly, after the 5-h treatment, cells were washed with phosphate-buffered saline and 200 μL of 1:2 HPLC grade water: acetonitrile solution containing a mixture of stable isotopic standards (Go et al., 2015a; Soltow et al., 2013) was added to each plate to precipitate proteins and extract metabolites (Go et al., 2014). The extracts were maintained at 4 °C for 30 min and centrifuged at 16,000 g for 10 min to remove protein and extracts were maintained at −80 °C until HRM analysis. Supernatants were transferred to auto-sampler vials and placed in a refrigerated autosampler for analysis. The cell extracts were analyzed in 3 batches with two pooled human plasma reference samples (NIST SRM1950 and QStd), extracted together with the cell extracts under identical conditions, and included at the start and end of each batch of 20 samples for quality control and quality assurance purposes (Go et al., 2015c).
Samples were analyzed with three technical replicates using ultrahigh resolution mass spectrometry with hydrophilic interaction liquid chromatography (HILIC) [Accucore HILIC 100 × 2.1 mm columns]. Electrospray ionization was used in the positive ion mode on the Q-Exactive HF mass spectrometer operating with resolution set to 120,000 and scan range set to 85–1275 m/z (mass to charge) (Liu et al., 2016; Soltow et al., 2013). Ultra-high resolution mass spectrometry operating at 60,000 and 120,000 resolution have previously been shown to provide effective quantification of metabolites in biologic extracts (Accardi et al., 2016; Go et al., 2015b, 2015c, 2015d; Johnson et al., 2008). A 2% formic acid/acetonitrile gradient was used as described (Liu et al., 2016). Injection volume was 10 μl and run time was 10 min. Instrument conditions were: spray voltage, 3500 (V); capillary temperature, 300 °C; sheath gas flow, 45 (arbitrary units); auxillary gas flow, 25 (arbitrary units); spare gas flow, 1 (arbitrary units); max spray current, 100 (μA); probe heater temperature, 200 °C.
2.3. Data extraction and annotation
The raw files of mass spectral data were converted to “.CDF” format and data for each feature, including m/z, retention time (RT) and intensity, were extracted with apLCMS (Yu et al., 2009) and xMSanalyzer (Uppal et al., 2013). Features with median coefficient of variation (CV) greater than 50% CV for technical replicates were removed from subsequent analyses. The remaining 11,284 m/z features were filtered using a threshold that > 80% were present per group, resulting in a final dataset of 6296 m/z features. The remaining missing values were imputed as half the value of the lowest observed intensity for each metabolite, and values were log2 transformed and quantile normalized for subsequent analyses.
Metabolite identities as indicated were confirmed by ion dissociation mass spectrometry (MS/MS) and co-elution with authentic standards. For other metabolites, Level 5 identification (Schymanski et al., 2014) was made using Kyoto Encyclopedia of Genes and Genomes (KEGG, http://www.genome.jp/kegg/) (Kanehisa et al., 2017) and Metlin (Smith et al., 2005) mass spectrometry databases at 5 ppm tolerance, with confidence scores for annotation obtained using xMSannotator (Uppal et al., 2017) with Human Metabolome DataBase (HMDB) version 3.5 http://www.hmdb.ca/) (Wishart et al., 2013). Assignment of the chemical identity and level identification for the significant metabolites was made using the criteria of Schymanski et al. (2014).
2.4. Quantification of putrescine
Putrescine was measured by liquid chromatography-mass spectrometry with identification relative to an authentic putrescine standard (IROA technologies, Bolton, MA) by co-elution and ion dissociation mass spectrometry. Putrescine was quantified relative to a standard curve created with putrescine dihydrochloride (Sigma-Aldrich).
2.5. Putrescine-related metabolites and pathways by targeted metabolomics
KEGG Mapper was used to target polyamine metabolism. Upstream and downstream pathways associated with polyamine metabolism were noted and matches to adducts for metabolites in these pathways were selected from output of xMSannotator analysis using HMDB and KEGG. Correlation of metabolites with putrescine was determined using MetabNet (Spearman correlation). To evaluate direct effects of putrescine on biological relevance such as polyamine metabolism, subsets of cells treated with putrescine at 10 μM for 30 min were analyzed for HRM.
2.6. Biostatistics and bioinformatics
All statistical analyses were performed in R version 3.2.3. Statistics on putrescine intensity was determined using the R function for linear regression model against the cellular Mn content at P < 0.05. MWAS of putrescine was performed using MetabNet (Uppal et al., 2015) with Spearman correlation. Analysis showed that 1576 m/z features were associated with putrescine at false discovery rate (FDR) < 0.2 (Benjamini and Hochberg method) (Benjamini and Hochberg, 1995). Because many of these had relatively small correlation coefficients, we selected only those metabolites (567 m/z) with absolute correlation threshold |r| > 0.4 (P < 0.008) for pathway enrichment analysis. KEGG IDs for these 567 features were obtained from mummichog version 1.0.5 (Li et al., 2013) and used as input in MetaCore [MetaCore™ version 6.30 build 68780; Thomson Reuters (https://portal.genego.com/), for knowledge-based functional pathway analysis. Further pathway enrichment analysis was done using mummichog version 1.0.5 (Li et al., 2013). Two approaches were used for pathway analysis, one selecting features with accurate mass matches to metabolites (Identity Level 5) followed by analysis with Metacore (https://portal.genego. com/), and the other using mummichog (Li et al., 2013), a pathway enrichment tool which predicts functional activity directly from spectral feature tables without a priori identification of metabolites.
3. Results
3.1. Targeted analysis of Mn dose response on putrescine in SH-SY5Y cells
Putrescine was detected as an [M+H]+ adduct (m/z, 89.1074) eluting at 256 s (Fig. 1A); identity in cell extracts was confirmed by coelution with authentic standard and agreement of ion dissociation (MS/MS) spectra (Supplemental Fig. 1). After 5 h incubation with Mn, putrescine in cell extracts increased with Mn in a linear regression model (Fig. 1A and B; P = 0.0014). Mean cellular putrescine concentrations ranged from 3.2 nmol/mg protein for cells with no added Mn to 4.5 nmol/mg protein for cells with 100 μM Mn added to the culture medium (Fig. 1B).
Fig. 1.
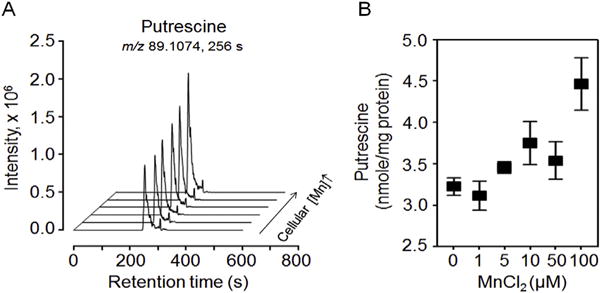
Putrescine concentration in human SH-SY5Y neuroblastoma cells as a function of Mn addition to culture medium. (A) Overlay of LC-ultra-high resolution mass spectrometry selected ion chromatogram window m/z 89.1065 to m/z 89.1083 for H+ adduct of putrescine in extracts from cells incubated 5 h in culture medium with 0, 1, 5, 10, 50 and 100 μM Mn. (B) Cellular putrescine (nmol/mg protein) (m/z, 89.1074; RT, 256s) varied with cellular Mn concentration (P = 0.0014). Putrescine concentrations (nmol/mg protein) for respective Mn concentrations (μM Mn) in the culture medium are expressed as mean ± SEM (SD) for nine independent biological replicates [0, 3.2 ± 0.1 (0.3); 1 μM, 3.1 ± 0.2 (0.5); 5 μM, 3.5 ± 0.1 (0.2); 10 μM, 3.8 ± 0.3 (0.8); 50 μM, 3.5 ± 0.2 (0.7); 100 μM, 4.5 ± 0.3 (0.9)]. Putrescine identification data by MS/MS are provided in Supplemental Fig. 1.
3.2. Metabolite changes in putrescine-related pathways
To test for metabolic precursors or products variation in association with putrescine, we used xMSannotator (Uppal et al., 2017) to select mass spectral features with accurate mass matches (10 ppm) to metabolites in four central pathways of putrescine-associated metabolism [polyamine metabolism, methionine (Met) metabolism, urea cycle and neurotransmitter GABA shunt] in HMDB and KEGG (Supplemental Table 1). Ninety-six matches were obtained for 62 metabolites, with more than half positively correlated and a smaller number negatively correlated with putrescine (Supplemental Table 1). A subset with FDR < 0.01 and correlation threshold |r| > 0.4 is provided in a simplified schematic of these pathways in Fig. 2; details concerning m/z, RT, adduct and identification score of Schymanski et al. (2014) are provided in Table 1, and more extensive details are provided in Supplemental Table 1. Additional confidence in identification of poly-amine metabolites is provided by significant correlations of metabolic precursors and products within known metabolic pathways (see (Uppal et al., 2016)).
Fig. 2.
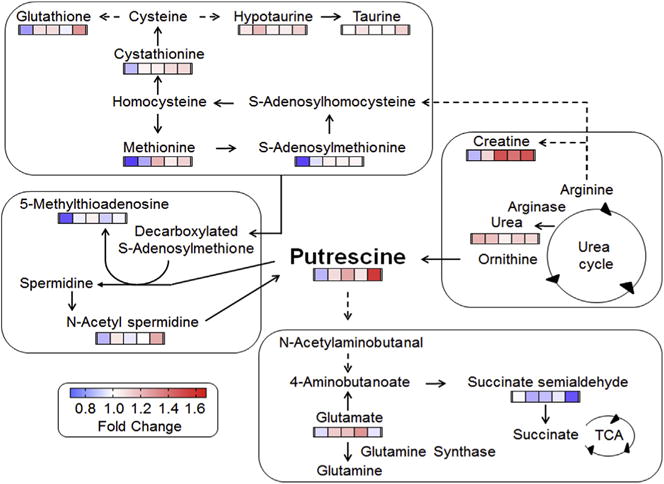
Metabolites in polyamine and related pathways that correlate with putrescine in SH-SY5Y cells. Cellular metabolites were analyzed by high resolution metabolomics (HRM). Metabolites associated with polyamine metabolism, precursor pathways and degradation pathways were tested for correlation with putrescine (see text for details). For simplicity, metabolites that varied with putrescine are shown with color bars in which the color represents the fold-change in each of the Mn treatments (1, 5, 10, 50 and 100 μM from left to right) relative to control without added Mn (Spearman correlation, |r| > 0.4, FDR < 0.01). Annotation and details on the putrescine-correlated metabolites are provided in Table 1 and Supplemental Table 1. (For interpretation of the references to color in this figure legend, the reader is referred to the Web version of this article.)
Table 1.
Metabolites correlated with putrescine in a targeted analysis of polyamine pathway, precursor pathways (urea cycle and methionine metabolism) and degradation pathways (GABA shunt) in human SH-SY5Y neuroblastoma cells.
| Metabolite | Adduct | Detected m/z | RT sec | Correlation r | P-value | Identity levela | Pathway |
|---|---|---|---|---|---|---|---|
| Putrescine | [M + H]+ | 89.1074 | 256 | 1 | 0 | 1 | Polyamine biosynthesis |
| N8-Acetyl-spermidine | [M + H]+ | 188.1760 | 263 | 0.79 | < 0.0001 | 4 | Polyamine biosynthesis |
| 5′-Methylthio-adenosine | [M(13C) + H]+ | 299.1005 | 290 | 0.55 | < 0.0001 | 5 | Methionine metabolism |
| Methionine | [M-H2O + H]+ | 132.0487 | 181 | 0.67 | < 0.0001 | 1 | Methionine metabolism |
| S-Adenosyl-methionine | [M + H]+ | 399.1446 | 288 | 0.56 | < 0.0001 | 1 | Methionine metabolism |
| Cystathionine | [M + H]+ | 223.0749 | 255 | 0.67 | < 0.0001 | 1 | Methionine metabolism |
| [M(13C) + H]+ | 224.0784 | 255 | 0.66 | < 0.0001 | 1 | ||
| [M + 2H]2+ | 112.0407 | 254 | 0.66 | < 0.0001 | 1 | ||
| [M(13C) + 2H]2+ | 112.5428 | 260 | 0.57 | < 0.0001 | 1 | ||
| Glutathione poolb | [M + H]+ | 613.1588 | 251 | 0.45 | 0.0006 | 1 | Methionine metabolism |
| [M + 2H]2+, [M]+ | 307.0835 | 253 | 0.44 | 0.0009 | 1 | ||
| [M(13C)+ 2H]2+ | 307.5852 | 248 | 0.47 | 0.0003 | 1 | ||
| Hypotaurine | [M-H2O + H]+ | 92.0166 | 210 | 0.58 | < 0.0001 | 2 | Neurotransmitter metabolism |
| [M(13C) + H]+ | 111.0305 | 210 | 0.49 | 0.0002 | 2 | ||
| Taurine | [M(13C) + H]+ | 127.0254 | 144 | 0.66 | < 0.0001 | 2 | Neurotransmitter metabolism |
| [M + ACN + H]+ | 167.0488 | 144 | 0.43 | 0.0010 | 2 | ||
| [M-H2O + H]+ | 108.0115 | 145 | 0.52 | < 0.0001 | 2 | ||
| [M + Na]+ | 148.0041 | 141 | 0.53 | < 0.0001 | 2 | ||
| Creatine | [M + K]+ | 170.0329 | 172 | 0.64 | < 0.0001 | 2 | Urea cycle |
| Urea | [M + K]+ | 98.9960 | 148 | − 0.56 | <0.0001 | 5 | Urea cycle |
| Glutamate | [M-H2O + H]+ | 130.0501 | 159 | 0.40 | 0.003 | 3 | Neurotransmitter metabolism |
| Succinate semialdehyde | [M + 2K-H]+ | 178.9496 | 176 | − 0.43 | 0.001 | 5 | Neurotransmitter metabolism |
Chemical Identity according to Schymanski et al. (2014), wherein 1 represents the highest level of identification and 5 represents the lowest.
The glutathione pool mostly represented glutathione (GSH) but glutathione disulfide (GSSG) co-eluted under the chromatographic conditions, and no precautions were taken to minimize oxidation of GSH to GSSG.
3.2.1. Polyamine metabolism
Of the central polyamine pathway, features matching N-acet-ylspermidine and diacetylspermine correlated with putrescine at the threshold |r | > 0.4 (Fig. 2; Supplemental Table 1), and that matching spermine had a weaker correlation (r = 0.25; FDR = 0.13). The N-acetylspermidine was confirmed to be N8-acetyl spermidine by MS/MS. Other positively correlated matches to polyamine metabolites included spermine dialdehyde (r = 0.58; FDR < 0.01), 4-coumaroylputrescine (r = 0.48; FDR < 0.01) and γ-glutamyl-L-putrescine (r = 0.35; FDR = 0.023). Features matching 4-coumaroyl-2-hydroxyputrescine (r = −0.37; FDR = 0.015) and sinapoylspermine (r = −0.26; FDR = 0.12) had negative correlation with putrescine (Supplemental Table 1).
3.2.2. Methionine metabolism
Met and metabolites in each of the three major branches of Met metabolism (salvage, transsulfuration, transmethylation) were positively correlated with putrescine (Fig. 2; Table 1). These metabolites included S-adenosylmethionine (AdoMet), a precursor for the transfer of the aminopropyl group for conversion of putrescine to spermidine, and 5-methylthioadenosine, the product resulting from the aminopropyl transfer and an intermediate in the Met salvage pathway (Fig. 2; Table 1). AdoMet is converted to S-adenosylhomocysteine in synthesis of creatine, and both S-adenosylhomocysteine and creatine were increased in association with putrescine. S-Adenosylhomocysteine is a precursor to cystathionine in the transsulfuration pathway, which was also increased in association with putrescine (Fig. 2; Table 1). Cysteine (Cys), a product of the transulfuration pathway, is a precursor for the antioxidant, GSH. GSH was positively associated with putrescine (Fig. 2; Table 1), and Cys ([M+H]+) was weakly correlated (r = 0.28; FDR = 0.088) (Supplemental Table 1).
3.2.3. Urea cycle
Arginine and ornithine are metabolic intermediates in the urea cycle, which serve as precursors for putrescine; neither was correlated with putrescine. Other metabolites, aspartate and fumarate, were positively correlated (Supplemental Table 1) while urea was negatively correlated (Fig. 2, Table 1). Metabolites related to the urea cycle through use of arginine as a precursor, including creatine, creatine phosphate and creatinine, were positively correlated with putrescine (Fig. 2, Supplemental Table 1). Data for citrulline and argininosuccinate were of insufficient quality to allow tests for correlation.
3.2.4. Neurotransmitter metabolism
Hypotaurine and taurine are neurotransmitters derived from Met and Cys metabolism that also increased in association with putrescine (Fig. 2, Table 1). Glutamate (Glu) is an excitatory neurotransmitter that is converted to glutamine (Gln) by the Mn-dependent glutamine synthetase. Glu was positively correlated with putrescine; data were ambiguous for Gln because a confirmed ion of Gln did not correlate even though a high confidence match to an uncharacterized adduct of Gln was correlated (r = 0.38; FDR = 0.013). Another neurotransmitter, 4-aminobutanoate (GABA), is produced from putrescine and from Glu. GABA had a weak, negative correlation (r = −0.22; FDR = 0.19) with putrescine, and a related metabolite, acetamidobutanoate, similarly had a weak negative correlation (r = −0.25; FDR = 0.13) (Supplemental Table 1). GABA feeds into the citric acid cycle via succinate semialdehyde and succinate, and both of these were negatively correlated with putrescine (Supplemental Table 1). These results were confirmed by a separate putrescine response study with10 μM putrescine for 0.5 h or vehicle treatment, showing increased Glu and decreased succinate semialdehyde in response to putrescine (Fig. 3A and B). Quantification of cellular putrescine (42% increase; 3.6–5.1 nmol/mg protein, Supplemental Fig. 2) showed that putrescine concentration under this experimental condition was similar to the concentration of putrescine (41% increase: 3.2–4.5 nmol/mg protein, Fig. 1B) in the Mn dose-response study.
Fig. 3.
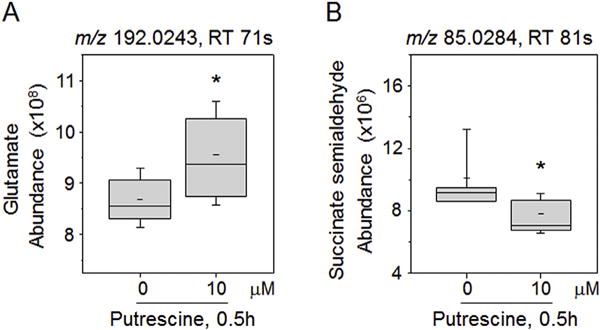
Examination of metabolites affected by putrescine directly added to SH-SY5Y cells. SH-SY5Y cells treated with putrescine (0, 10 μM) for 0.5 h were analyzed by HRM, and the data of HRM were examined for glutamate (Glu) and succinate semialdehyde as metabolites associated with putrescine pathway shown in Fig. 2. Abundances of Glu (A) and succinate semialdehyde (B) in cells were measured by integrating intensity of respective mass spectral peak from HRM data (Glu, m/z 192.0243, adduct of M+2Na-H; Succinate semialdehyde, m/z 85.0284, adduct of M-H2O+H). Whisker plots show the results of 6 replicates. *P < 0.05.
3.3. Targeted MWAS of putrescine
To further explore metabolites and pathways correlated with putrescine, Spearman correlation analysis was performed to test for correlation of each of the 6296 m/z features with putrescine (Supplemental Table 2). Manhattan plots (Fig. 4) showed a broad range of m/z and RT correlated with putrescine, indicating that correlated metabolites were diverse in size and physical properties. N8-Acetylspermidine ([M +H]+; m/z, 188.1760; RT, 263 s) had r = 0.79 and the highest -log P (FDR < 0.0001) (Fig. 4A and B, circled in green).
Fig. 4.
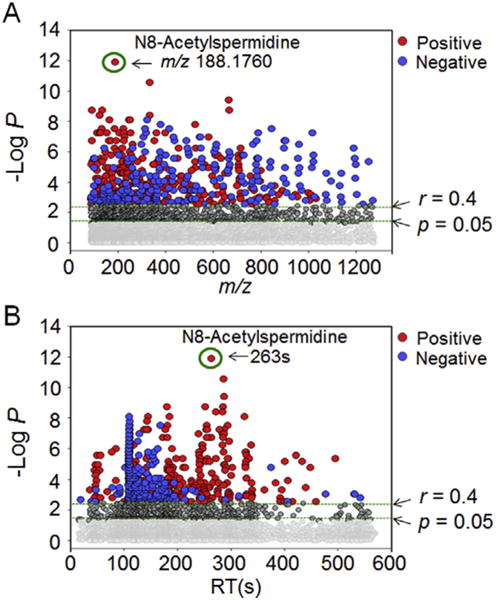
Metabolome-wide association study (MWAS) of putrescine in SH-SY5Y cells treated with Mn. Spearman correlation of putrescine with 6296 m/z features was performed using MetabNet (Uppal et al., 2015). (A) Type 1 Manhattan plot for -log P for m/z features as a function of m/z showed that N8-acetylspermidine had the greatest -log P. A total of 1576 features correlated with putrescine at P < 0.05 (769 positive correlation, 807 negative correlation, Supplemental Table 2), so greater stringency was used for subsequent pathway analysis using a threshold for|r| > 0.4, where FDR was 0.008. At this cutoff, 324 features had positive (red) and 243 had negative correlations (blue) including features with a broad range of m/z. (B) Type 2 Manhattan plot for -log P as a function of retention time (RT) with HILIC separation. The results qualitatively show that correlated metabolites had a broad range of physicochemical characteristics in which more non-polar chemicals were negatively correlated and more polar features were positively correlated. Additional information is provided in Supplemental Table 2. (For interpretation of the references to color in this figure legend, the reader is referred to the Web version of this article.)
Significantly associated features were selected with a correlation threshold |r| > 0.4 and corresponding metabolites were categorized into different global pathway map folders using MetaCore. Results showed that 29% belonged to amino acid metabolism and regulation, while others were grouped into metabolic diseases (22%), energy metabolism and its regulation (15%), neurotransmission (14%), in-flammatory diseases (10%), nucleotide metabolism and its regulation (7%) and nicotine action (4%) (Fig. 5A). The results of this global analysis are consistent with the correlations found for Met and Cys metabolism and neurotransmission pathways described above. The results also indicate broader effects on energy metabolism, including effects on succinate, fumarate, creatine and creatine phosphate.
Fig. 5.
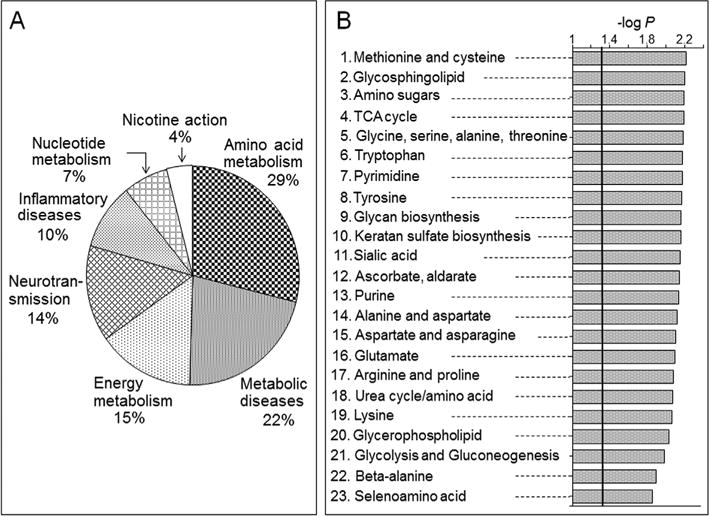
Pathway-enrichment analysis of putrescine-correlated metabolites. (A) Metabolic categories of metabolites correlated with putrescine using MetaCore. (B) Metabolic pathways analysis using mummichog. Details on the top 6 pathways and their respective putrescine correlated metabolites are provided in the Supplemental Table 3.
Pathway enrichment analysis with mummichog (Li et al., 2013) for features with |r| > 0.4 similarly showed that Met and Cys metabolism was among the top six enriched metabolic pathways (Fig. 5B; 23 overlapped metabolites, P = 0.0061). Details for the mummichog analysis are provided in Supplemental Table 3. Consistent with changes in energy metabolism, the citric acid cycle (TCA cycle) was also among the top six pathways (10 overlapped metabolites; P = 0.0064). Metabolite matches included two components of pyruvate dehydrogenase, lipoamide and dihydrolipoamide, and citric acid cycle metabolites, citrate/isocitrate, cis aconitate, oxalosuccinate, fumarate, malate, and guanosine triphosphate (Fig. 6). Unlike the negative correlation of succinate semialdehyde found in the targeted analysis, these metabolites were positively correlated with putrescine.
Fig. 6.
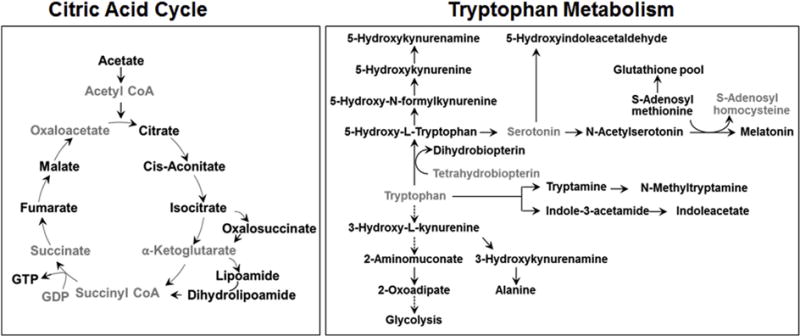
Metabolites in energy and neurotransmitter metabolism that correlated with putrescine. Metabolites from mummichog analysis in the citric acid cycle pathway (left) and tryptophan pathway (right) that correlated with putrescine are highlighted in bold text.
Additional pathways correlated with putrescine in the mummichog pathway enrichment analysis included glycosphingolipid metabolism (13 overlapped metabolites; P = 0.0062); aminosugar metabolism (15 overlapped metabolites; P = 0.0064); glycine, serine, alanine and threonine metabolism (19 overlapped metabolites; P = 0.0065); and tryptophan metabolism (21 overlapped metabolites; P = 0.0065). The glycosphingolipid and amino sugar metabolism pathways included Gln, Glu, and N-acetyl galactosamine, a component of the neuronal structure and brain heteropolysaccharides. The glycine, serine, alanine and threonine metabolism pathway included alanine and serine and also creatine and phosphocreatine, metabolites related to the urea cycle (Fig. 2 and Supplemental Table 3). The tryptophan pathway included neurotransmitter metabolites, tryptamine, a precursor to neurotransmitters serotonin and melatonin; 5-hydroxytryptophan; and kynurenine and kynurenamine, which are neuroactive intermediates (Fig. 6) (Vecsei et al., 2013). Together, with the above results showing that putrescine varied with Mn exposure, this targeted MWAS of putrescine provided details of broader nutritional dynamic effects associated with variation in putrescine.
4. Discussion
Putrescine has been implicated in multiple neurological disorders, and the results of the present study show that putrescine is increased by Mn in SH-SY5Y neuroblastoma cells. The increase in putrescine had associated changes in polyamine, Met and neurotransmitter-related metabolites. These results are of potential importance for Mn nutrition because polyamines are ubiquitous cationic molecules (Miller-Fleming et al., 2015; Pegg and McCann, 1982; Tabor and Tabor, 1984) that function in DNA stabilization (Iacomino et al., 2012; Marton and Feuerstein, 1986), gene transcription and translation (Childs et al., 2003; Thomas et al., 1995; Wang et al., 1998, 2010), ion channel functions (Williams, 1997) and regulation of cell growth, proliferation and migration (Odenlund et al., 2009; Ray et al., 1999). An increased level of polyamines, particularly putrescine, has previously been found in traumatic injury (Gilad and Gilad, 2003), brain damage with epilepsy (de Vera et al., 1991), cerebral ischemia-related injury (Rohn et al., 1990), hypertensive attention-deficit rodent models (Sohn et al., 2002) and suicide completers with a history of major depression (Chen et al., 2010). Thus, the increase in putrescine and related polyamines in response to increased Mn could be relevant to neurotoxicity caused by excess Mn. A previous study showed that patients with mild cognitive impairment (MCI) who subsequently developed Alzheimer’s disease had 10% higher putrescine (Graham et al., 2015). Although this association does not establish a causal relationship, the 40% increase (3.2–4.5 nmol/mg protein) in response to Mn in the current study indicates that the magnitude of change in putrescine due to Mn could be biologically important.
Cationic polyamines accelerate aggregation and fibrillation of alpha synuclein in Parkinson’s disease (Antony et al., 2003) and accelerated aggregation of amyloid-beta (Aβ) peptide in Alzheimer’s disease potentially via electrostatic interaction between N-terminal regions of polyamine amyloid-beta (Aβ) peptide possessing negative charge and the positively charged polyamines ()(Luo et al., 2013). These data suggest that polyamines play a role in major neurological and age-related disorders (Antony et al., 2003; Luo et al., 2013). Polyamines also impact functions of multiple ion channels (Agostinelli, 2016; Ahern et al., 2006; Williams, 1997), raising the possibility that Mn-induced changes in putrescine and related polyamines could impact neurologic disorders without causing cell death. If Mn effects on polyamine metabolism result in altered ion channel activities in the brain, polyamine profiling could be useful diagnostically and potentially therapeutically in neurological disorders. This could be especially important in evaluating potential effects of excess Mn intake. Because the spectrum of neurotransmitters changing in association with putrescine is broad, including glutamate, GABA, hypotaurine, taurine and biogenic amine precursors, Mn effects could also have parallel neurotransmitter effects and result in multiple neurologic phenotypes.
The potential nutritional importance of these findings is apparent from the narrow range between AI and UL for Mn (Greger, 1998; Smith et al., 2017). Mn content of normal human brain is 5.3–14 ng/mg protein while the range associated with aberrant function is 16–42 ng/mg protein (Bowman and Aschner, 2014). The cellular Mn in our study was from 6 to 49 ng/mg protein; thus, the concentrations in this cell model appear to represent the concentration range relevant to normal and excessive Mn. Many human health studies have focused on Mn supplementation to improve superoxide dismutase-2, a Mn-dependent mitochondrial enzyme that protects against oxidative stress. However, increased Mn over the normal to pathologic range in neuroblastoma cells increased mitochondrial H2O2 production (Fernandes et al., 2017) suggesting that the increased GSH in the current study (Fig. 2) could reflect increased Met and Cys metabolism occurring as a consequence of oxidative stress. Mn homeostasis is complex, however, pointing to utility of metabolic indicators such as putrescine to help establish adequate and excess intake.
Limitations of the present in vitro studies using neuroblastoma cell line should be recognized. First, the absolute concentrations of pu-trescine in the SH-SY5Y cells are similar to reported values for pu-trescine in SK-N-SH human neuroblastoma cells from which the SH-SY5Y cells were derived (Ruiz-Perez et al., 2015), but these values are higher than found in adult human brain (Morrison et al., 1995). Thus, even though the Mn concentrations are representative of human brain, the high polyamines may not accurately reflect in vivo polyamine metabolism in human brain. This result might be due to cell proliferation in this cell model system and/or associated with modified metabolism in neuroblastoma cell line; thereby studies in non-cancer cell line are warranted. Secondly, the results establish a Mn-dependent increase in putrescine, but additional studies will be needed to understand the time course of effects, especially taking into account possible time-dependent variations in Mn concentration in subcellular compartments, and in different neuronal and non-neuronal cell lines. The limited information on human cells that exists shows that Mn increased polyamine uptake by breast cancer cells (Poulin et al., 1995), altered arginase activity in a Huntington disease mouse model (Bichell et al., 2017), and increased arignase activity and putrescine levels in bovine coronary ventricular endothelial cells (Li et al., 2001). Thirdly, the correlation of metabolites with putrescine do not establish causal relationships between the metabolites, and additional studies will be needed to establish such relationships.
In summary, Mn caused a dose-dependent increase in putrescine and associated changes in polyamine, methionine and neurotransmitter metabolites in a human neuroblastoma cell line. The metabolites affected include ones linked to neurological diseases like Parkinson’s disease, Alzheimer’s diseases and other neurologic disorders. The results provide a general strategy for use of high-resolution metabolomics in nutritional dynamics research and suggest utility of this approach to determine whether dietary or supplemental intake of Mn contributes to neurologic disorders.
Supplementary Material
Acknowledgments
Drs. Young-Mi Go and Dean P. Jones share equal senior authorship in this collaborative research. The authors thank ViLinh Tran for technical assistance with the mass spectrometer. D.P.J., Y-M.G., and J.F. participated in the study design and manuscript preparation; J.F, J.D.C and K.H.L conducted research; J.F. performed data preprocessing, metabolomics data analysis, interpreted metabolomics data, and wrote the first draft of the manuscript; J.F. and K.U. performed the statistical analysis of the metabolomics data; D.P.J., Y-M.G., J.F., J.D.C. and K.U., reviewed the figures. D.P.J. and Y-M.G. had primary responsibility for final content. All authors read and approved the final version of the manuscript.
Funding
This work was funded by NIEHS Grants R01 ES023485 (DPJ and YMG), R21 ES025632 (DPJ and YMG), P30 ES019776 (DPJ), and NIH S10 OD018006 (DPJ).
Abbreviations
- BH
Benjamini and Hochberg method
- FDR
false discovery rate
- HMDB
human metabolome database
- KEGG
Kyoto encyclopedia of genes and genomes
- LC
liquid chromatography
- Mn
manganese
- MS
mass spectrometry
- MWAS
metabolome wide association study
- m/z
mass to charge
- RT
retention time
Appendix A. Supplementary data
Supplementary data related to this article can be found at http://dx.doi.org/10.1016/j.fct.2018.04.042.
Footnotes
Nutritional dynamics is used in analogy to pharmacodynamics, where pharmacokinetics refers to the rates of drug metabolism and disposition and pharmacodynamics refers to the impacts of a drug on a biologic system. In this sense, nutritional kinetics refers to the rates of nutrient metabolism and disposition while nutritional dynamics refers to the impacts of a nutrient on a biologic system.
Conflict of interest disclosure
The authors have no actual or potential conflicts of interest.
References
- Accardi CJ, Walker DI, Uppal K, Quyyumi AA, Rohrbeck P, Pennell KD, Mallon CT, Jones DP. High-resolution metabolomics for nutrition and health assessment of armed forces personnel. J Occup Environ Med. 2016;58:S80–S88. doi: 10.1097/JOM.0000000000000770. [DOI] [PubMed] [Google Scholar]
- US Food and Drug Administration. Dietary Intake Data from the US Food and Drug Administration Total Diet Study, 1991–1997, Dietary Reference Intakes for Vitamin a, Vitamin K, Arsenic, Boron, Chromium, Copper, Iodine, Iron, Manganese, Molybdenum, Nickel, Silicon, Vanadium, and Zinc. The National Academies Press; 2001. [PubMed] [Google Scholar]
- Agostinelli E. Polyamines and transglutaminases: future perspectives. Amino Acids. 2016;48:2273–2281. doi: 10.1007/s00726-016-2326-9. [DOI] [PubMed] [Google Scholar]
- Ahern GP, Wang X, Miyares RL. Polyamines are potent ligands for the capsaicin receptor TRPV1. J Biol Chem. 2006;281:8991–8995. doi: 10.1074/jbc.M513429200. [DOI] [PubMed] [Google Scholar]
- Antony T, Hoyer W, Cherny D, Heim G, Jovin TM, Subramaniam V. Cellular polyamines promote the aggregation of alpha-synuclein. J Biol Chem. 2003;278:3235–3240. doi: 10.1074/jbc.M208249200. [DOI] [PubMed] [Google Scholar]
- Benjamini Y, Hochberg Y. Controlling the false discovery rate: a practical and powerful approach to multiple testing. J Roy Stat Soc B. 1995;57:289–300. [Google Scholar]
- Bichell TJV, Wegrzynowicz M, Tipps KG, Bradley EM, Uhouse MA, Bryan M, Horning K, Fisher N, Dudek K, Halbesma T, Umashanker P, Stubbs AD, Holt HK, Kwakye GF, Tidball AM, Colbran RJ, Aschner M, Neely MD, Di Pardo A, Maglione V, Osmand A, Bowman AB. Reduced bioavailable manganese causes striatal urea cycle pathology in Huntington’s disease mouse model. Biochim Biophys Acta. 2017;1863:1596–1604. doi: 10.1016/j.bbadis.2017.02.013. [DOI] [PMC free article] [PubMed] [Google Scholar]
- Board FAN. Dietary Reference Intakes for Vitamin a, Vitamin K, Arsenic, Boron, Chromium, Copper, Iodine, Iron, Manganese, Molybdenum, Nickel, Silicon, Vanadium, and Zinc, Dietary Reference Intakes for Vitamin a, Vitamin K, Arsenic, Boron, Chromium, Copper, Iodine, Iron, Manganese, Molybdenum, Nickel, Silicon, Vanadium, and Zinc. The National Academy of Sciences; Washington (DC): 2001. [DOI] [PubMed] [Google Scholar]
- Bowman AB, Aschner M. Considerations on manganese (Mn) treatments for in vitro studies. Neurotoxicology. 2014;41:141–142. doi: 10.1016/j.neuro.2014.01.010. [DOI] [PMC free article] [PubMed] [Google Scholar]
- Chen GG, Fiori LM, Moquin L, Gratton A, Mamer O, Mechawar N, Turecki G. Evidence of altered polyamine concentrations in cerebral cortex of suicide completers. Neuropsychopharmacology. 2010;35:1477–1484. doi: 10.1038/npp.2010.17. [DOI] [PMC free article] [PubMed] [Google Scholar]
- Childs AC, Mehta DJ, Gerner EW. Polyamine-dependent gene expression. Cell Mol Life Sci. 2003;60:1394–1406. doi: 10.1007/s00018-003-2332-4. [DOI] [PMC free article] [PubMed] [Google Scholar]
- Chin JH, Vora N. The global burden of neurologic diseases. Neurology. 2014;83:349–351. doi: 10.1212/WNL.0000000000000610. [DOI] [PMC free article] [PubMed] [Google Scholar]
- de Vera N, Artigas F, Serratosa J, Martinez E. Changes in polyamine levels in rat brain after systemic kainic acid administration: relationship to convulsant activity and brain damage. J Neurochem. 1991;57:1–8. doi: 10.1111/j.1471-4159.1991.tb02091.x. [DOI] [PubMed] [Google Scholar]
- de Vera N, Camon L, Martinez E. Cerebral distribution of polyamines in kainic acid-induced models of status epilepticus and ataxia in rats. Overproduction of putrescine and histological damage. Eur Neuropsychopharmacol. 2002;12:397–405. doi: 10.1016/s0924-977x(02)00050-0. [DOI] [PubMed] [Google Scholar]
- de Vera N, Camón L, Martínez E. Polyaminen and brain injury. Amino Acids. 1997;12:1–7. [Google Scholar]
- Dobson AW, Weber S, Dorman DC, Lash LK, Erikson KM, Aschner M. Oxidative stress is induced in the rat brain following repeated inhalation exposure to manganese sulfate. Biol Trace Elem Res. 2003;93:113–126. doi: 10.1385/BTER:93:1-3:113. [DOI] [PubMed] [Google Scholar]
- Fernandes J, Hao L, Bijli KM, Chandler JD, Orr M, Hu X, Jones DP, Go YM. From the cover: manganese stimulates mitochondrial H2O2 production in SH-SY5Y human neuroblastoma cells over physiologic as well as toxicologic range. Toxicol Sci. 2017;155:213–223. doi: 10.1093/toxsci/kfw196. [DOI] [PMC free article] [PubMed] [Google Scholar]
- Gao Z, Huang K, Xu H. Protective effects of flavonoids in the roots of Scutellaria baicalensis Georgi against hydrogen peroxide-induced oxidative stress in HS-SY5Y cells. Pharmacol Res. 2001;43:173–178. doi: 10.1006/phrs.2000.0761. [DOI] [PubMed] [Google Scholar]
- Gilad GM, Gilad VH. Overview of the brain polyamine-stress-response: regulation, development, and modulation by lithium and role in cell survival. Cell Mol Neurobiol. 2003;23:637–649. doi: 10.1023/A:1025036532672. [DOI] [PMC free article] [PubMed] [Google Scholar]
- Go YM, Kim CW, Walker DI, Kang DW, Kumar S, Orr M, Uppal K, Quyyumi AA, Jo H, Jones DP. Disturbed flow induces systemic changes in metabolites in mouse plasma: a metabolomics study using ApoE(-)/(-) mice with partial carotid ligation. Am J Physiol Regul Integr Comp Physiol. 2015a;308:R62–R72. doi: 10.1152/ajpregu.00278.2014. [DOI] [PMC free article] [PubMed] [Google Scholar]
- Go YM, Liang Y, Uppal K, Soltow QA, Promislow DE, Wachtman LM, Jones DP. Metabolic characterization of the common marmoset (Callithrix jacchus) PLoS One. 2015b;10:e0142916. doi: 10.1371/journal.pone.0142916. [DOI] [PMC free article] [PubMed] [Google Scholar]
- Go YM, Uppal K, Walker DI, Tran V, Dury L, Strobel FH, Baubichon-Cortay H, Pennell KD, Roede JR, Jones DP. Mitochondrial metabolomics using high-resolution Fourier-transform mass spectrometry. Meth Mol Biol. 2014;1198:43–73. doi: 10.1007/978-1-4939-1258-2_4. [DOI] [PMC free article] [PubMed] [Google Scholar]
- Go YM, Walker DI, Liang Y, Uppal K, Soltow QA, Tran V, Strobel F, Quyyumi AA, Ziegler TR, Pennell KD, Miller GW, Jones DP. Reference standardization for mass spectrometry and high-resolution metabolomics applications to exposome research. Toxicol Sci. 2015c;148:531–543. doi: 10.1093/toxsci/kfv198. [DOI] [PMC free article] [PubMed] [Google Scholar]
- Go YM, Walker DI, Soltow QA, Uppal K, Wachtman LM, Strobel FH, Pennell K, Promislow DE, Jones DP. Metabolome-wide association study of phenylalanine in plasma of common marmosets. Amino Acids. 2015d;47:589–601. doi: 10.1007/s00726-014-1893-x. [DOI] [PMC free article] [PubMed] [Google Scholar]
- Gordon J, Amini S, White MK. General overview of neuronal cell culture. Meth Mol Biol. 2013;1078:1–8. doi: 10.1007/978-1-62703-640-5_1. [DOI] [PMC free article] [PubMed] [Google Scholar]
- Graham SF, Chevallier OP, Elliott CT, Holscher C, Johnston J, McGuinness B, Kehoe PG, Passmore AP, Green BD. Untargeted metabolomic analysis of human plasma indicates differentially affected polyamine and L-arginine metabolism in mild cognitive impairment subjects converting to Alzheimer’s disease. PLoS One. 2015;10:e0119452. doi: 10.1371/journal.pone.0119452. [DOI] [PMC free article] [PubMed] [Google Scholar]
- Greger JL. Dietary standards for manganese: overlap between nutritional and toxicological studies. J Nutr. 1998;128:368S–371S. doi: 10.1093/jn/128.2.368S. [DOI] [PubMed] [Google Scholar]
- Halonen T, Sivenius J, Miettinen R, Halmekyto M, Kauppinen R, Sinervirta R, Alakuijala L, Alhonen L, MacDonald E, Janne J, et al. Elevated seizure threshold and impaired spatial learning in transgenic mice with putrescine overproduction in the brain. Eur J Neurosci. 1993;5:1233–1239. doi: 10.1111/j.1460-9568.1993.tb00978.x. [DOI] [PubMed] [Google Scholar]
- Iacomino G, Picariello G, D’Agostino L. DNA and nuclear aggregates of polyamines. Biochim Biophys Acta. 2012;1823:1745–1755. doi: 10.1016/j.bbamcr.2012.05.033. [DOI] [PubMed] [Google Scholar]
- Johnson JM, Strobel FH, Reed M, Pohl J, Jones DP. A rapid LC-FTMS method for the analysis of cysteine, cystine and cysteine/cystine steady-state redox potential in human plasma. Clin Chim Acta. 2008;396:43–48. doi: 10.1016/j.cca.2008.06.020. [DOI] [PMC free article] [PubMed] [Google Scholar]
- Jones DP, Park Y, Ziegler TR. Nutritional metabolomics: progress in addressing complexity in diet and health. Annu Rev Nutr. 2012;32:183–202. doi: 10.1146/annurev-nutr-072610-145159. [DOI] [PMC free article] [PubMed] [Google Scholar]
- Kanehisa M, Furumichi M, Tanabe M, Sato Y, Morishima K. KEGG: new perspectives on genomes, pathways, diseases and drugs. Nucleic Acids Res. 2017;45:D353–D361. doi: 10.1093/nar/gkw1092. [DOI] [PMC free article] [PubMed] [Google Scholar]
- Kovalevich J, Langford D. Considerations for the use of SH-SY5Y neuroblastoma cells in neurobiology. Meth Mol Biol. 2013;1078:9–21. doi: 10.1007/978-1-62703-640-5_2. [DOI] [PMC free article] [PubMed] [Google Scholar]
- Lewandowski NM, Ju S, Verbitsky M, Ross B, Geddie ML, Rockenstein E, Adame A, Muhammad A, Vonsattel JP, Ringe D, Cote L, Lindquist S, Masliah E, Petsko GA, Marder K, Clark LN, Small SA. Polyamine pathway contributes to the pathogenesis of Parkinson disease. Proc Natl Acad Sci U S A. 2010;107:16970–16975. doi: 10.1073/pnas.1011751107. [DOI] [PMC free article] [PubMed] [Google Scholar]
- Li H, Meininger CJ, Hawker JR, Jr, Haynes TE, Kepka-Lenhart D, Mistry SK, Morris SM, Jr, Wu G. Regulatory role of arginase I and II in nitric oxide, polyamine, and proline syntheses in endothelial cells. Am J Physiol Endocrinol Metab. 2001;280:E75–E82. doi: 10.1152/ajpendo.2001.280.1.E75. [DOI] [PubMed] [Google Scholar]
- Li S, Park Y, Duraisingham S, Strobel FH, Khan N, Soltow QA, Jones DP, Pulendran B. Predicting network activity from high throughput metabolomics. PLoS Comput Biol. 2013;9:e1003123. doi: 10.1371/journal.pcbi.1003123. [DOI] [PMC free article] [PubMed] [Google Scholar]
- Liu KH, Walker DI, Uppal K, Tran V, Rohrbeck P, Mallon TM, Jones DP. High-resolution metabolomics assessment of military personnel: evaluating analytical strategies for chemical detection. J Occup Environ Med. 2016;58:S53–S61. doi: 10.1097/JOM.0000000000000773. [DOI] [PMC free article] [PubMed] [Google Scholar]
- Luo J, Yu CH, Yu H, Borstnar R, Kamerlin SC, Graslund A, Abrahams JP, Warmlander SK. Cellular polyamines promote amyloid-beta (Abeta) peptide fibrillation and modulate the aggregation pathways. ACS Chem Neurosci. 2013;4:454–462. doi: 10.1021/cn300170x. [DOI] [PMC free article] [PubMed] [Google Scholar]
- Maddirala Y, Tobwala S, Ercal N. N-acetylcysteineamide protects against manganese-induced toxicity in SHSY5Y cell line. Brain Res. 2015;1608:157–166. doi: 10.1016/j.brainres.2015.02.006. [DOI] [PubMed] [Google Scholar]
- Manna SK, Krausz KW, Bonzo JA, Idle JR, Gonzalez FJ. Metabolomics reveals aging-associated attenuation of noninvasive radiation biomarkers in mice: potential role of polyamine catabolism and incoherent DNA damage-repair. J Proteome Res. 2013;12:2269–2281. doi: 10.1021/pr400161k. [DOI] [PMC free article] [PubMed] [Google Scholar]
- Martinez-Finley EJ, Gavin CE, Aschner M, Gunter TE. Manganese neuro-toxicity and the role of reactive oxygen species. Free Radic Biol Med. 2013;62:65–75. doi: 10.1016/j.freeradbiomed.2013.01.032. [DOI] [PMC free article] [PubMed] [Google Scholar]
- Marton LJ, Feuerstein BG. Polyamine-dna interactions: possible site of new cancer chemotherapeutic intervention. Pharm Res (N Y) 1986;3:311–317. doi: 10.1023/A:1016375705487. [DOI] [PubMed] [Google Scholar]
- Miller-Fleming L, Olin-Sandoval V, Campbell K, Ralser M. Remaining mysteries of molecular biology: the role of polyamines in the cell. J Mol Biol. 2015;427:3389–3406. doi: 10.1016/j.jmb.2015.06.020. [DOI] [PubMed] [Google Scholar]
- Morrison LD, Becker L, Ang LC, Kish SJ. Polyamines in human brain: regional distribution and influence of aging. J Neurochem. 1995;65:636–642. doi: 10.1046/j.1471-4159.1995.65020636.x. [DOI] [PubMed] [Google Scholar]
- Odenlund M, Holmqvist B, Baldetorp B, Hellstrand P, Nilsson BO. Polyamine synthesis inhibition induces S phase cell cycle arrest in vascular smooth muscle cells. Amino Acids. 2009;36:273–282. doi: 10.1007/s00726-008-0060-7. [DOI] [PubMed] [Google Scholar]
- Paschen W. Polyamine metabolism in different pathological states of the brain. Mol Chem Neuropathol. 1992;16:241–271. doi: 10.1007/BF03159973. [DOI] [PubMed] [Google Scholar]
- Pegg AE, McCann PP. Polyamine metabolism and function. Am J Physiol. 1982;243:C212–C221. doi: 10.1152/ajpcell.1982.243.5.C212. [DOI] [PubMed] [Google Scholar]
- Petratos S, Li QX, George AJ, Hou X, Kerr ML, Unabia SE, Hatzinisiriou I, Maksel D, Aguilar MI, Small DH. The beta-amyloid protein of Alzheimer’s disease increases neuronal CRMP-2 phosphorylation by a Rho-GTP mechanism. Brain. 2008;131:90–108. doi: 10.1093/brain/awm260. [DOI] [PubMed] [Google Scholar]
- Phukan G, Shin TH, Shim JS, Paik MJ, Lee JK, Choi S, Kim YM, Kang SH, Kim HS, Kang Y, Lee SH, Mouradian MM, Lee G. Silica-coated magnetic nanoparticles impair proteasome activity and increase the formation of cytoplasmic inclusion bodies in vitro. Sci Rep. 2016;6:29095. doi: 10.1038/srep29095. [DOI] [PMC free article] [PubMed] [Google Scholar]
- Poulin R, Lessard M, Zhao C. Inorganic cation dependence of putrescine and spermidine transport in human breast cancer cells. J Biol Chem. 1995;270:1695–1704. doi: 10.1074/jbc.270.4.1695. [DOI] [PubMed] [Google Scholar]
- Ray RM, Zimmerman BJ, McCormack SA, Patel TB, Johnson LR. Polyamine depletion arrests cell cycle and induces inhibitors p21(Waf1/Cip1), p27(Kip1), and p53 in IEC-6 cells. Am J Physiol. 1999;276:C684–C691. doi: 10.1152/ajpcell.1999.276.3.C684. [DOI] [PubMed] [Google Scholar]
- Roede JR, Uppal K, Park Y, Lee K, Tran V, Walker D, Strobel FH, Rhodes SL, Ritz B, Jones DP. Serum metabolomics of slow vs. rapid motor progression Parkinson’s disease: a pilot study. PLoS One. 2013;8:e77629. doi: 10.1371/journal.pone.0077629. [DOI] [PMC free article] [PubMed] [Google Scholar]
- Roede JR, Uppal K, Park Y, Tran V, Jones DP. Transcriptome-metabolome wide association study (TMWAS) of maneb and paraquat neurotoxicity reveals network level interactions in toxicologic mechanism. Toxicol Rep. 2014;1:435–444. doi: 10.1016/j.toxrep.2014.07.006. [DOI] [PMC free article] [PubMed] [Google Scholar]
- Rohn G, Kocher M, Oschlies U, Hossmann KA, Paschen W. Putrescine content and structural defects in isolated fractions of rat brain after reversible cerebral ischemia. Exp Neurol. 1990;107:249–255. doi: 10.1016/0014-4886(90)90142-f. [DOI] [PubMed] [Google Scholar]
- Ruiz-Perez MV, Medina MA, Urdiales JL, Keinanen TA, Sanchez-Jimenez F. Polyamine metabolism is sensitive to glycolysis inhibition in human neuroblastoma cells. J Biol Chem. 2015;290:6106–6119. doi: 10.1074/jbc.M114.619197. [DOI] [PMC free article] [PubMed] [Google Scholar]
- Schymanski EL, Jeon J, Gulde R, Fenner K, Ruff M, Singer HP, Hollender J. Identifying small molecules via high resolution mass spectrometry: communicating confidence. Environ Sci Technol. 2014;48:2097–2098. doi: 10.1021/es5002105. [DOI] [PubMed] [Google Scholar]
- Shin TH, Phukan G, Shim JS, Nguyen DT, Kim Y, Oh-Lee JD, Lee HS, Paik MJ, Lee G. Restoration of polyamine metabolic patterns in in vivo and in vitro model of ischemic stroke following human mesenchymal stem cell treatment. Stem Cell Int. 2016;2016:4612531. doi: 10.1155/2016/4612531. [DOI] [PMC free article] [PubMed] [Google Scholar]
- Smith CA, O’Maille G, Want EJ, Qin C, Trauger SA, Brandon TR, Custodio DE, Abagyan R, Siuzdak G. METLIN: a metabolite mass spectral database. Ther Drug Monit. 2005;27:747–751. doi: 10.1097/01.ftd.0000179845.53213.39. [DOI] [PubMed] [Google Scholar]
- Smith MR, Fernandes J, Go YM, Jones DP. Redox dynamics of manganese as a mitochondrial life-death switch. Biochem Biophys Res Commun. 2017;482:388–398. doi: 10.1016/j.bbrc.2016.10.126. [DOI] [PMC free article] [PubMed] [Google Scholar]
- Sohn HS, Park YN, Lee SR. Effect of immobilization stress on brain polyamine levels in spontaneously hypertensive and Wistar-Kyoto rats. Brain Res Bull. 2002;57:575–579. doi: 10.1016/s0361-9230(01)00746-8. [DOI] [PubMed] [Google Scholar]
- Soltow QA, Strobel FH, Mansfield KG, Wachtman L, Park Y, Jones DP. High-performance metabolic profiling with dual chromatography-Fourier-transform mass spectrometry (DC-FTMS) for study of the exposome. Metabolomics. 2013;9:S132–S143. doi: 10.1007/s11306-011-0332-1. [DOI] [PMC free article] [PubMed] [Google Scholar]
- Tabor CW, Tabor H. Polyamines. Annu Rev Biochem. 1984;53:749–790. doi: 10.1146/annurev.bi.53.070184.003533. [DOI] [PubMed] [Google Scholar]
- Thomas T, Gallo MA, Klinge CM, Thomas TJ. Polyamine-mediated conformational perturbations in DNA alter the binding of estrogen receptor to poly(dG-m5dC). poly(dG-m5dC) and a plasmid containing the estrogen response element. J Steroid Biochem Mol Biol. 1995;54:89–99. doi: 10.1016/0960-0760(95)00126-k. [DOI] [PubMed] [Google Scholar]
- Uppal K, Soltow QA, Promislow DE, Wachtman LM, Quyyumi AA, Jones DP. MetabNet: an R package for metabolic association analysis of high-resolution metabolomics data. Front Bioeng Biotechnol. 2015;3:87. doi: 10.3389/fbioe.2015.00087. [DOI] [PMC free article] [PubMed] [Google Scholar]
- Uppal K, Soltow QA, Strobel FH, Pittard WS, Gernert KM, Yu T, Jones DP. xMSanalyzer: automated pipeline for improved feature detection and downstream analysis of large-scale, non-targeted metabolomics data. BMC Bioinf. 2013;14:15. doi: 10.1186/1471-2105-14-15. [DOI] [PMC free article] [PubMed] [Google Scholar]
- Uppal K, Walker DI, Jones DP. xMSannotator: an R package for network-based annotation of high-resolution metabolomics data. Anal Chem. 2017;89:1063–1067. doi: 10.1021/acs.analchem.6b01214. [DOI] [PMC free article] [PubMed] [Google Scholar]
- Uppal K, Walker DI, Liu K, Li S, Go YM, Jones DP. Computational metabolomics: a framework for the million metabolome. Chem Res Toxicol. 2016;29:1956–1975. doi: 10.1021/acs.chemrestox.6b00179. [DOI] [PMC free article] [PubMed] [Google Scholar]
- Vecsei L, Szalardy L, Fulop F, Toldi J. Kynurenines in the CNS: recent advances and new questions. Nat Rev Drug Discov. 2013;12:64–82. doi: 10.1038/nrd3793. [DOI] [PubMed] [Google Scholar]
- Walker DI, Mallon CT, Hopke PK, Uppal K, Go YM, Rohrbeck P, Pennell KD, Jones DP. Deployment-associated exposure surveillance with high-resolution metabolomics. J Occup Environ Med. 2016;58:S12–S21. doi: 10.1097/JOM.0000000000000768. [DOI] [PMC free article] [PubMed] [Google Scholar]
- Wang PY, Rao JN, Zou T, Liu L, Xiao L, Yu TX, Turner DJ, Gorospe M, Wang JY. Post-transcriptional regulation of MEK-1 by polyamines through the RNA-binding protein HuR modulating intestinal epithelial apoptosis. Biochem J. 2010;426:293–306. doi: 10.1042/BJ20091459. [DOI] [PMC free article] [PubMed] [Google Scholar]
- Wang Y, Xiao L, Thiagalingam A, Nelkin BD, Casero RA., Jr The identification of a cis-element and a trans-acting factor involved in the response to polyamines and polyamine analogues in the regulation of the human spermidine/spermine N1-acetyltransferase gene transcription. J Biol Chem. 1998;273:34623–34630. doi: 10.1074/jbc.273.51.34623. [DOI] [PubMed] [Google Scholar]
- Williams K. Interactions of polyamines with ion channels. Biochem J. 1997;325(Pt 2):289–297. doi: 10.1042/bj3250289. [DOI] [PMC free article] [PubMed] [Google Scholar]
- Wishart DS, Jewison T, Guo AC, Wilson M, Knox C, Liu Y, Djoumbou Y, Mandal R, Aziat F, Dong E, Bouatra S, Sinelnikov I, Arndt D, Xia J, Liu P, Yallou F, Bjorndahl T, Perez-Pineiro R, Eisner R, Allen F, Neveu V, Greiner R, Scalbert A. HMDB 3.0–the human metabolome database in 2013. Nucleic Acids Res. 2013;41:D801–D807. doi: 10.1093/nar/gks1065. [DOI] [PMC free article] [PubMed] [Google Scholar]
- Wu Z, Zhu Y, Cao X, Sun S, Zhao B. Mitochondrial toxic effects of Abeta through mitofusins in the early pathogenesis of Alzheimer’s disease. Mol Neurobiol. 2014;50:986–996. doi: 10.1007/s12035-014-8675-z. [DOI] [PubMed] [Google Scholar]
- Xie HR, Hu LS, Li GY. SH-SY5Y human neuroblastoma cell line: in vitro cell model of dopaminergic neurons in Parkinson’s disease. Chin Med J (Engl) 2010;123:1086–1092. [PubMed] [Google Scholar]
- Yu T, Park Y, Johnson JM, Jones DP. apLCMS–adaptive processing of high-resolution LC/MS data. Bioinformatics. 2009;25:1930–1936. doi: 10.1093/bioinformatics/btp291. [DOI] [PMC free article] [PubMed] [Google Scholar]
- Zahedi K, Huttinger F, Morrison R, Murray-Stewart T, Casero RA, Strauss KI. Polyamine catabolism is enhanced after traumatic brain injury. J Neurotrauma. 2010;27:515–525. doi: 10.1089/neu.2009.1097. [DOI] [PMC free article] [PubMed] [Google Scholar]
- Zhang F, Xu Z, Gao J, Xu B, Deng Y. In vitro effect of manganese chloride exposure on energy metabolism and oxidative damage of mitochondria isolated from rat brain. Environ Toxicol Pharmacol. 2008;26:232–236. doi: 10.1016/j.etap.2008.04.003. [DOI] [PubMed] [Google Scholar]
- Zhang HT, Mi L, Wang T, Yuan L, Li XH, Dong LS, Zhao P, Fu JL, Yao BY, Zhou ZC. PINK1/Parkin-mediated mitophagy play a protective role in manganese induced apoptosis in SH-SY5Y cells. Toxicol In Vitro. 2016;34:212–219. doi: 10.1016/j.tiv.2016.04.006. [DOI] [PubMed] [Google Scholar]
- Zhu Y, Hoell P, Ahlemeyer B, Sure U, Bertalanffy H, Krieglstein J. Implication of PTEN in production of reactive oxygen species and neuronal death in in vitro models of stroke and Parkinson’s disease. Neurochem Int. 2007;50:507–516. doi: 10.1016/j.neuint.2006.10.010. [DOI] [PubMed] [Google Scholar]
Associated Data
This section collects any data citations, data availability statements, or supplementary materials included in this article.