

Summary
Degrading vision by one eye during a developmental critical period yields enduring deficits in both eye dominance and visual acuity. A predominant model is that ‘reactivating’ ocular dominance (OD) plasticity after the critical period is required to improve acuity in amblyopic adults. However, here we demonstrate that plasticity of eye dominance and acuity are independent, and restricted by the nogo-66 receptor (ngr1) in distinct neuronal populations. Ngr1 mutant mice display greater excitatory synaptic input onto both inhibitory and excitatory neurons with restoration of normal vision. Deleting ngr1 in excitatory cortical neurons permits recovery of eye dominance but not acuity. Reciprocally, deleting ngr1 in thalamus is insufficient to rectify eye dominance but yields improvement of acuity to normal. Abolishing ngr1 expression in adult mice also promotes recovery of acuity. Together, these findings challenge the notion that mechanisms for OD plasticity contribute to the alterations in circuitry that restore acuity in amblyopia.
Introduction
Experience has a prominent role in sculpting brain circuitry during development, yet experience-dependent plasticity diminishes with age. Amblyopia exemplifies how reduced neural plasticity in adulthood impairs recovery from maladaptive alterations to brain circuitry arising during development. This prevalent childhood disorder is caused by discordant vision and results in a number of deficits in spatial vision including lower acuity [1]. Associated visual impairments are largely permanent if untreated before the closure of a ‘critical period’ that ends in adolescence. Although some therapeutic approaches have reported improvements in acuity in older patients [2], the critical period confines both the age of sensitivity to discordant vision as well as the opportunity for effective treatment.
The predominant model for the pathophysiology of amblyopia is that discordant vision exaggerates eye dominance and thereby limits processing of visual information from the affected eye and lowers visual performance. These maladaptive changes within visual circuitry are then consolidated with the closure of the critical period. Consistent with this model, perturbing vision through one eye by lid suture also yields enduring impairments in eye dominance and visual acuity in numerous mammals with binocular vision [3]. Although significant efforts have been put forth to understand the neurological basis of amblyopia, determining the relationship between abnormal eye dominance and low acuity has proven challenging.
Anatomical and physiological properties of cells in the retina, lateral geniculate nucleus (LGN), and visual cortex have been examined to understand how amblyopia changes the spatial organization and function of neurons within visual circuitry. Overall, there is consensus that amblyopia results in few permanent deficits in the retina (e.g. [4]). Whether amblyopia-induced changes to the relay neurons in LGN contribute to the observed deficits in visual acuity remains controversial (See Discussion). Primary visual cortex (V1) is considered a locus of amblyopia because of the loss of binocular responses following visual deprivation during the critical period [5].
Amblyopia can be induced in rodents by depriving one eye of vision for the duration of the critical period (long-term monocular deprivation, LTMD). LTMD drives a persistent shift in ocular dominance toward the non-deprived eye as measured by extracellular electrophysiological recordings in primary visual cortex (V1) [6–8]. This diminished representation of the deprived-eye in V1 is accompanied by a modest reduction in the distribution of thalamocortical axons subserving this eye [8]. LTMD also permanently decreases visual acuity of the previously deprived eye. One direct approach for measuring acuity in mice and rats is a behavioral assay assessing visually-guided performance, the visual water task (VWT) [9].
Mice constitutively lacking the gene for the neuronal nogo-66 receptor 1 (ngr1−/−) recover visual acuity following LTMD after 7 weeks of normal vision as measured with this task [10]. To date, ngr1 is the only gene yet implicated as limiting recovery of visually-guided performance. The protein product of the ngr1 gene (NgR1) is a leucine-rich repeat protein that is attached to the outer leaflet of the plasma membrane of neurons by a glycosyl-phosphatidylinositol (GPI) anchor. NgR1 has been reported to localize both to axons as well as dendrites and dendritic spines [11, 12], and is expressed in retina, lateral geniculate nucleus (LGN), and V1 [13, 14]. NgR1 is a receptor for several disparate extracellular ligands associated with myelin and perineuronal nets implicated in restricting anatomical and synaptic plasticity [15, 16].
Previously we generated a conditional allele of ngr1 (ngr1f/f) [17]. Deleting ngr1 in parvalbumin-positive (PV) interneurons prevents the closure of the critical period for ocular dominance (OD) plasticity. This sustained OD plasticity is accompanied by the capacity for short durations (1-2 days) of monocular deprivation (MD) to promote disinhibition within the intracortical circuitry of V1 [10, 18]. However, deleting ngr1 in PV interneurons is not sufficient to improve acuity following LTMD [18]. Thus, this OD plasticity observed with 4-day MD could be necessary but not sufficient for recovery of acuity, or OD plasticity and acuity could be independent.
Here we combine this conditional ngr1 allele with brain-region and cell-class specific Cre drivers to dissect where within the circuitry of the visual system plasticity is required to restore eye dominance and improve acuity in the murine model of amblyopia. We measure plasticity with electrophysiological recordings in vivo, circuit mapping in visual cortex by laser-scanning photostimulation, and the behavioural assay of visual acuity. Unexpectedly, we discover that while ngr1 operates within excitatory cortical neurons to limit the recovery of eye dominance following LTMD, improvement of visual acuity is independently governed by ngr1 expression in thalamus. We propose that alterations in circuitry sufficient to improve acuity in amblyopia do not require OD plasticity and identify subcortical circuitry as a target for therapeutic intervention.
Results
Recovery of normal eye dominance is preceded by increased excitatory synaptic input to both inhibitory and excitatory neurons in visual cortex
LTMD initiated early in the critical period (~P24) induces a permanent OD shift toward the non-deprived eye [7]. Mice lacking ngr1 display both normal eye dominance biased to the contralateral eye and sensitivity to LTMD during the critical period. However, ngr1 mutant mice partially recover contralateral bias within 8 days of restoration of binocular vision following LTMD [19]. To determine if a prolonged duration of binocular vision would yield a more complete recovery of normal eye dominance in ngr1(−/−) mice, we permitted 7 weeks of binocular vision following LTMD before performing extracellular electrophysiological recordings to measure OD in WT and ngr1(−/−) mice (Figure 1A).
Figure 1. Recovery normal eye dominance with 7 weeks of binocular vision following LTMD by ngr1(−/−) mice.
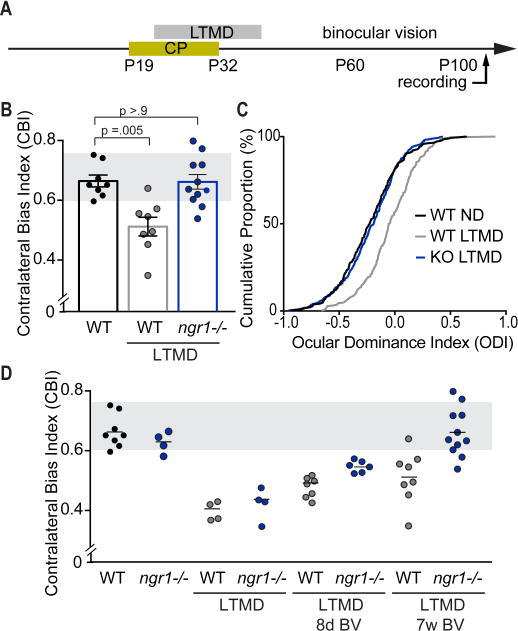
(A) Schematic of the timeline for long-term monocular deprivation (LTMD) and period of binocular vision prior to electrophysiologic recording to assess ocular dominance (OD) in adult (P90-P120) ngr1(−/−) and WT mice. (B) CBI scores for non-deprived WT mice (n=8), and WT and ngr1(−/−) mice receiving LTMD (n=8, 11). Groups receiving LTMD are underlined. Each point represents the CBI for an individual animal, and the bars represent the average for each group with error bars for SEM. The gray box indicates the typical range of CBI scores for non-deprived mice. (C) Cumulative histograms of OD scores for groups reported in (B) (WT, 288 units; WT LTMD 248 units; ngr1(−/−) LTMD 336 units). (D) A comparison of recovery of eye dominance following increasing duration of binocular vision (BV) subsequent to LTMD. CBI scores for WT and ngr1(−/−) mice during LTMD and following 8 days of BV were previously published in [19] and are presented here for comparison to 7 weeks after re-opening the closed eye. See also Figure S1.
Following 7 weeks of binocular vision, abnormal eye dominance is sustained in WT mice. WT mice exhibited a rightward shift in the OD histograms (Figure S1, Related to Figure 1), a significant decrease in the median contralateral bias index (CBI) score (Figure 1B; WT vs WT LTMD P = 0.005, Kruskal-Wallis (KW) test for multiple comparisons), and a rightward shift in the cumulative distribution of OD scores for individual units (Figure 1C; P < 0.0001, Kolmogorov-Smirnov (K-S) test of cumulative distribution). In contrast, ngr1(−/−) mice displayed normal eye dominance with 7 weeks of binocular vision following LTMD. The median CBI score and cumulative distribution of OD scores for individual units was not significantly different than non-deprived mice (Figure 1B,C; P > 0.9 CBI WT vs ngr1(−/−) LTMD; P = .72, K-S test). To evaluate the time course and magnitude of recovery of eye dominance for WT and ngr1(−/−) mice, we re-plotted these CBI scores after 7 weeks of binocular vision post-LTMD next to our published CBI scores for WT and ngr1 mutants after 4 weeks of LTMD, and LTMD followed by 8 days of binocular vision (Figure 1D) [19]. The limited recovery of eye dominance observed in WT mice at 8 days after re-opening the eye were sustained but not augmented by 7 weeks post-LTMD. By comparison, recovery of eye dominance by ngr1(−/−) mice with 8 days of binocular vision was similar to WT mice at 7 weeks, and continued to improve, reaching the normal range by 7 weeks. Thus, ngr1 limits recovery of normal eye dominance guided by restored binocular vision after the critical period.
An early and essential component of OD plasticity during the critical period is intracortical disinhibition [20]. MD occludes sensory input from the closed eye and this reduced input drives a compensatory weakening of cortical excitatory synapses onto interneurons expressing PV. This disinhibition is proposed to be permissive rather than instructive for subsequent shifts in eye dominance by competitive mechanisms. Recently, we demonstrated that ngr1 confines this disinhibition following MD to the critical period [18]. To investigate whether the restoration of vision and resulting recovery of eye dominance also engages plasticity within inhibitory circuitry, we examined the strength of excitatory synaptic drive onto PV interneurons in L2/3 with laser-scanning photostimulation for WT and ngr1(−/−) mice (Figure 2A-C)
Figure 2. Recovery of eye dominance and acuity are preceded by elevated intracortical excitatory synaptic input onto L2/3 PV interneurons.
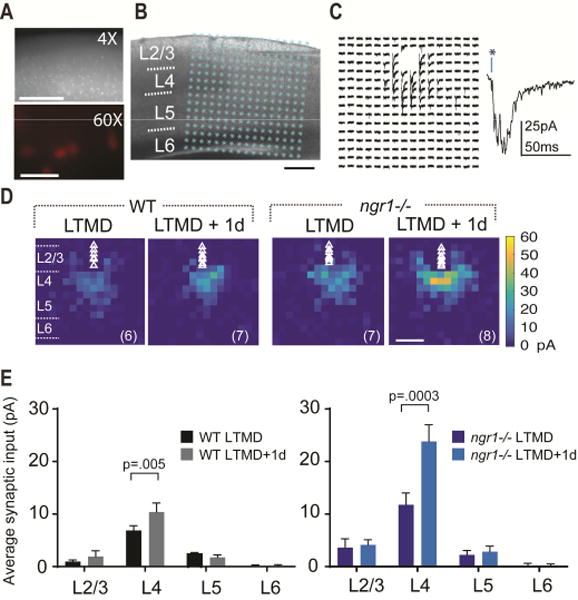
(A) Parvalbumin-positive (PV) interneurons identified in both WT and ngr1(−/−) mice by tdTomato expression from a Cre-dependent reporter in combination with PV-Cre. Scale bar = 0.5mm (top), 50 m (bottom). (B) Example of a L2/3 PV interneuron recorded in binocular V1 in an acute slice; overlaid are 16 ×16 stimulation locations for laser-scanning photostimulation (LSPS) spanning pia to white matter. Scale bar = 250 m. (C) Representative traces from LSPS evoked EPSCs measured across 16 × 16 locations (75 m spacing) for a L2/3 PV interneuron. Direct somatic responses have been removed for clarity. A higher magnification trace is shown at right. (D) LSPS aggregate excitatory input maps pooled across PV interneurons for WT and ngr1(−/−) mice during LTMD or after 1d of binocular vision. Triangles indicate soma locations; n = number of cells is in parentheses for each group. Scale bar = 250 m. (E) Mean LSPS-evoked EPSC amplitude from neurons recorded in (D) binned into L2/3, L4, L5, and L6. The mean LSPS-evoked amplitudes are greater for both genotypes following 1d of vision, but the magnitude of the increase is more than double in ngr1(−/−) mice. Ngr1 limits increased excitatory synaptic input onto PV interneurons in visual cortex with restoration of binocular vision. See also Figure S2.
We compared the strength and distribution of excitatory synaptic currents onto L2/3 PV interneurons after 4 weeks of LTMD (P24-P45) and LTMD followed by one day of binocular vision for WT and ngr1(−/−) mice (Figure 2 and Figure S2). Re-opening the sutured eye induced a modest but statistically significant increase in the excitatory synaptic input onto L2/3 PV neurons in V1 contralateral to the LTMD in WT mice (WT LTMD 6.9pA + 1.5 vs. WT LTMD+1d 10.4pA + 1.8; P = .005, Mann-Whitney (MW) test) (Figure 2E). By comparison, one day of vision doubled the average synaptic input from L4 in ngr1(−/−) mice (ngr1 LTMD 12.1pA + 1.9 vs. ngr1 LTMD+1d 23.8pA + 3.2) (P = .0003, MW test) (Figure 2E). Eye opening following LTMD did not alter the intrinsic excitability of PV interneurons to current injection for either WT or ngr1 mutant mice (Figure S2, Related to Figure 2), or the excitation profiles to glutamate uncaging (data not shown). Thus, plasticity within inhibitory cortical circuitry also precedes restoration of normal eye dominance with binocular vision following LTMD, but this OD plasticity is accompanied by a strengthening of cortical excitatory synapses onto PV interneurons rather than the weakening associated with brief MD.
To assess whether recovery of eye dominance with restoration of binocular vision was associated with alterations to the synaptic input onto thalamo-recipient L4 pyramidal neurons, we examined the frequency and amplitude of miniature excitatory post-synaptic currents (mEPSCs) after LTMD, LTMD followed by one day of binocular vision, and LTMD followed by 4 weeks of binocular vision, in both WT and ngr1(−/−) mice (Figure 3A). Restoring vision to the closed eye yielded a transient increase in the frequency of mEPSCs in WT mice, as after 4 weeks of binocular vision the frequency of events was significantly lower than after 1 day (P = .03; KW test) (Figure 3B). By comparison, the increase in the frequency of mEPSCs 1 day following re-opening the closed eye was sustained 4 weeks later in ngr1(−/−) mice (P > .9; KW test), and was significantly greater than the frequency of mEPSCs measured in WT mice at 4wks subsequent to LTMD (P = .008; KW test). Cumulative distributions for the amplitudes of mEPSCs from L4 pyramidal neurons were similar for WT and ngr1(−/−) mice during LTMD. However, the amplitudes of mEPSCs were significantly greater in ngr1 mutant mice from 1 day to 4 weeks following eye re-opening (P < .0001, K-S tests) (Figure 3C). The intrinsic excitability of L4 neurons was also indistinguishable between genotypes and deprivation conditions (Figure S3. Related to Figure 3). These sustained increases in mEPSC frequency and amplitude correlate with the spontaneous yet slow recovery of eye dominance and acuity in ngr1(−/−) mice.
Figure 3. A sustained increase in excitatory synaptic input onto L4 pyramidal neurons precedes recovery from visual deprivation.
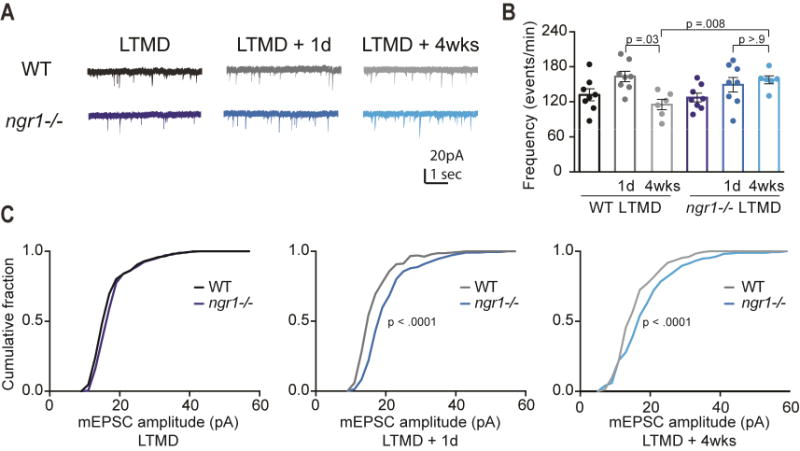
(A) Representative traces of spontaneous activity in V1 from acute slices from WT and ngr1(−/−) mice during LTMD, and LTMD followed by 1 day (1d) and 4 weeks (4wks) of binocular vision. (B) The frequency of mEPSCs for WT LTMD (n=8), LTMD+1d (n=8) and LTMD+4wks (n=6) as well as ngr1(−/−) mice in these conditions (n=8, 8, and 6 respectively). While both WT and ngr1(−/−) mice display elevated frequency of mEPSCs with eye-opening, this increase is only sustained in ngr1(−/−) mice (C) Cumulative distributions of mEPSC amplitudes for WT and ngr1(−/−) mice during LTMD, and LTMD followed by 1d and 4wks of binocular vision. ngr1(−/−) exhibit larger synaptic events at 1d that are also evident at 4wks. See also Figure S3.
Neocortex limits recovery of eye dominance following LTMD
NgR1 is expressed along the visual pathway in both the LGN of the thalamus as well as visual cortex [13]. To determine where NgR1 operates within visual circuitry to limit the recovery of eye dominance with binocular vision following LTMD, we examined mice possessing a conditional ngr1 allele (ngr1(f/f)) [17]. In this conditional allele, loxP sites flank exon 2 that contains the entire protein coding sequence of the mature receptor. In the presence of Cre recombinase, the expression of NgR1 is abolished, and GFP is expressed from the ngr1 gene locus (Figure S4. Related to Figure 4) [17]. In the absence of Cre recombinase, GFP expression is not detectable by immunofluorescence staining of coronal brain sections (Figure 4A).
Figure 4. Recovery of eye dominance following LTMD is restricted in neocortex by ngr1.
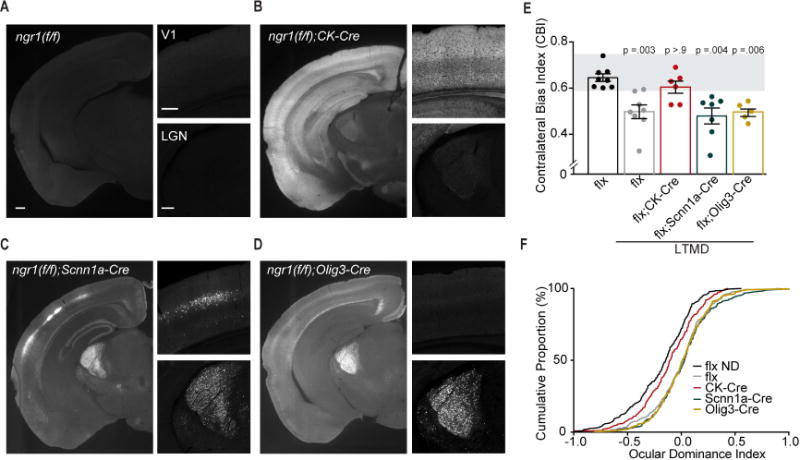
(A) Immunostaining for GFP in a coronal section from a ngr1(f/f) mouse. Positive staining for GFP indicates recombination of the ngr1(f/f) gene. The top right panel is an enlargement of V1, and the bottom right panel is an enlargement of thalamus from the same section as the wide field image on the left. Scale bars are equal to 225 m. (B)-(D) Immunostaining for GFP as in (A) for ngr1(f/f);CK-Cre, ngr1(f/f);Scnn1a-Cre, and ngr1(f/f);Olig-Cre mice. (E) CBI scores for ngr1(f/f) (flx) non-deprived mice (ND) (n=8), as well as flx (n=8), flx;CK-Cre (n=6), flx;Scnn1a-Cre (n=7), and flx;Olig-Cre (n=5) following LTMD and 6 weeks of binocular vision. Groups receiving long-term monocular deprivation (LTMD) are underlined. The grey box indicates the typical range of CBI values for non-deprived mice. Bars represent the average CBI score for each group with error bars for SEM. P-values for Kruskal-Wallis (KW) multiple comparison tests with Dunn’s correction to flx ND are presented above each column. (F) Cumulative histograms of ODI scores for flx ND (336 units), flx LTMD (326 units), flx;CK-Cre LTMD (240 units), flx;Scnn1a-Cre LTMD (296 units), flx;Olig-Cre LTMD (229 units). See also Figure S4 and S5.
OD plasticity is generally considered to originate in primary visual cortex as it does not require protein synthesis in LGN [21]. However, recent studies have reported some degree of binocularity and OD plasticity in thalamus of both juvenile and adult mice [22–24]. Therefore, we tested whether NgR1 expression in cortex restricts recovery of eye dominance following LTMD. We selectively abolished NgR1 expression in excitatory neurons in cortex and/or LGN by combining the ngr1 conditional allele with one of three transgenic Cre drivers (Figure 4B-D). We measured eye dominance in each of these lines after 6 weeks of binocular vision following LTMD with electrophysiologic recordings. Similar to WT mice, ngr1(f/f) mutants without Cre-mediated recombination display a persistent shift in ocular dominance toward the non-deprived eye (Figure 4E,F) (P = 0.003 CBI flx vs flx LTMD; KW test).
First, we selectively deleted ngr1 in cortical excitatory neurons with a transgene expressing Cre recombinase under the control of the calcium/calmodulin-dependent protein kinase II alpha (CamkIIa) promoter (CK-Cre) [25]. CamKIIa is expressed in excitatory neurons in forebrain and deletes ngr1 in cortex but not LGN (Fig. 4B). Abolishing NgR1 expression in cortex was sufficient for recovery of normal contralateral bias with extended binocular vision following LTMD as the median CBI and the cumulative distribution of OD scores for individual units for ngr1(f/f);CK-Cre mice having received LTMD and 6 weeks of normal vision were both similar to non-deprived ngr1(f/f) controls (Figure 4E,F).
Next, we directed the deletion of ngr1 to thalamus with two different Cre drivers: Scnn1a-Cre, and Olig3-Cre. Scnn1a-Cre drives recombination in thalamus and L4 excitatory cortical neurons (Figure 4C) [26]. Thalamic progenitor cells express the transcription factor Olig3 [27], and Olig3-Cre deletes ngr1 in thalamus but not neocortex (Figure 4D). After 6 weeks of binocular vision following LTMD, both ngr1(f/f);Scnn1a-Cre and ngr1(f/f);Olig3-Cre mice retain abnormal eye dominance similar to ngr1(f/f) mice. The median CBI scores for both strains were significantly lower than non-deprived ngr1(f/f) controls (Figure 4E) (P = 0.004 flx vs flx;Scnn1a-Cre LTMD; P = 0.006 flx vs flx;Olig3-Cre LTMD; KW test). Therefore, abolishing NgR1 expression in LGN does not permit recovery of normal eye dominance, providing additional evidence that NgR1 operates in cortex to govern OD plasticity. Furthermore, the limited recovery of normal contralateral bias in ngr1(f/f);Scnn1a-Cre mice reveals that deleting ngr1 only in L4 is not sufficient to restore normal eye dominance.
In addition, we performed a laminar analysis of OD to evaluate the degree of recovery of eye dominance within each cortical layer. Previously we reported that the partial recovery of contralateral bias in ngr1(−/−) mice can be attributed to plasticity in L2/3 and L5/6. However, this short period of binocular vision does not yield any recovery of OD in L4 [19]. In comparison, after 6 weeks of binocular vision, ngr1(f/f);CK-Cre mice had recovered normal eye dominance in L2/3 and L4, and near normal contralateral bias in L5/6 (Figure S5. Related to Figure 4), whereas ngr1(f/f);Scnn1a-Cre mice, ngr1(f/f);Olig3-Cre mice and ngr1(f/f) controls sustained abnormal eye dominance in each layer. Thus, we observe a recovery of normal OD in L4 with 6 weeks of binocular vision in ngr1(f/f);CK-Cre that was not evident after 7 days of vision in ngr1(−/−) mice [19]. Interestingly, the magnitude of recovery was also largest in L4.
Thalamus restricts recovery of visual acuity following LTMD
To determine where NgR1 expression is required to limit improvement of visual acuity following LTMD, we tested these combinations of the ngr1 conditional allele and Cre drivers with the visual water task (VWT). The VWT is a two-alternative forced-choice task that measures visual acuity [28]. Mice were trained on the task during binocular vision following LTMD and then we evaluated acuity through the previously deprived eye immediately thereafter (Figure 5A). Mice with lower visual acuity fail the task at lower spatial frequencies in this behavioural assessment of visually-guided performance (Figure 5B). WT and ngr1(f/f) mice exhibit a persistent deficit in visual acuity following LTMD (Figure 5C) [9, 10], whereas ngr1(−/−) mice recover normal visual acuity on this task with extended binocular vision [10].
Figure 5. Thalamus restricts recovery of visual acuity following LTMD.
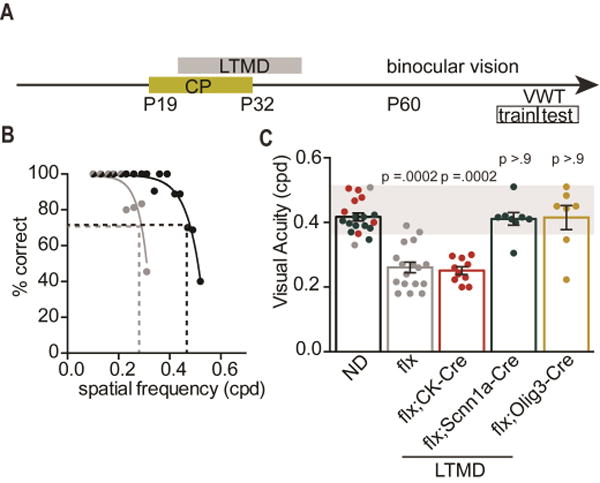
(A) Schematic of the timeline for long-term monocular deprivation (LTMD) and the period of binocular vision prior to the visual water task (VWT) to assess visual acuity in adult (P90) mice. The VWT proceeds in two phases: training and testing. (B) Performance of a representative ngr1(f/f) mouse that is non-deprived (black) or has received LTMD (grey). (C) Acuity of ND ngr1(f/f) mice (n=19) measured through one eye, and acuity following LTMD and 6 weeks of binocular vision for ngr1(f/f) (flx) (n=17), ngr1(f/f); CK-Cre (flx;CK-Cre) (n=10), ngr1(f/f); Scnn1a-Cre (flx;Scnn1a-Cre) (n=8), ngr1(f/f); Olig3-Cre (flx;Olig3-Cre) mice (n=7) measured through the previously deprived eye. Groups having received LTMD are underlined. See also Figure S6.
First, we examined mice lacking ngr1 in cortical excitatory neurons. The median threshold for visual acuity was lower in ngr1(f/f);CK-Cre mice following LTMD than in non-deprived controls (Figure 5C; P = 0.0002; KW test). Surprisingly, although deleting ngr1 selectively in cortex permitted the restoration of normal eye dominance (Figure 4), it did not promote recovery of acuity. In contrast, when ngr1 was deleted from thalamus, visual acuity for these mice was indistinguishable from non-deprived controls (Figure 5E; P > 0.9 flx vs flx;Scnn1a-Cre and flx vs flx;Olig3-Cre). Thus, abolishing NgR1 expression in thalamus permits recovery of visual acuity by the previously deprived eye in murine amblyopia, despite abnormal eye dominance.
NgR1 is also expressed in the retina [34], and we considered the alternative hypothesis that NgR1 limits the recovery of acuity by preventing experience-dependent remodeling in this earliest structure in the visual pathway. To examine the potential contribution of plasticity limited by ngr1 in the retina to the recovery of visual acuity, we examined the recombination of ngr1(f/f) sections of retina from each of the strains tested for recovery of eye dominance and acuity (Figure S6. Related to Figure 5). We stained retinas of ngr1(f/f), ngr1(f/f);CK-Cre, ngr1(f/f);Scnn1a-Cre and ngr1(f/f);Olig-Cre mice for GFP, a marker of Cre-mediated deletion of ngr1 (Figure S4). The ngr1(f/f) allele was recombined in a subset of cells in the retina of ngr1(f/f);Scnn1a-Cre and ngr1(f/f);CK-Cre mice, but not ngr1(f/f), or ngr1(f/f);Olig3-Cre mice. The absence of recombination paired with the recovery of visual acuity in ngr1(f/f);Olig3-Cre mice does not support a role for NgR1 in retina to promote the recovery of acuity.
Deleting ngr1 after the onset of amblyopia promotes recovery of visual acuity
To assess the potential therapeutic relevance of neutralizing NgR1 for treating amblyopia in adults, we used a pharmacogenetic approach to delete ngr1 after the closure of the critical period. We employed the ngr1(f/f) allele together with a fusion protein linking Cre-recombinase with a mutated version of the estrogen receptor (ER-Cre) [29] (Figure 6A). Tamoxifen injection into ngr1(f/f);ER-Cre mice abolishes NgR1 expression within 7 days (Figure 6B) [17]. Mice received tamoxifen (1mg/10g i.p. for 3 days) immediately before eye opening at P42 but after the closure of the critical period (~P32). Thereafter we measured visual acuity with the VWT after 6 weeks of binocular vision. When NgR1 expression was abolished in these young adult mice (~P50), visual acuity after 6 weeks of binocular vision was near normal and significantly greater than ngr1(f/f) controls which were also treated with tamoxifen (p = 0.0003; MW test) (Figure 6C). Thus, abolishing NgR1 expression after the critical period improves acuity in this murine model of amblyopia.
Figure 6. Visual acuity is restored following LTMD with deletion of ngr1 after the critical period.
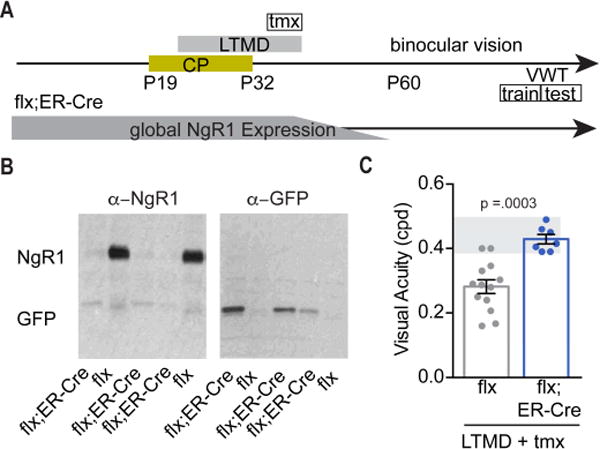
(A) Schematic of the timeline for tamoxifen (tmx) administration and LTMD prior to the period of binocular vision that precedes the visual water task (VWT) to assess visual acuity in adult (P90) mice. The VWT proceeds in two phases: training and testing. Following administration of tamoxifen (tmx), the global expression of NgR1 is nearly completely absent after 7 days. (B) Representative immunoblots confirm the recombination of ngr1 in ngr1(f/f); ER-Cre (flx;ER-Cre) mice following testing on the VWT. (C) Acuity following LTMD and 6 weeks of binocular vision for ngr1(f/f) (flx) (n=13), and ngr1(f/f);ER-Cre (flx;ER-Cre) (n=7) mice measured through the previously deprived eye. Groups having received LTMD and treatment with tamoxifen are underlined.
Discussion
Amblyopia comprises several deficits in spatial vision but the relationships between these different facets of vision remain poorly understood. A predominant model for the pathophysiology of amblyopia holds that abnormal vision engages OD plasticity during the critical period to exaggerate eye dominance, that in turn impairs visual performance through the affected eye, and these maladaptive changes to visual circuitry are consolidated with the close of the critical period. Consequently, reopening the critical period for eye dominance has been considered central to the effective treatment of amblyopia, and approaches to enhance OD plasticity have been pursued for nearly 30 years [30]. Yet the fundamental relationship between eye dominance and acuity has not been resolved. The results presented here reveal that the neural circuit mechanisms underlying recovery of these two components of visual system function are independent.
In animal models for amblyopia including rodents, MD shifts eye dominance away from the affected eye and reduces acuity [3, 9, 31, 32]. Several manipulations that promote OD plasticity after the critical period also promote recovery of visual acuity following LTMD [33]. Environmental manipulations including environmental enrichment and dark exposure enhance OD plasticity and increase visual acuity following LTMD [34–36]. Pharmacologic interventions also link OD plasticity and visual acuity. Rats treated with fluoxetine, a serotonin-specific reuptake inhibitor, or physostigmine, a cholinesterase inhibitor, display OD plasticity as adults and greater visual acuity following LTMD [37, 38]. In addition, two genes that are also required to close the critical period, lynx1 and pirb, have also been implicated as factors that limit acuity [38, 39]. These latter studies employ visually-evoked potentials (VEPs) to estimate acuity, whereas we have demonstrated that ngr1 limits improvement of behavioral acuity. Where within the circuitry of the visual system any of these approaches may operate to promote the plasticity requisite for restoration of eye dominance and acuity remains unknown.
An early and essential component of OD plasticity during the critical period is a decrease in excitatory synaptic drive onto PV interneurons with MD [20]. NgR1 confines this disinhibition to the critical period [18]. Here we demonstrate that ngr1 mutant mice recover normal eye dominance with restoration of binocular vision following LTMD. Opening the closed eye following LTMD returns the major source of sensory input to visual cortex. One day of normal vision increased excitatory synaptic drive onto PV interneurons in visual cortex in both WT and ngr1 mutants, but the relative magnitude was substantially greater in ngr1(−/−) mice. Restoring binocular vision also resulted in a sustained elevation to the frequency and magnitude of mEPSC frequency and magnitude by L4 pyramidal neurons in ngr1(−/−) mice. These synaptic changes preceded eventual improvements in eye dominance and acuity by several weeks. As adult ngr1(−/−) mice recover both eye dominance and acuity, this provides a framework for identifying the neural circuits that limit recovery of these facets of visual function in the murine model of amblyopia.
Here we employed a genetic dissection strategy to determine where ngr1 expression is required to limit recovery of eye dominance and improvement of acuity following restoration of binocular vision. Genetic and pharmacologic studies identify visual cortex as the locus of OD plasticity [21, 40, 41], but recent reports have also implicated thalamus [23, 24]. We determined that abolishing ngr1 expression in excitatory cortical neurons with CK-Cre permitted the recovery of eye dominance. Yet the restoration of normal eye dominance in ngr1 flx/flx;CK-Cre mice was insufficient to improve acuity. By comparison, deleting ngr1 selectively in L4 excitatory neurons and thalamus with Scnn1a-Cre, or thalamus alone with Olig3-Cre did not affect eye dominance, which remained similar to ngr1 flx mice lacking Cre expression and WT mice.
NgR1 does not appear to function by limiting cell-intrinsic OD plasticity. Deleting ngr1 in L4 with Scnn1a-Cre does not yield cell-intrinsic recovery of eye dominance confined to L4. Reciprocally, abolishing ngr1 in PV interneurons promotes OD plasticity by putative excitatory neurons across all layers of V1 following 4 days of MD [10]. We propose that ngr1 gates OD plasticity for the cortical circuit as a whole rather than operating independently within each layer.
Unexpectedly, acuity recovered to normal levels in both ngr1 flx/flx; Scnn1a-Cre and ngr1 flx/flx; Olig3-Cre mice. These findings with two distinct Cre driver lines that direct expression in thalamus implicate plasticity within neurons of this subcortical structure as sufficient to improve acuity following LTMD. The independent recovery of eye dominance and acuity challenge the notion that mechanisms for OD plasticity contribute to the alterations in circuitry required to improve acuity in amblyopia.
The circuit alterations induced by visual deprivation that impair acuity have not been elucidated. We propose that alterations to thalamocortical circuits rather than abnormal eye dominance are a principal constraint on recovery of acuity in the mouse visual system following early abnormal vision. Low acuity may be a consequence of an overall shift in the tuning of neurons in thalamus and/or V1 to lower spatial frequencies, or lower spatial frequency cut-offs for the population of neurons tuned to the highest spatial frequencies. We anticipate these tuning properties either arise in thalamus and/or visual cortex independent of eye dominance. However, one study has reported a slight increase in average spatial tuning for neurons with greater contralateral bias [42].
Consequently, characterizing how NgR1 may function to limit recovery of acuity within thalamic circuits will require further study. Several mechanisms for the loss and recovery of acuity have been proposed, including contrast sensitivity and inhibitory tone. When TrkB signaling is inhibited in adult mice, acuity estimated by intrinsic signal imaging of V1 decreases while OD plasticity and receptive field size are unaffected [43]. This lower acuity was correlated with a reduction in perceived contrast. However, perceived contrast sensitivity is cortex-dependent [44], whereas ngr1 operates in thalamic neurons to limit recovery of acuity. Pharmacologic and environmental manipulations proposed to decrease inhibitory tone are also associated with improvements in visual acuity following LTMD [45]. Ngr1(−/−) mice exhibit a slight decrease in cortical inhibition and improved acuity following LTMD. However, this reduction in cortical inhibition is also present when ngr1 is deleted from PV interneurons (ngr1(f/f);PV-Cre), yet there is no associated recovery of visual acuity despite sustained OD plasticity with brief MD [10].
A third possibility is neutralizing extracellular factors that restrict anatomical plasticity could contribute to improving acuity following LTMD. The digestion of CSPGs in visual cortex by chondroitinase ABC (chABC) promotes OD plasticity and the recovery of acuity following LTMD in rats [41, 46]. NgR1 is a receptor for CSPGs as well as inhibitors of neurite outgrowth associated with myelin membranes [14, 15]. CSPGs are enriched around PV interneurons in visual cortex and these structures elaborate with the closure of the critical period and maturation of visual acuity [47]. One possible mechanism is that NgR1 operates presynaptically on thalamocortical axons to impede recovery of acuity following LTMD by binding CSPGs tethered to perineuronal nets and limiting the experience-dependent reorganization of synaptic connections by thalamic relay neurons onto PV interneurons and nearby pyramidal neurons.
Spine density is decreased in primary visual cortex following LTMD in the hemisphere contralateral to the deprivation and restored by several approaches that both promote OD plasticity and improve acuity, including injection of chABC (reviewed by [45]). NgR1 has been proposed as a regulator of the set point for spine dynamics. Suppressing NgR1 expression in primary hippocampal neurons by RNA interference increases the density of excitatory synapses in vitro [12], and ngr1 mutant mice have been reported to display dramatically increased basal turnover of dendritic spines in vivo [48]. Yet, spine density is normal in ngr1(−/−) mice and we are unable to reproduce the reported elevated spine dynamics in vivo, despite performing similar, if not identical, experiments [19, 49].
The recovery of acuity in mice lacking ngr1 is markedly slower than that observed for several manipulations that also improve acuity. Chondroitinase ABC, fluoxetine, and a soluble competitive inhibitor of PirB, are all reported to restore acuity following LTMD to normal levels within 7 days of administration [37, 39, 46]. In contrast, acuity in ngr1(−/−) mice 7 days after eye opening remains low and similar to WT mice. More than a month of binocular vision is required to improve acuity in ngr1 mutant mice, a duration similar to the normal maturation of acuity measured with the visual water task [10]. Perhaps this more gradual recovery of acuity operates through mechanisms similar to this developmental process.
What then are the potential implications of these findings for the treatment of amblyopia? Mice possess a relatively small binocular zone and poor acuity [3, 28]. The significant redistribution of thalamocortical arbors with extended visual deprivation observed in predatory mammals is not evident in rodents as they lack ocular dominance columns [8, 50]. Differences in the branching of individual thalamocortical axons subserving the deprived and non-deprived eye have been reported in mice following LTMD, but these are subtle by comparison [8]. In addition, the magnitude of the shift in eye dominance and decrement in acuity is also less than that observed in cats and primates following early visual deprivation [16]. However, mice and cats exhibit comparable eye dominance with the return of binocular vision. In mice, the representation of the deprived eye in V1 is similar to the fellow eye with a month of binocular vision after LTMD. In kittens, a substantial fraction of cortical neurons also strongly respond to the deprived eye with a month of binocular vision following 7-10 days of MD during the critical period despite sustained low acuity [51, 52]. Thus, while the mouse may not recapitulate aspects of severe amblyopia in which the cortical representation of the affected eye is quite low or non-detectable, the mouse shares characteristics with the cat for studying more moderate deficits in spatial vision resulting from visual deprivation.
The genetic resources for the mouse also provide opportunities for insight not possible in other species. In particular, the role of the thalamic circuitry in amblyopia has proven difficult to characterize. Several studies have measured decreased cellular acuity in LGN of amblyopic animals (e.g. [53]), while others have made similar measurements but did not observe any cellular deficits (e.g [54]). Here we employed conditional genetics only available in the mouse to demonstrate that plasticity within thalamic circuitry is sufficient for recovery of normal acuity. Moreover, many fundamental aspects of circuitry in the visual system are conserved between rodents and other mammals including linear versus nonlinear spatial summation, contrast-invariant tuning, selectivity for stimulus parameters such as orientation and spatial frequency, and the sensitivity of eye dominance and acuity to visual deprivation during a defined developmental critical period [55]. Thus, we propose that while the more complex circuitry of the visual system in humans may present additional challenges to recovery from amblyopia, our findings here that the neural plasticity for the recovery of eye dominance and acuity are independent inform understanding of the clinical disorder.
STAR Methods
Contact for Reagent and Resource Sharing
Further information and requests for resources and reagents should be directed to and will be fulfilled by the lead contact, Aaron W. McGee (aaron.mcgee@louisville.edu). Requests for mouse strains developed by third parties will be directed to the appropriate contact.
Experimental Model and Subject Details
Mice
The constitutive ngr1/rtn4r (−/−) and conditional ngr1/rtn4r (f/f) mouse strains were a gift of Dr. Stephen Strittmatter, Yale University School of Medicine [17, 56]. The constitutive mutant mice had been repeatedly backcrossed onto the C57Bl6J background to at least F8. WT (C57Bl6J; The Jackson Laboratory, strain 00664) and ngr1(−/−) were crossed onto the background PV-Cre; Ai14(RCL-tdT) for LSPS circuit mapping (strain numbers 017320 and 007914, respectively) [10].
The conditional strain to F6 before being rederived (strain number 00664). The ngr1(f/f) line was backcrossed against the C57Bl6J background to at least F8. Subsequently, the ngr1(f/f) line was backcrossed against C57Bl6J with either the CK-Cre, Scnn1a-Cre, Olig3-Cre or ER-Cre driver strains [25, 26, 29]. The CK-Cre, Scnn1a-Cre, and ER-Cre driver strains were imported from Jackson Labs (strain numbers 005359, 009613, 004682, respectively). The Olig3-Cre driver line was a generous gift of Dr. Yasushi Nakagawa (University of Minnesota) [27].
Experiments and procedures were performed on both adult male and female mice by an experimenter blind to genotype. Mice were group housed and maintained on a 12-hr light/dark cycle under standard housing conditions. For experimental and control groups including the ngr1(f/f) line, experiments were performed on littermates. Genotyping was performed using custom primer sets for polymerase chain reaction (PCR) amplification with REDExtract-N-Amp PCR kit (XNAT, Sigma). Mice for the ngr1(f/f)+Cre groups were generated by crossing ngr1(f/f); Cre dams with ngr1(f/f) males. All mice were genotyped for germline recombination of the ngr1 allele. Mice with germline recombination were ejected from the study.
All procedures and care were performed in accordance with the guidelines of the Institutional Animal Care and Use Committees at Children’s Hospital Los Angeles and the University of Louisville.
Method Details
Monocular Deprivation (MD)
One eye was closed on postnatal day 24 (P24) using a single mattress suture tied with 6-0 polypropylene monofilament (Prolene 8709H; Ethicon) under brief isoflurane anesthesia (2%). The knot was sealed with cyanoacrylate glue. The suture was removed 3 weeks later at P45 with fine iridectomy scissors and the eyes were flushed with sterile saline. The eye was examined under a stereomicroscope and animals with scarring of the cornea were eliminated from the study. Following eye-opening, mice received a 6-week period of binocular vision prior to electrophysiological recording or the visual water task.
Electrophysiological Recordings in Visual Cortex
Recording methods were adapted from previously published methods [10, 57]. In brief, mice were anesthetized with isoflurane (4% induction, 2% maintenance in O2 during surgery) rather than barbiturates (Nembutal) as we have used in preceding studies [10, 57]. The mouse was placed in a stereotaxic frame and temperature was maintained at 37°C by a homeostatically-regulated heat pad (TCAT-2LV, Physitemp). Dexamethasone (4 mg/kg s.c.; American Reagent) was administered to reduce cerebral edema. The eyes were flushed with saline and the corneas were protected thereafter by covering the eyes throughout the surgical procedure and with frequent application of saline. A craniotomy was made over visual cortex in the left hemisphere and a metallic head bar was attached with cyanoacrylate glue over the right hemisphere to immobilize the animal during recording. Prior to transfer to the recording setup, a dose of chlorprothixene (0.5 mg/kg i.p.; C1761, Sigma) was administered to decrease the level of isoflurane required to maintain anesthesia to 0.6% [58].
Recordings were made with Epoxylite-coated tungsten microelectrodes with tip resistances of 5–10 MΩ (FHC). The signal was amplified (model 3600; A-M Systems), low-pass filtered at 3000Hz, high-pass filtered at 300Hz, and digitized (micro1401; Cambridge Electronic Design). Single-unit activity was recorded from four to six locations separated by >90 m in depth for each electrode penetration. In each mouse, there were four to six penetrations separated by at least 200 m across the binocular region of primary visual cortex, defined by a receptive field azimuth < 25°. Responses were driven by drifting sinusoidal gratings (0.1cpd, 95% contrast), presented in six orientations separated by 30° (custom software, MATLAB) [10]. The gratings were presented for 2s of each 4s trial. The grating was presented in each orientation in a pseudorandom order at least four times, interleaved randomly by a blank, which preceded each orientation once. Action potentials (APs) were identified in recorded traces with Spike2 (Cambridge Electronic Design). Only waveforms extending beyond 4 standard deviations above the average noise were included in subsequent analysis. For each unit, the number of APs in response to the grating stimuli was summed and averaged over the number of presentations. If the average number of APs for the grating stimuli was not greater than 50% above the blank, the unit was discarded.
The ocular dominance index (ODI) was calculated for each unit by comparing the number of APs elicited in a given unit when showing the same visual stimulus to each eye independently. Units were assigned to one of seven OD categories (1-7) where units assigned to category 1 are largely dominated by input from the contralateral eye, and units assigned to category 7 are largely dominated by input from the ipsilateral eye [59]. To categorize each unit, the average number of APs elicited by the blank was subtracted from the average number of APs elicited by the gratings for the contralateral eye (CE) and the ipsilateral eye (IE). Next, the ocular dominance index (ODI), given by ODI = (IE -CE)/(IE + CE) was calculated for each unit and assigned to OD categories 1-7 as follows: −1 to −0.6 = 1, −0.6 to −0.4 = 2, −0.4 to −0.1 = 3, −0.1 to 0.1 = 4, 0.1 to 0.4 = 5, 0.4 to 0.6 = 6, 0.6 to 1 = 7. Finally, the sum of the number of cells in each category was used to calculate the CBI for each animal with the formula: CBI = [(n1 – n7) + (2/3)(n2 – n6) + (1/3)(n3 – n5) + N]/2N where N is the total number of units and nx is the number of units with OD scores equal to x [3].
Immunohistochemistry
Mice were deeply anesthetized with Ketamine HCl (200mg/kg, Phoenix pharmaceuticals)/Xylazine (20mg/kg, Lloyd Laboratories) and the eyes were enucleated prior to transcardial perfusion with phosphate buffered saline (PBS; ChemCruz SC-362299) followed by a buffered 4% paraformaldehyde (PFA)/PBS (Acros Organics 416780030). Eyes were dissected in refrigerated HyClone Dulbecco’s Modified Eagles Medium (GE Healthcare Life Sciences). The eyecups were then immersion-fixed in 4% PFA/PBS for 1 hour and cryoprotected overnight in 30% sucrose. The eyecups were then sectioned at 16-20μm with a cryostat (Leica Microsystems), mounted onto SuperFrost Plus slides (Fischer), and stored at −20°C. Brains post-fixed overnight in 4% PFA/PBS. Free-floating 50μm sections were cut on a vibrating microtome (Leica VT 1000S) in cool PBS and preserved in PBS containing 0.05% sodium azide (Sigma-Aldrich S8032).
Coronal sections containing visual cortex and LGN were washed in PBS (3 × 5 minutes) and incubated in blocking solution, 3% normal donkey serum (NDS; Jackson ImmunoResearch) in PBS containing 0.1% Triton X-100 (Sigma-Aldrich T9284) (PBS-T) for 1 h at room temperature. The primary antibody rabbit anti-GFP (Novus, NB600-308) was diluted in blocking solution to 1μg/ml and sections incubated in primary antibody overnight at 4°C. After repeated washing in PBS-T (3 × 30 min), sections were incubated in Alexa 488-conjugated secondary antibody (Jackson Immuno Research, 1:200 in blocking solution) overnight at 4°C. The first amon g a final series of washes contained Hoechst (1:10000 in PBS-T, Santa Cruz Biotech)(1 × 10min), followed by PBS-T (2 × 30min) and PBS (1 × 10min). Finally, sections were mounted onto SuperFrost Plus slides (Fisher) with SlowFade Gold anti-fade reagent (Life technologies). Images of the entire hemisphere containing V1 and LGN were captured using a Leica MZFLIII fluorescence stereoscope with a 1.0× PLAN-APO lens. High magnification images of V1 and LGN from coronal sections stained with anti-GFP were captured with an LSM-710 confocal microscope with a 20× 0.4 NA objective (Zeiss). Hoechst staining was utilized to demarcate visual cortex and LGN. Several images were required to capture the entirety of V1 and LGN. Images were merged with Zeiss ZEN software.
Immunohistochemical labeling of retinal sections was performed as previously described [60]. Retinal sections were incubated in a solution of 10% NDS and 0.5% Triton X-100 in 0.1M PBS for 1 h at room temperature. The blocking solution was washed away and the sections were incubated for 12-16 h at 4°C in a humidified chamber in the dark in a primary antibody solution containing the primary anti-GFP antibody (2.5 g/ml) (Molecular Probes, A-21311), 3%NDS, and 0.5% Triton X-100 in 0.1M PBS. The primary antibody was directly conjugated to Alexa 488. Then, retinal sections were washed in PBS, and incubated in a control Alexa 594-conjugated secondary antibody (2 μg/ml) (Jackson Immuno Research) for 1 h at room temperature in the dark. After a final wash, the sections were cover-slipped with Fluoromount-G (Southern Biotech). Images of the retina were captured with an LSM-710 confocal microscope with a 20× 0.4 NA objective (Zeiss).
Patch clamp recording and LSPS
Recording methods are previously published [10, 61]. Electrophysiological recording and LSPS mapping experiments were performed on P45-50 and P110-120 mice on the background PV-Cre; Ai14. Mice were decapitated under deep isoflurane anesthesia. The visual cortex at the level of V1 was sectioned into 350μm coronal slices using a vibratome (VT1200S; Leica Systems) in ice-cold artificial cerebrospinal fluid (ACSF, containing in mM: 126 NaCl, 26 NaHCO3, 2 CaCl2, 2 MgCl2, 2.5 KCl, 1.25 NaH2PO4, and 10 glucose). The slices were then incubated for 30 min at 32 °C in ACSF saturated with 95% O2 and 5% CO2, and maintained at room temperature in ACSF for at least 30 min before being used for recording.
Visual cortex slices were transferred to a recording chamber mounted on a motorized stage (Sutter Instruments, Novato, CA), visualized with a microscope (BX51WI; Olympus, Tokyo, Japan) under infrared differential interference contrast (DIC) optics and an epifluorescent light source. The V1 binocular zone was identified based on the laminar and cytoarchitectonic features and the coordinates [62]. Patch clamp recording and LSPS mapping were performed as described previously [61]. Slices were first visualized with a 4× objective (NA 0.13, Olympus) to select the laminar location of neurons. Digital slice images were then acquired with a CCD camera (Retiga 2000DC, Qimaging, Surrey, BC, Canada), and used for registering photostimulation locations. Neurons were then patch clamped with a 60× water immersion objective (LUMPlanFl, NA 0.9, Olympus). PV interneurons (labeled by td-Tomato) in binocular zone were identified under DIC and epifluorescence for patch clamp whole-cell recording. Electrophysiological signals were amplified with a Multiclamp 700B amplifier (Molecular Devices, Sunnyvale, CA) and digitized at 10 kHz with BNC 6259 data acquisition boards (National Instruments, Austin, TX) that are controlled by Ephus software (https://openwiki.janelia.org/). The patch electrode was pulled from borosilicate glass (4-6 M electrical resistance). Intrinsic neuronal properties were measured in current-clamp mode by injecting current steps (1-sec duration, −100 to +500 pA in 50 pA increments), from which current injection – firing frequency was calculated. Series resistance (Rs) was monitored throughout recordings in voltage clamp mode, only stable (<15% change) cells with Rs < 30 M throughout the recordings were included for analyses.
LSPS mapping on visual cortex slices was carried out at room temperature. The chamber was perfused with modified ACSF with higher concentrations of magnesium and calcium (in mM: 126 NaCl, 2.5 KCl, 26 NaHCO3, 4 CaCl2, 4 MgCl2, 1.25 NaH2PO4, and 10 glucose) at 2-3 ml/min [61]. This modified ACSF also contains 5 M R-CPP (to block NMDA-receptor currents and plasticity) and 0.2 mM MNI-caged glutamate (both from Tocris-Cookson). The electrode internal solution contains (in mM) 130 K-gluconate, 4 KCl, 2 NaCl, 10 HEPES, 4 ATP-Mg, 0.3 GTP-Na and 14 phosphocreatine (pH 7.2, 295 mOsm). Neuronal cell bodies were at least 50 m below the surface of the slice to maximize preservation of local cortical connectivity. LSPS was performed through a 4× objective lens (NA 0.13, Olympus). 20-mW, 1-millisecond UV laser (350nm, DPSS Lasers) pulses were scanned onto the sample after passing an electro-optical modulator (Conoptics, Danburry, CT) and a mechanical shutter (Uniblitz, Rochester, NY). Triggered acquisition of whole cell currents in patch-clamped neurons were recorded under voltage clamp. A stimulus grid (16 × 16, 75 m spacing) was overlaid on the binocular V1 region, spanning from pia to white matter. For each L2/3 PV neuron, the stimulation grid was centered horizontally over the soma, and the top row was aligned with the pia. PV neurons were voltage clamped at −70mV during the LSPS UV laser uncaging. In some experiments where excitation profiles were collected from L4 neurons [61, 63, 64], which provide major synaptic inputs to the L2/3 PV neurons, loose-seal recordings were made from these L4 pyramidal neurons. The spike-generating sites of neurons were mapped using an 8-by-8 stimulus grid with 50μm spacing with the cells in current clamp mode. To measure spontaneous miniature excitatory synaptic currents (mEPSCs) from L4 pyramidal neurons, the perfusate ACSF contains additional 1μM TTX and 10μM bicuculline. Whole cell recording was obtained in these neurons (voltage clamped at −70 mV) using the same electrode internal solution as the LSPS experiments, and signals were acquired using the Digidata 1440A interface controlled by pClamp10.4 (Molecular Devices, Sunnyvale, CA).
Visual Water Task
Visual acuity was estimated with the Visual Water Task [9, 10, 28]. In brief, two monitors were positioned at the wide end of a trapezoidal tank behind clear plexiglass. One monitor displayed a sinusoidal spatial frequency grating at 95% contrast, while the other displayed an isoluminant grey screen. The luminance of the two monitors was matched and gamma corrected with computer software (Eye-One Match 3). Inside the tank, the monitors were separated by a 46cm divider. The spatial frequency was determined relative to the length of this divider. The tank was filled with water and a hidden platform submerged below the surface of the water in front of the monitor displaying the grating.
Using a low spatial frequency (0.1 cycles per degree (cpd)), mice were trained to swim towards the monitor displaying the grating and hidden platform after a molding phase during which mice gradually learned to swim from a release chute at the back of the tank towards the monitors. During the training phase, when a mouse chose incorrectly, it repeated the trial on the same side until it chose correctly and was and then returned to its home cage. For both the training, and the subsequent testing phase, mice swam blocks of 10 interleaved trials in groups of 5 for a maximum of 4 blocks of trials per day.
During the testing phase, the spatial frequency was increased in small, sequential increments until an animal consistently fell to 70% accuracy. Starting at 0.1 cpd, mice had to succeed at three consecutive trials before proceeding to the next special frequency, which presented one more complete cycle of the sinusoidal grating. Following the first failure, mice were required to achieve 5 correct trials in a row, or 8 correct trials out of 10 at each spatial frequency before proceeding to the next higher frequency. Once a mouse failed to complete 8 correct trials out of 10 at a given spatial frequency, it was briefly retrained at half that spatial frequency to eliminate any potential ‘side bias’. Then, testing resumed at the spatial frequency below the original failure. The threshold for visual acuity was established once a mouse exhibited a consistent pattern of performance. Acuity thresholds were estimated as the spatial frequency average from three or more failures at adjacent spatial frequencies. Throughout the testing phase, any mouse that failed to find the hidden platform on the first try repeated the trial one more time before it was returned to its home cage, whether or not it chose correctly the second time.
Tamoxifen Treatment
Tamoxifen was administered as previously described [17, 48]. In brief, tamoxifen (Sigma T5648) was solubilized in corn oil at 10mg/ml. A group of ngr1(f/f);ER-Cre and ngr1(f/f) mice was treated with tamoxifen for 3 consecutive days (100mg/kg i.p.) at P42. NgR1 protein is not detectable in ngr1(f/f);ER-Cre mice 7-14 after tamoxifen administration [17]. Upon completion of all experiments, immunoblots from brain tissue in primary visual cortex were performed to confirm that NgR1 protein expression was successfully abolished selectively in ngr1(f/f);ER-Cre mice, but not control ngr1(f/f) mice.
Immunoblotting
Cortical punches (2mm diameter, 1mm thickness) were taken from visual cortex in both hemispheres and homogenized in 20 volumes of homogenization buffer (100mM Tris 7.4, 150mM NaCl, 5mM EDTA, 1mM DTT). Proteins were extracted from the homogenate by adding 1% SDS and 1% Triton X-100 followed by a 1 h incubation at 4°C on a nutator. S amples were then prepared for electrophoresis by adding protein loading buffer (20mM Tris pH6.8; 2% SDS; 10% glycerol; 2.5% beta-mercaptoethanol; 0.1% bromophenol blue) and heat at 95°C for 3 minut es before a brief spin to pellet insoluble debris. Proteins were separated by size by loading samples on a 4-12% tris-glycine polyacrylamide gradient gel (Lifetech), and running SDS-PAGE as previously described [17].
Immunoblotting was performed to confirm evidence of recombination of the conditional ngr1(f/f) allele and presence or absence of NgR1 in ngr1(f/f);ER-Cre and ngr1(f/f) animals treated with tamoxifen. Blots were washed (3 × 10 min) in PBS-T and incubated in blocking solution (3% BSA, 0.05% sodium azide, 0.1% Triton X) for one hour before a second series of washes (3 × 10min TBST). First, blots were incubated in rabbit anti-GFP antibody (GeneTex, GTX26556) at 0.5 mg/ml for 1 h at room temperature. After repeated washing in PBS-T (3 × 10 min), blots were incubated in HRP-conjugated secondary antibody (Jackson Immuno Research, 1:2000 in blocking solution) for 1 h at room temperature. After a final series of washes, immunoreaction was visualized with ECL (Pierce) and autoradiography film (Denville Scientific). Then, blots were incubated overnight at 4°C in blocking solution before being re-probed for NgR1 with goat anti-NgR1 antibody (R&D systems, AF1440) at 5 μg/ml and HRP-conjugated secondary antibody 1:2000 in blocking solution.
Quantification and Statistical Analysis
All statistical analyses were performed using Prism software (version 6.0, GraphPad). Groups numbers are stated in the Figure Legends. N represents number of mice for group comparisons and units for cumulative distributions, except for Figures 2 and 3 where n corresponds to number of cells. Unless otherwise stated, group comparisons were made using unpaired non-parametric tests (Mann-Whitney test). Where multiple groups are compared, we applied the Kruskal-Wallis test with Dunn’s multiple comparisons test. Error bars represent ± sem.
Data and Software Availability
No new software was generated in this study. MATLAB scripts for visual stimulus presentation and LSPS are published [10, 61, 63].
KEY RESOURCES TABLE
| REAGENT or RESOURCE | SOURCE | IDENTIFIER |
|---|---|---|
| Antibodies | ||
| Rabbit polyclonal anti-GFP | Novus | Cat#NB600-308; RRID: AB_10003058 |
| Rabbit polyclonal anti-GFP | Molecular Probes | Cat#: A-21311; RRID:AB_221477 |
| Rabbit polyclonal anti-GFP | GeneTex | Cat#GTX26556 RRID:AB_371421 |
| Goat polyclonal anti-NgR1 | R&D Systems | Cat#AF-1440; RRID:AB_218373 |
| Experimental Models: Organisms/Strains | ||
| Mouse: C57Bl6J - rtn4r KO | [56] | N/A |
| Mouse: C57Bl6J - rtn4r flx | [17] | N/A |
| Mouse: C57Bl6J | The Jackson Laboratory | JAX: 00664 |
| Mouse: B6.129P2-Pvalbtm1(cre)Arbr/J | The Jackson Laboratory | JAX: 017320 |
| Mouse: B6.Cg-Gt(ROSA)26Sortm14(CAG-tdTomato)Hze/J | The Jackson Laboratory | JAX: 007914 |
| Mouse: B6.Cg-Tg(Camk2a-cre)T29-1Stl/J | The Jackson Laboratory | JAX: 005359 |
| Mouse: B6;C3-Tg(Scnn1a-cre)3Aibs/J | The Jackson Laboratory | JAX: 009613 |
| Mouse: B6.Cg-Tg(CAG-cre/Esr1*)5Amc/J | The Jackson Laboratory | JAX: 004682 |
| Mouse: Olig3tm1(cre)Ynka | [27] | N/A |
| Oligonucleotides | ||
| Ngr1 WT F: cag tac ctg cga ctc aat gac |
[56] | N/A |
| NgR1 WT R: ctt ccg gga aca acc tgg cct cc |
[56] | N/A |
| Neo F: ta ttc ggc tat gac tgg gca |
[56] | N/A |
| Neo R: gaa ctc gtc aag aag gcg ata |
[56] | N/A |
| CRE F: ccg gtc gat gca acg agt gat gag gtt cgc |
This paper | N/A |
| CRE R: ctc gac cag ttt agt tac ccc cag gct aag |
This paper | N/A |
| NgR1 flx R: gcg gat ctt gaa gtt cac ctt |
This paper | N/A |
| NgR1 flx/WT F: gag ctg aca tcc atg agc tca gcc |
This paper | N/A |
| NgR1 WT R: ggg aga cag acc cat tcc tgg tcc ctc aca acc |
This paper | N/A |
| NgR1 delta F: tgg tga cca att ggg cta gcc ctg tgg |
This paper | N/A |
| Software and Algorithms | ||
| Spike2 Software | CED | RRID:SCR_000903 |
| MATLAB | Mathworks | RRID:SCR_001622 |
| MATLAB visual stimulus scripts | [10] | N/A |
| MATLAB LSPS scripts | [61] | N/A |
Supplementary Material
Acknowledgments
This research is supported by the National Eye Institute (R01EY021580 and R01EY027407), a Research Development Career Award from Children’s Hospital Los Angeles, and the Disney Award for Amblyopia Research from Research to Prevent Blindness. CES is the recipient of a predoctoral fellowship from the Saban Research Institute. AWM is the recipient of a Career Award in the Biomedical Sciences (CABS) from the Burroughs Wellcome Fund.
Footnotes
Publisher's Disclaimer: This is a PDF file of an unedited manuscript that has been accepted for publication. As a service to our customers we are providing this early version of the manuscript. The manuscript will undergo copyediting, typesetting, and review of the resulting proof before it is published in its final citable form. Please note that during the production process errors may be discovered which could affect the content, and all legal disclaimers that apply to the journal pertain.
Author Contributions
The contributions are as follows: CES, SQ, and AWM designed the study. CES, XM, HMD, JW, and SQ performed the experiments. CES, SQ, and AWM wrote the manuscript.
Declaration of Interest
The authors declare no competing interest
References
- 1.Webber AL, Wood J. Amblyopia: prevalence, natural history, functional effects and treatment. Clin Exp Optometry. 2005;88:365–375. doi: 10.1111/j.1444-0938.2005.tb05102.x. [DOI] [PubMed] [Google Scholar]
- 2.Sengpiel F. Plasticity of the visual cortex and treatment of amblyopia. Curr Biol. 2014;24:R936–R940. doi: 10.1016/j.cub.2014.05.063. [DOI] [PubMed] [Google Scholar]
- 3.Gordon JA, Stryker MP. Experience-dependent plasticity of binocular responses in the primary visual cortex of the mouse. J Neurosci. 1996;16:3274–3286. doi: 10.1523/JNEUROSCI.16-10-03274.1996. [DOI] [PMC free article] [PubMed] [Google Scholar]
- 4.Kratz KE, Mangel SC, Lehmkuhle S, Sherman M. Retinal X- and Y-cells in monocularly lid-sutured cats: normality of spatial and temporal properties. Brain Res. 1979;172:545–551. doi: 10.1016/0006-8993(79)90586-9. [DOI] [PubMed] [Google Scholar]
- 5.Kiorpes L. Visual processing in amblyopia: animal studies. Strabismus. 2006;14:3–10. doi: 10.1080/09273970500536193. [DOI] [PubMed] [Google Scholar]
- 6.Dräger UC. Observations on monocular deprivation in mice. J Neurophysiol. 1978;41:28–42. doi: 10.1152/jn.1978.41.1.28. [DOI] [PubMed] [Google Scholar]
- 7.Fischer QS, Aleem S, Zhou H, Pham TA. Adult visual experience promotes recovery of primary visual cortex from long-term monocular deprivation. Learn Mem. 2007;14:573–580. doi: 10.1101/lm.676707. [DOI] [PMC free article] [PubMed] [Google Scholar]
- 8.Antonini A, Fagiolini M, Stryker MP. Anatomical correlates of functional plasticity in mouse visual cortex. J Neurosci. 1999;19:4388–4406. doi: 10.1523/JNEUROSCI.19-11-04388.1999. [DOI] [PMC free article] [PubMed] [Google Scholar]
- 9.Prusky GT, Douglas RM. Developmental plasticity of mouse visual acuity. Eur J Neurosci. 2003;17:167–173. doi: 10.1046/j.1460-9568.2003.02420.x. [DOI] [PubMed] [Google Scholar]
- 10.Stephany C-É, Chan LLH, Parivash SN, Dorton HM, Piechowicz M, Qiu S, McGee AW. Plasticity of binocularity and visual acuity are differentially limited by nogo receptor. J Neurosci. 2014;34:11631–11640. doi: 10.1523/JNEUROSCI.0545-14.2014. [DOI] [PMC free article] [PubMed] [Google Scholar]
- 11.Wang X, Chun SJ, Treloar H, Vartanian T, Greer CA, Strittmatter SM. Localization of Nogo-A and Nogo-66 receptor proteins at sites of axon-myelin and synaptic contact. J Neurosci. 2002;22:5505–5515. doi: 10.1523/JNEUROSCI.22-13-05505.2002. [DOI] [PMC free article] [PubMed] [Google Scholar]
- 12.Wills ZP, Mandel-Brehm C, Mardinly AR, McCord AE, Giger RJ, Greenberg ME. The Nogo Receptor Family Restricts Synapse Number in the Developing Hippocampus. Neuron. 2012;73:466–481. doi: 10.1016/j.neuron.2011.11.029. [DOI] [PMC free article] [PubMed] [Google Scholar]
- 13.Barrette B, Vallières N, Dubé M, Lacroix S. Expression profile of receptors for myelin-associated inhibitors of axonal regeneration in the intact and injured mouse central nervous system. Mol Cell Neurosci. 2007;34:519–538. doi: 10.1016/j.mcn.2006.12.004. [DOI] [PubMed] [Google Scholar]
- 14.Dickendesher TL, Baldwin KT, Mironova YA, Koriyama Y, Raiker SJ, Askew KL, Wood A, Geoffroy CG, Zheng B, Liepmann CD, et al. NgR1 and NgR3 are receptors for chondroitin sulfate proteoglycans. Nat Neurosci. 2012;15:703–712. doi: 10.1038/nn.3070. [DOI] [PMC free article] [PubMed] [Google Scholar]
- 15.Baldwin KT, Giger RJ. Insights into the physiological role of CNS regeneration inhibitors. Front Mol Neurosci. 2015;8:859–8. doi: 10.3389/fnmol.2015.00023. [DOI] [PMC free article] [PubMed] [Google Scholar]
- 16.Stephany C-É, Frantz MG, McGee AW. Multiple Roles for Nogo Receptor 1 in Visual System Plasticity. Neuroscientist. 2016;22:653–666. doi: 10.1177/1073858415614564. [DOI] [PMC free article] [PubMed] [Google Scholar]
- 17.Wang X, Duffy P, McGee AW, Hasan O, Gould G, Tu N, Harel NY, Huang Y, Carson RE, Weinzimmer D, et al. Recovery from chronic spinal cord contusion after nogo receptor intervention. Ann Neurol. 2011;70:805–821. doi: 10.1002/ana.22527. [DOI] [PMC free article] [PubMed] [Google Scholar]
- 18.Stephany C-É, Ikrar T, Nguyen C, Xu X, McGee AW. Nogo Receptor 1 Confines a Disinhibitory Microcircuit to the Critical Period in Visual Cortex. J Neurosci. 2016;36:11006–11012. doi: 10.1523/JNEUROSCI.0935-16.2016. [DOI] [PMC free article] [PubMed] [Google Scholar]
- 19.Frantz MG, Kast RJ, Dorton HM, Chapman KS, McGee AW. Nogo Receptor 1 Limits Ocular Dominance Plasticity but not Turnover of Axonal Boutons in a Model of Amblyopia. Cereb Cortex. 2016;26:1975–1985. doi: 10.1093/cercor/bhv014. [DOI] [PMC free article] [PubMed] [Google Scholar]
- 20.Kuhlman SJ, Olivas ND, Tring E, Ikrar T, Xu X, Trachtenberg JT. A disinhibitory microcircuit initiates critical-period plasticity in the visual cortex. Nature. 2013;501:543–546. doi: 10.1038/nature12485. [DOI] [PMC free article] [PubMed] [Google Scholar]
- 21.Taha S, Stryker MP. Rapid ocular dominance plasticity requires cortical but not geniculate protein synthesis. Neuron. 2002;34:425–436. doi: 10.1016/s0896-6273(02)00673-6. [DOI] [PubMed] [Google Scholar]
- 22.Howarth M, Walmsley L, Brown TM. Binocular Integration in the Mouse Lateral Geniculate Nuclei. Curr Biol. 2014;24:1241–1247. doi: 10.1016/j.cub.2014.04.014. [DOI] [PMC free article] [PubMed] [Google Scholar]
- 23.Sommeijer JP, Ahmadlou M, Saiepour MH, Seignette K, Min R, Heimel JA, Levelt CN. Thalamic inhibition regulates critical-period plasticity in visual cortex and thalamus. Nat Neurosci. 2017;26:1003–12. doi: 10.1038/s41593-017-0002-3. [DOI] [PubMed] [Google Scholar]
- 24.Jaepel J, Hübener M, Bonhoeffer T, Rose T. Lateral geniculate neurons projecting to primary visual cortex show ocular dominance plasticity in adult mice. Nat Neurosci. 2017;20:1–11. doi: 10.1038/s41593-017-0021-0. [DOI] [PubMed] [Google Scholar]
- 25.Tsien JZ, Chen DF, Gerber D, Tom C, Mercer EH, Anderson DJ, Mayford M, Kandel ER, Tonegawa S. Subregion- and cell type-restricted gene knockout in mouse brain. Cell. 1996;87:1317–1326. doi: 10.1016/s0092-8674(00)81826-7. [DOI] [PubMed] [Google Scholar]
- 26.Madisen L, Zwingman TA, Sunkin SM, Oh SW, Zariwala HA, Gu H, Ng LL, Palmiter RD, Hawrylycz MJ, Jones AR, et al. A robust and high-throughput Cre reporting and characterization system for the whole mouse brain. Nat Neurosci. 2009;13:133–140. doi: 10.1038/nn.2467. [DOI] [PMC free article] [PubMed] [Google Scholar]
- 27.Vue TY, Lee M, Tan YE, Werkhoven Z, Wang L, Nakagawa Y. Thalamic Control of Neocortical Area Formation in Mice. J Neurosci. 2013;33:8442–8453. doi: 10.1523/JNEUROSCI.5786-12.2013. [DOI] [PMC free article] [PubMed] [Google Scholar]
- 28.Prusky GT, West PW, Douglas RM. Behavioral assessment of visual acuity in mice and rats. Vision Res. 2000;40:2201–2209. doi: 10.1016/s0042-6989(00)00081-x. [DOI] [PubMed] [Google Scholar]
- 29.Hayashi S, McMahon AP. Efficient Recombination in Diverse Tissues by a Tamoxifen-Inducible Form of Cre: A Tool for Temporally Regulated Gene Activation/Inactivation in the Mouse. Dev Biol. 2002;244:305–318. doi: 10.1006/dbio.2002.0597. [DOI] [PubMed] [Google Scholar]
- 30.Müller CM, Best J. Ocular Dominance Plasticity in Adult Cat Visual-Cortex After Transplantation of Cultured Astrocytes. Nature. 1989;342:427–430. doi: 10.1038/342427a0. [DOI] [PubMed] [Google Scholar]
- 31.Wiesel TN, Hubel DH. Extent of Recovery from the effects of visual deprivation in kittens. J Neurophysiol. 1965;28:1060–1072. doi: 10.1152/jn.1965.28.6.1060. [DOI] [PubMed] [Google Scholar]
- 32.Giffin F, Mitchell DE. The rate of recovery of vision after early monocular deprivation in kittens. J Physiol. 1978;274:511–537. doi: 10.1113/jphysiol.1978.sp012164. [DOI] [PMC free article] [PubMed] [Google Scholar]
- 33.Levelt CN, Hübener M. Critical-Period Plasticity in the Visual Cortex. Annu Rev Neurosci. 2012;35:309–330. doi: 10.1146/annurev-neuro-061010-113813. [DOI] [PubMed] [Google Scholar]
- 34.He HY. Visual Deprivation Reactivates Rapid Ocular Dominance Plasticity in Adult Visual Cortex. J Neurosci. 2006;26:2951–2955. doi: 10.1523/JNEUROSCI.5554-05.2006. [DOI] [PMC free article] [PubMed] [Google Scholar]
- 35.He HY, Ray B, Dennis K, Quinlan EM. Experience-dependent recovery of vision following chronic deprivation amblyopia. Nat Neurosci. 2007;10:1134–1136. doi: 10.1038/nn1965. [DOI] [PubMed] [Google Scholar]
- 36.Sale A, Maya Vetencourt JF, Medini P, Cenni MC, Baroncelli L, De Pasquale R, Maffei L. Environmental enrichment in adulthood promotes amblyopia recovery through a reduction of intracortical inhibition. Nat Neurosci. 2007;10:679–681. doi: 10.1038/nn1899. [DOI] [PubMed] [Google Scholar]
- 37.Vetencourt JFM, Sale A, Viegi A, Baroncelli L, De Pasquale R, O’Leary OF, Castren E, Maffei L. The Antidepressant Fluoxetine Restores Plasticity in the Adult Visual Cortex. Science. 2008;320:385–388. doi: 10.1126/science.1150516. [DOI] [PubMed] [Google Scholar]
- 38.Morishita H, Miwa JM, Heintz N, Hensch TK. Lynx1, a Cholinergic Brake, Limits Plasticity in Adult Visual Cortex. Science. 2010;330:1238–1240. doi: 10.1126/science.1195320. [DOI] [PMC free article] [PubMed] [Google Scholar]
- 39.Bochner DN, Sapp RW, Adelson JD, Zhang S, Lee H, Djurisic M, Syken J, Dan Y, Shatz CJ. Blocking PirB up-regulates spines and functional synapses to unlock visual cortical plasticity and facilitate recovery from amblyopia. Sci Transl Med. 2014;6:258ra140–258ra140. doi: 10.1126/scitranslmed.3010157. [DOI] [PMC free article] [PubMed] [Google Scholar]
- 40.Taha S, Hanover JL, Silva AJ, Stryker MP. Autophosphorylation of alphaCaMKII is required for ocular dominance plasticity. Neuron. 2002;36:483–491. doi: 10.1016/s0896-6273(02)00966-2. [DOI] [PubMed] [Google Scholar]
- 41.Pizzorusso T, Medini P, Berardi N, Chierzi S, Fawcett JW, Maffei L. Reactivation of ocular dominance plasticity in the adult visual cortex. Science. 2002;298:1248–1251. doi: 10.1126/science.1072699. [DOI] [PubMed] [Google Scholar]
- 42.Salinas KJ, Figueroa Velez DX, Zeitoun JH, Kim H, Gandhi SP. Contralateral Bias of High Spatial Frequency Tuning and Cardinal Direction Selectivity in Mouse Visual Cortex. J Neurosci. 2017;37:10125–10138. doi: 10.1523/JNEUROSCI.1484-17.2017. [DOI] [PMC free article] [PubMed] [Google Scholar]
- 43.Heimel JA, Saiepour MH, Chakravarthy S, Hermans JM, Levelt CN. Contrast gain control and cortical TrkB signaling shape visual acuity. Nat Neurosci. 2010;13:642–648. doi: 10.1038/nn.2534. [DOI] [PubMed] [Google Scholar]
- 44.Glickfeld LL, Histed MH, Maunsell JHR. Mouse Primary Visual Cortex Is Used to Detect Both Orientation and Contrast Changes. J Neurosci. 2013;33:19416–19422. doi: 10.1523/JNEUROSCI.3560-13.2013. [DOI] [PMC free article] [PubMed] [Google Scholar]
- 45.Morishita H, Hensch TK. Critical period revisited: impact on vision. Curr Opin Neurobio. 2008;18:101–107. doi: 10.1016/j.conb.2008.05.009. [DOI] [PubMed] [Google Scholar]
- 46.Pizzorusso T, Medini P, Landi S, Baldini S, Berardi N, Maffei L. Structural and functional recovery from early monocular deprivation in adult rats. Proc Natl Acad Sci USA. 2006;103:8517–8522. doi: 10.1073/pnas.0602657103. [DOI] [PMC free article] [PubMed] [Google Scholar]
- 47.Huang ZJ, Kirkwood A, Pizzorusso T, Porciatti V, Morales B, Bear MF, Maffei L, Tonegawa S. BDNF regulates the maturation of inhibition and the critical period of plasticity in mouse visual cortex. Cell. 1999;98:739–755. doi: 10.1016/s0092-8674(00)81509-3. [DOI] [PubMed] [Google Scholar]
- 48.Akbik FV, Bhagat SM, Patel PR, Cafferty WBJ, Strittmatter SM. Anatomical Plasticity of Adult Brain Is Titrated by Nogo Receptor 1. Neuron. 2013;77:859–866. doi: 10.1016/j.neuron.2012.12.027. [DOI] [PMC free article] [PubMed] [Google Scholar]
- 49.Park JI, Frantz MG, Kast RJ, Chapman KS, Dorton HM, Stephany C-É, Arnett MT, Herman DH, McGee AW. Nogo Receptor 1 Limits Tactile Task Performance Independent of Basal Anatomical Plasticity. PLoS ONE. 2014;9:e112678–13. doi: 10.1371/journal.pone.0112678. [DOI] [PMC free article] [PubMed] [Google Scholar]
- 50.LeVay S, Wiesel TN, Hubel DH. The development of ocular dominance columns in normal and visually deprived monkeys. J Comp Neurol. 1980;191:1–51. doi: 10.1002/cne.901910102. [DOI] [PubMed] [Google Scholar]
- 51.Olson CR, Freeman RD. Monocular deprivation and recovery during sensitive period in kittens. J Neurophysiol. 1978;41:65–74. doi: 10.1152/jn.1978.41.1.65. [DOI] [PubMed] [Google Scholar]
- 52.Duffy KR, Mitchell DE. Darkness Alters Maturation of Visual Cortex and Promotes Fast Recovery from Monocular Deprivation. Curr Biol. 2013;23:382–386. doi: 10.1016/j.cub.2013.01.017. [DOI] [PubMed] [Google Scholar]
- 53.Maffei L, Fiorentini A. Monocular deprivation in kittens impairs the spatial resolution of geniculate neurones. Nature. 1976;264:754–755. doi: 10.1038/264754a0. [DOI] [PubMed] [Google Scholar]
- 54.Derrington AM, Hawken MJ. Spatial and temporal properties of cat geniculate neurones after prolonged deprivation. J Physiol. 1981;314:107–120. doi: 10.1113/jphysiol.1981.sp013694. [DOI] [PMC free article] [PubMed] [Google Scholar]
- 55.Huberman AD, Niell CM. What can mice tell us about how vision works? Trends Neurosci. 2011;34:464–473. doi: 10.1016/j.tins.2011.07.002. [DOI] [PMC free article] [PubMed] [Google Scholar]
- 56.Kim JE, Liu BP, Park JH, Strittmatter SM. Nogo-66 Receptor Prevents Raphespinal and Rubrospinal Axon Regeneration and Limits Functional Recovery from Spinal Cord Injury. Neuron. 2004;44:439–451. doi: 10.1016/j.neuron.2004.10.015. [DOI] [PubMed] [Google Scholar]
- 57.McGee AW, Yang Y, Fischer QS, Daw NW, Strittmatter SM. Experience-driven plasticity of visual cortex limited by myelin and Nogo receptor. Science. 2005;309:2222–2226. doi: 10.1126/science.1114362. [DOI] [PMC free article] [PubMed] [Google Scholar]
- 58.Piscopo DM, El-Danaf RN, Huberman AD, Niell CM. Diverse Visual Features Encoded in Mouse Lateral Geniculate Nucleus. J Neurosci. 2013;33:4642–4656. doi: 10.1523/JNEUROSCI.5187-12.2013. [DOI] [PMC free article] [PubMed] [Google Scholar]
- 59.Wiesel TN, Hubel DH. Single-cell responses in striate cortex of kittens deprived of vision in one eye. Journal of Neurophysiology. 1963;26:1003–1017. doi: 10.1152/jn.1963.26.6.1003. [DOI] [PubMed] [Google Scholar]
- 60.Hirano AA, Brandstätter JH, Brecha NC. Cellular distribution and subcellular localization of molecular components of vesicular transmitter release in horizontal cells of rabbit retina. J Comp Neurol. 2005;488:70–81. doi: 10.1002/cne.20577. [DOI] [PMC free article] [PubMed] [Google Scholar]
- 61.Qiu S, Anderson CT, Levitt P, Shepherd GMG. Circuit-Specific Intracortical Hyperconnectivity in Mice with Deletion of the Autism-Associated Met Receptor Tyrosine Kinase. J Neurosci. 2011;31:5855–5864. doi: 10.1523/JNEUROSCI.6569-10.2011. [DOI] [PMC free article] [PubMed] [Google Scholar]
- 62.Xu X, Callaway EM. Laminar Specificity of Functional Input to Distinct Types of Inhibitory Cortical Neurons. J Neurosci. 2009;29:70–85. doi: 10.1523/JNEUROSCI.4104-08.2009. [DOI] [PMC free article] [PubMed] [Google Scholar]
- 63.Shepherd GMG. Laminar and Columnar Organization of Ascending Excitatory Projections to Layer 2/3 Pyramidal Neurons in Rat Barrel Cortex. J Neurosci. 2005;25:5670–5679. doi: 10.1523/JNEUROSCI.1173-05.2005. [DOI] [PMC free article] [PubMed] [Google Scholar]
- 64.Weiler N, Wood L, Yu J, Solla SA, Shepherd GMG. Top-down laminar organization of the excitatory network in motor cortex. Nat Neurosci. 2008;11:360–366. doi: 10.1038/nn2049. [DOI] [PMC free article] [PubMed] [Google Scholar]
Associated Data
This section collects any data citations, data availability statements, or supplementary materials included in this article.