Abstract
Tumor cells respond to IFNγ of activated T cells to up-regulate PD-L1 in the tumor microenvironment as an adaptive immune resistance mechanism. Tumor cells also express oncogene-driven PD-L1. PD-L1 is also expressed on myeloid-derived suppressor cells (MDSCs). It is known that both type I and II interferons up-regulate PD-L1 expression in MDSCs. However, the molecular mechanism underlying PD-L1 expression in MDSCs is still largely unknown. We report here that MDSCs exhibit constitutive STAT1 phosphorylation in vitro without exogenous interferons, indicating a constitutive active JAK-STAT signaling pathway in mouse MDSCs in vitro. Furthermore, IFNα and IFNβ, but not IFNγ, are endogenously expressed in MDSC cell line in vitro and in tumor-induced MDSCs in vivo. Neutralizing type I interferon or inhibiting the JAK-STAT signaling pathway significantly decreased constitutive PD-L1 expression in MDSCs in vitro. However, neither IFNα expression level nor IFNβ expression level is correlated with PD-L1 expression level in MDSCs, instead, the level of IFNAR1 is correlated with PD-L1 expression levels in MDSCs. Consequently, knocking out IFNAR1 in mice diminished PD-L1 expression in tumor-induced MDSCs. Therefore, we determined that: 1) PD-L1 expression in MDSCs is activated by type I interferon through an autocrine manner; and 2) the expression level of PD-L1 is controlled at least in part by the IFNAR1 level on MDSCs. Our data indicate that MDSCs may maintain its PD-L1 expression via autocrine type I interferon to exert its suppressive activity in the absence of IFNγ from the suppressed T cells in the tumor microenvironment.
Keywords: PD-L1, autocrine Type I interferon, IFNAR1, MDSCs
Introduction
Myeloid-derived suppressor cells (MDSCs) are a heterogeneous population of immature myeloid cells that are defined in mice as Gr-1+CD11b+ cells which can be further classified as CD11b+Ly6G+Ly6Clo polymorphonuclear MDSCs (PMN-MDSCs) and CD11b+Ly6G−Ly6Chi M-monocytic MDSCs (M-MDSCs) (1). MDSCs are induced by inflammation conditions and often massively accumulate in the lymphoid organs and tumors (2). It is well-known that MDSCs act as major regulators of immune responses in cancer and under other pathological conditions. In tumor-bearing mice and human cancer patients, MDSCs function as potent immune suppressive cells that inhibit T and NK cell functions to promote tumor progression (3–5). MDSCs are therefore important mediators of tumor immune tolerance and are considered as key targets in cancer immunotherapy (6).
MDSCs exhibit their immune suppressive functions against T cells and NK cells in a nonspecific or antigen-specific way through multiple mechanisms (7, 8). Certain subsets of MDSCs express high levels of arginase I (Arg) and cationic amino acid transporter 2B, which allowed MDSCs to rapidly incorporate and hydrolyze L-arginine, and therefore depleting extracellular L-arginine. L-arginine depletion induces loss of CD3-ζ chain in T cells, T cell cycle arrest, decreases cytokine production, resulting in T cell apoptosis and depletion (8, 9). MDSCs, also express high level of inducible form of nitric oxide synthase (iNOS) which produces reactive nitrogen oxide species such as peroxynitrite. Peroxynitrite can nitrotyrosylate key T cell receptor (TCR) signaling proteins to inhibit activation-induced protein tyrosine phosphorylation and prime T cells to undergo apoptosis (10). More recently, it has been shown that PMN-MDSCs-produced peroxynitrite nitrates TCR and CD8 molecules, which leads to conformational changes in the TCR-CD3 complex to diminish the physical interactions between CD8 and TCR, therein disrupting T cell signaling and rendering them unresponsive to antigen-specific stimulation (11). In addition, it has also been shown that M-MDSCs express high level of iNOS to mediate nitration of STAT1 to block IFNγ signaling pathway, a key component of the host T cell cancer immune surveillance system (12). Therefore, MDSCs exert their immune suppressive functions through the synergistic ARG and iNOS functions to suppress T cell function. Unlike in T cells, MDSCs suppress NK cell function through an arginase-independent mechanism. MDSCs inhibit autologous NK cell cytotoxicity and cytokine secretion depends mainly on the NKp30 receptor on NK cells in a cell contact-dependent manner (5).
Programmed death-ligand 1 (PD-L1, also known as CD274 or B7-H1) is the physiological ligand of co-inhibitory receptor programmed death-1 (PD-1) that is expressed on activated T cells. PD-L1 binding to PD-1 activates phosphatase SHP2 that dephosphorylates TCR-associated T cell activation mediators and co-stimulatory receptor CD28 to inhibit T cell activation to control autoimmunity under physiological conditions (13). Tumor cells hijack this immune checkpoint inhibitor mechanism to express PD-L1 to suppress the tumor-reactive T cells to evade cancer immune surveillance. Tumor cells not only express PD-L1 on their own surface but also induce PD-L1 expression on MDSCs (14). Although it is clearly tumor type-dependent (15), PD-L1 is also expressed on MDSCs and its expression level is significantly elevated with tumor progression in both human cancer patients and tumor-bearing mice (16–20). Emerging evidence suggests that, in addition to ARG, iNOS and other factors, PD-L1 also contributes to the immune suppressive activity of MDSCs in the hypoxia tumor microenvironment (14, 21). Therefore, MDSCs might use expression of PD-L1 as another mechanism to suppress T cell function in the tumor microenvironment.
The expression regulation of PD-L1 in tumor cells has been extensively studied. It has been well-established that PD-L1 is constitutively expressed in tumor cells by oncogenic factors such as AKT, STAT3 and EGFR (22–24). Besides the constitutive activation of PD-L1 expression by tumor cell intrinsic signals, PD-L1 expression can also be induced by extrinsic signals, primarily by activated T cell-produced IFNγ in the tumor microenvironment (25–27). PD-L1 is expressed on MDSCs (16–18), but the underlying mechanism of PD-L1 in MDSCs is largely unknown. We made use of complementary in vitro and in vivo MDSC models and aimed at elucidating the molecular mechanisms underlying PD-L1 expression regulation in MDSCs.
Materials and Methods
Cell lines and reagents
The murine colon carcinoma cell lines CT26 and MC38 were obtained from American Type Culture Collection (ATCC, Manassas, VA). The mammary carcinoma cell line AT3 was provided by Dr. Scott Abrams (28) Murine myeloid cell line J774M was generated as previously described (29). All cells are routinely tested for mycoplasma and all cells used in this study are mycoplasma-free. Ruxolitinib was obtained from LC Laboratories (Woburn, MA). Recombinant IFNα, IFNβ, GM-CSF, Biotin-anti-CD3 (17A2), Biotin-anti-CD11b (M1/70), and anti-IFNAR1 neutralizing mAb were obtained from Biolegend (San Diego, CA). Neutralizing anti-PD-L1 mAb (10F.9G2), Anti-CD3 (145–2C11) and anti-CD28 (37.51) coating mAbs were obtained from Bio X Cell (West Lebanon, NH).
Mice
Six to eight weeks old female BALB/c, C57BL/6, and IFNAR1-KO mice were obtained from The Jackson Laboratory (Bar Harbor, ME). Mice were inoculated subcutaneously in the right unilateral flank with 2.5×10⁵ tumor cells suspended in Hanks’s Buffered Saline Solution (HBSS). Tumor tissues were collected from tumor-bearing mice and digested with collagenase solution (1 mg/ml collagenase, 0.1 mg/ml hyaluronidase, and 30 U/ml DNase I). Cell digests were filtered through a 100 μM cell strainer and analyzed by flow cytometry. All animal studies were performed in compliance with protocols approved by the Augusta University Institutional Animal Care and Use Committee.
Induction of BM-derived MDSCs
About 80% confluent tumor cells were seeded in culture plates and cultured for 24 hours. Cell culture medium was collected and cleared by centrifugation. Bone marrow cells (5 × 10⁵ cells/ml) were cultured with RPMI 1640 medium containing 10% (v/v) fetal calf serum, and supplemented with either 20 ng/ml recombinant mouse GM-CSF or 50% (v/v) of tumor cell-conditioned medium for 4 days.
Flow Cytometry
Cells were incubated with fluorescence-conjugated antibodies diluted in FACS buffer (2% BSA in PBS buffer) on ice for 15 min. After washing, cells were acquired using BD LSR II or BD Accri™ C6 Flow Cytometers (BD Biosciences). Monoclonal antibodies used for cell surface staining were:FITC-anti-CD11b (M1/70), PE-anti-Gr1 (RB6-8C5), APC-anti-PDL1 (10F.9G2), APC-anti-IFNAR1(MAR1-5A3), PE-anti-Ly6G (1A8), PerCP-Cy5.5-anti-Ly6C (HK1.4), PE-anti-CD4 (RM4-5), APC-anti-CD8 (53-6.7), and APC-rat IgG2a, κ (RTK2758) and APC-Mouse IgG1, κ (MOPC-21) isotype controls (BioLegend, San Diego, CA). Data were analyzed using FlowJo V10 software. Dead cells were excluded by 7AAD or DAPI staining. Graphing and statistical analysis were performed using GraphPad Prism 6.
Cell sorting
Murine splenocytes and BM-derived MDSCs were stained with CD11b- and Gr1-specific mAbs (BioLegend). Stained cells were sorted using a BD FACSAria II SORP or a Beckman Coulter MoFlo XDP cell sorter to isolate myeloid cell subsets.
Immunosuppression assay
Naive CD3+ T cells were isolated from the spleens of BALB/c or C57BL/6 mice with MojoSort™ mouse CD3 T Cell Isolation Kit (BioLegend), and >95% purity was confirmed by flow cytometry. Mixture of CFSE-labeled CD3+ T cells and different amounts of MDSCs were seeded into 96-well flat-bottom plates pre-coated with anti-CD3 mAb (8 μg/ml, clone 145-2C11) with or without anti-CD28 mAb (10 μg/ml, clone 37.51) and cultured for 3 days under normoxia or hypoxia (1% pO2 with 5% CO2, Laboratory Products INC., MI). In some case, naïve CD3+ T cells and MDSCs were pre-bond with anti-CD3-Biotin (50 μg/ml, 17A2, BioLegend) and anti-CD11b-Biotin (50 μg/ml, M1/70, BioLegend) antibodies, respectively. After wash, mixed cells and added MojoSort™ Strptavidin Nanobeads (10 μL for 1 × 10⁷ cells, BioLegend) to promote the cell-cell contact, and cultured as above. Proliferation of CD4+ or CD8+ T cells were analyzed by measuring CFSE intensity by flow cytometry.
Western Blotting analysis
Total cell lysates were prepared in lysis buffer (20 mM Hepes, pH 7.4, 20 mM NaCl, 10% Glycerol, and 1% Triton X-100) and protease and phosphatase inhibitor cocktails (CalBiochem). Blots were probed with antibodies that are specific for p-STAT1 (Y701, BD Biosciences), STAT1 (BD Biosciences), STAT2 (Santa Cruz), STAT3 (BD Biosciences), STAT4 (Santa Cruz), STAT5 (BD Biosciences), STAT6 (BD Biosciences), GAPDH (Santa Cruz), and β-actin (sigma).
IFNβ protein measurement
Cell culture medium was collected and analyzed for IFNβ protein levels using multiplex mouse inflammation panel (LEGENDplex, Biolegend) as per manufacturer’s instructions. Data were collected on FACS Calibur two laser flow cytometer (Beckton Dickinson) and analyzed using LEGENDplex Data Analysis Software (Biolegend).
RNA extraction and regular or quantitative RT-PCR
Cells were lysed in TRIzol (Life Technologies) to isolate total RNA. cDNA was generated using the SuperScript III first-strand synthesis system (Invitrogen). Real-time PCR was performed with the PowerUp SYBR™ Green Master Mix (Applied Biosystems) in the StepOne Plus Real-time PCR System (Applied Biosystems) using standard conditions and the following primer pairs: IFN-α forward: 5′-CTGAAGGACAGGAAGGACTTTGG-3′, reverse: 5′-CTGCTGGTGGAGGTCATTGC-3′; IFNβ forward: 5′-CTGCGTTCCTGCTGTGCTTC-3′, reverse: 5′-TCTTCTCCGTCATCTCCATAGGG-3′; IFNγ forward: 5′-CCATCAGCAACAACATAAGCGTC-3′, reverse: 5′-TCTCTTCCCCACCCCGAATCAGCAG-3′; and RPL13a forward: 5′-AAGTTTGCTTACCTGGGGCGTCTG-3′, reverse: 5′-ATCTGCTTCTTCTTCCGATAGTGC-3′. Samples were normalized to RPL13a and the relative expression of IFNs was determined using the comparative cycle threshold (CT) method (i.e., 2−ΔΔCT).
Statistical Analysis
Data are expressed as mean ± SD. Statistical analysis was performed using ANOVA and paired Student’s t-test.
Results
PD-L1 expression patterns in MDSCs in vitro and in vivo
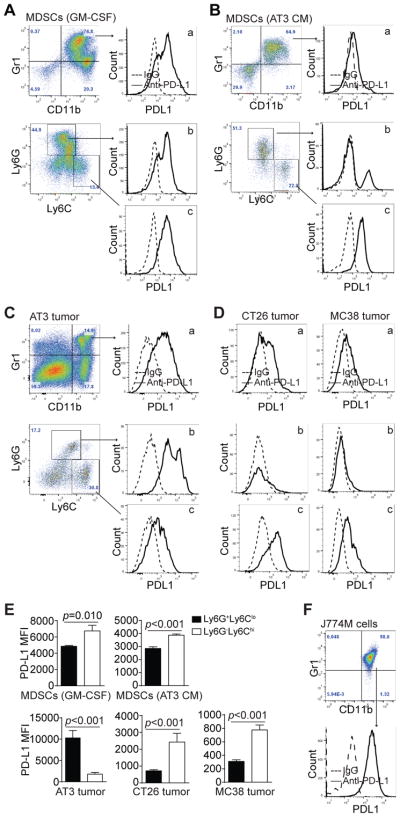
To determine PD-L1 expression patterns in MDSCs, we first analyzed BM-derived MDSCs. PD-L1 is extensively expressed on CD11b+Gr1+ MDSCs (Fig. 1A & B). Further analysis of subsets of MDSCs revealed that PD-L1 expression levels are higher on CD11b+Ly6G−Ly6Chi M-MDSCs than on CD11b+Ly6G+Ly6Clo PMN-MDSCs (Fig. 1A & E). Similar PD-L1 expression patterns were observed in general MDSCs, M-MDSCs and PMN-MDSCs that are induced by the AT3 mammary carcinoma cell-conditioned medium (Fig. 1B & E). To determine whether this PD-L1 expression pattern can be extended to in vivo tumor-infiltrating MDSCs, we made use of mammary and colon carcinoma mouse models. In the AT3 mammary carcinoma tumor-bearing mice, PD-L1 is highly expressed on CD11b+Gr1+ general MDSCs (Fig. 1C). However, in contrast to what was observed on in vitro AT3 tumor cell-conditioned medium-induced MDSCs, PMN-MDSCs expressed significantly higher PD-L1 than M-MDSCs (Fig. 1C & E). Similar to AT3 tumor-bearing mice, MDSCs from colon carcinoma CT26 tumor-bearing mice express PD-L1 (Fig. 1C). However, in contrast to MDSCs of AT3 tumor-bearing mice, PD-L1 expression level on M-MDSCs is significantly higher than that on PMN-MDSCs (Fig. 1E). To further validate this finding, colon carcinoma MC38 tumor-bearing mice were analyzed for PD-L1 expression on MDSCs. PD-L1 is expressed on general MDSCs from MC38 tumor-bearing mice (Fig. 1D). Like in CT26 tumor-bearing mice, M-MDSCs express significantly higher level of PD-L1 than PMN-MDSCs (Fig. 1E). J774M is a CD11b+Gr1+ MDSC-like cell line (29) and are PD-L1+ (Fig. 1F). These observations indicate that MDSCs widely express PD-L1 both in vitro and in vivo, however, PD-L1 expression levels on PMN-MDSCs and M-MDSCs are tumor type-dependent and are different between in vitro BM-derived MDSCs and MDSCs from tumor-bearing mice in vivo.
Figure 1. PD-L1 expression profiles on MDSCs in vitro and in vivo.
A. Bone marrow cells were cultured with GM-CSF for five days. Cells were stained with CD11b-, Gr1-, Ly6G- and Ly6C-specific mAbs. CD11b+Gr1+ cells were gated and plotted for PD-L1 levels (a). CD11b+ cells were further gated based on Ly6G and Ly6C levels. Ly6G+Ly6Clo and Ly6G−Ly6Chi cells were plotted for PD-L1 levels (b & c). Shown are representative results of one of three independent experiments. B. BM cells were cultured with AT3 tumor cell-conditioned medium for five days. PD-L1 levels in CD11b+Gr1+ (a), CD11b+Ly6G+Ly6Clo (b) and CD11b+Ly6G−Ly6Chi (c) cells were analyzed as shown in A. Shown are representative results of one of three independent experiments. C. Tumor tissues were collected from mammary carcinoma AT3 tumor-bearing mice and prepared for single cells. Cells were stained with CD11b-, Gr1-, Ly6G- and Ly6C-specific mAbs. PD-L1 levels in tumor-infiltrating CD11b+Gr1+ (a), CD11b+Ly6G+Ly6Clo (b), and CD11b+Ly6G−Ly6Chi (c) cells were analyzed as in A. Shown are representative results of one of three independent experiments. D. Tumor tissues were collected from colon carcinoma CT26 (left panel) and MC38 (right panel) tumor-bearing mice, and analyzed for PD-L1 levels in tumor-infiltrating CD11b+Gr1+ (a), CD11b+Ly6G+Ly6Clo (b), and CD11b+Ly6G−Ly6Chi (c) cells were as shown in A. Shown are representative results of one of three independent experiments. E. PD-L1 MFIs between CD11b+Ly6G+Ly6Clo and CD11b+Ly6G−Ly6Chi MDSCs from the above five in vitro and in vivo MDSC models were compared. Column: mean; Bar: SD. F. J774M cells were stained with CD11b-, Gr1-, and PD-L1-specific mAbs and the CD11b+Gr1+ cells were analyzed for PD-L1 level.
PD-L1+ MDSCs exhibit greater immune suppressive activity than PD-L1− MDSCs
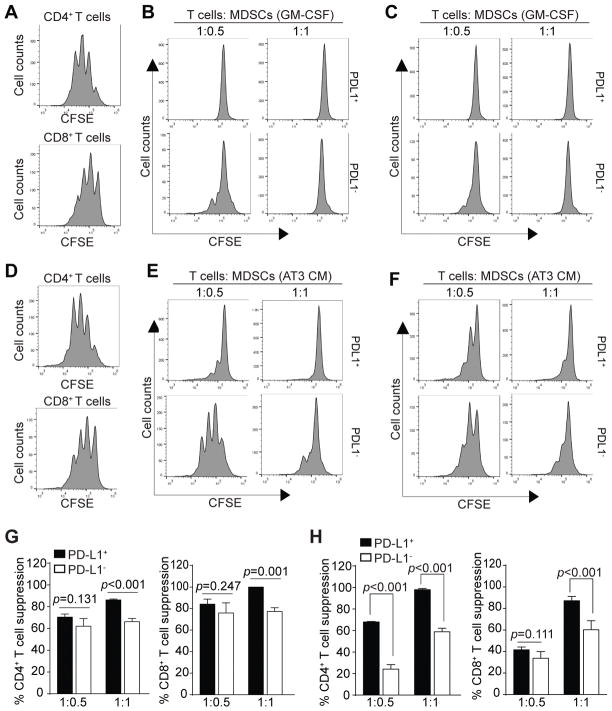
MDSCs suppress T cell activation through multiple mechanisms. It has been shown that blockade of PD-L1 under hypoxia abrogates the suppressive activity of MDSCs against T cell activation (21). We next sought to determine the immune suppressive activity of PD-L1+ and PD-L1− MDSCs. CD11b+Gr1+ BM-derived MDSCs were sorted into PD-L1+ and PD-L1− MDSCs and co-cultured with CFSE-labeled CD3+ T cells in anti-CD3 and anti-CD28-coated plates under hypoxia. Analysis of T cell proliferation revealed that PD-L1+ MDSCs have significantly greater suppressive activity against CD4+ (Fig. 2A & B) and CD8+ (Fig. 2A & C) T cell activation and proliferation (Fig. 2G). Similarly, PD-L1+ MDSCs from AT3 tumor cell-conditioned medium also exhibited significantly higher inhibitory activity to suppress both CD4+ (Fig. 2D & E) and CD8+ (Fig. 2D & F) activation and proliferation (Fig. 2H). Taken together, our data indicate that PD-L1+ MDSCs are more immune suppressive than PD-L1− MDSCs.
Figure 2. Immune suppressive activity of PD-L1+ and PD-L1− MDSCs.
A. CD3+ T cells were purified from spleens of BALB/c mice, labeled with CFSE and cultured in anti-CD3 and anti-CD28 coated plates without MDSCs for 3 days in hypoxia. Cells were stained with CD4- and CD8-specific mAbs and analyzed for CFSE intensity of CD4+ (top panel) and CD8+ (bottom panel) cells, respectively. B & C. BM cells were cultured with GM-CSF for 4 days. CD11b+Gr1+ cells were sorted into PD-L1+ and PD-L1− cells that were then co-cultured with CFSE-labeled CD3+ T cells in anti-CD3 and anti-CD28-coated plates at the indicated T cell and MDSC ratio for 3 days in hypoxia. Cells were then stained with CD4- and CD8-specific mAbs. CD4+ (B) and CD8+ (C) cells were gated and analyzed for CFSE intensity. Shown are representative plots of one of two independent experiments. D. CD3+ T cells were purified from spleens of C57BL/6 mice, labeled with CFSE and cultured in anti-CD3 and anti-CD28 coated plates without MDSCs for 3 days. Cells were stained with CD4- and CD8-specific mAbs and analyzed for CFSE intensity of CD4+ (top panel) and CD8+ (bottom panel) cells, respectively. E & F. BM cells were cultured with AT3 tumor cells-conditioned medium for 4 days. CD11b+Gr1+ cells were sorted into PD-L1+ and PD-L1− cells that were then co-cultured with CFSE-labeled CD3+ T cells in anti-CD3 and anti-CD28-coated plates at the indicated T cell and MDSC ratio for 3 days. Cells were then stained with CD4- and CD8-specific mAbs. CD4+ (D) and CD8+ (E) cells were gated and analyzed for CFSE intensity. Shown are representative plots of one of two independent experiments. G. Quantification of immune suppressive activity of GM-CSF-induced PD-L1+ and PD-L1− MDSCs. % T cell suppression was calculated as the percentage of ratio of CFSE intensity of CD4+ (B) or CD8+ (C) T cells in the presence of MDSCs to the CFSE intensity of CD4+ (A) and CD8+ (A) T cells in the absence of MDSCs, respectively. Column: mean; Bar: SD. H. Quantification of immune suppressive activity of PD-L1+ and PD-L1− MDSCs induced by AT3 tumor cell-conditioned medium. % T cell suppression was calculated as the percentage of ratio of CFSE intensity of CD4+ (E) and CD8+ (F) T cells in the presence of MDSCs to CFSE intensity of CD4+ (D) and CD8+ (D) T cells in the absence of MDSCs, respectively. Column: mean; Bar: SD.
Function of MDSC-expressed PD-L1 in suppression of T cell activation
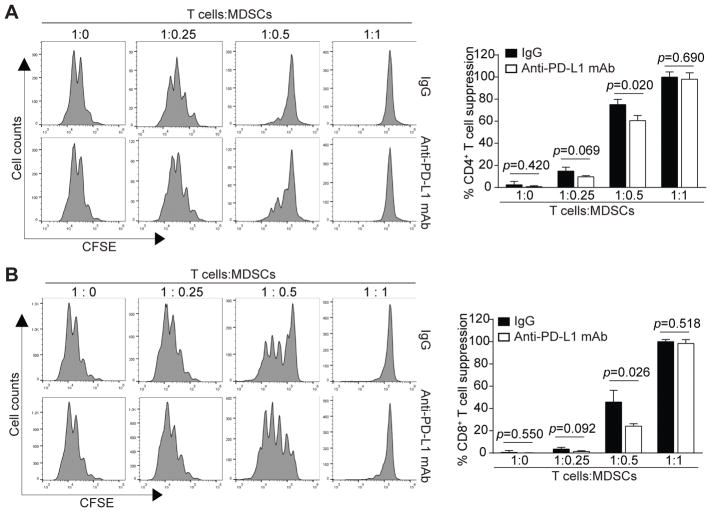
The functions of PD-L1 in MDSC-mediated immune suppression might be cellular context-dependent (15, 21). In addition, MDSCs may also function as antigen-presenting cells (7, 30, 31), we therefore reasoned that MDSCs may need to be in specific contact with T cells to exhibit its suppressive activity through PD-L1. To test this hypothesis, we made use of a biotin-streptavidin-linked cell-cell contact system (32) to bring MDSCs and T cells in direct physical contact that mimics T cell-APC interactions. Anti-PD-L1 neutralization mAb was then added to the MDSC-T cell co-culture mixtures to unmask PD-L1 function. MDSCs exhibited suppressive activity against activation and proliferation of both CD4+ and CD8+ T cells in a dose-dependent manner (Fig. 3A & B). A ratio of T cells : MDSCs at 1:0.5 significantly inhibited both CD4+ and CD8+ T cell activation and proliferation. Blocking PD-L1 function with a PD-L1 neutralization mAb significantly decreased MDSC-mediated suppression of both CD4+ (Fig. 3A) and CD8+ (Fig. 3B) T cell activation and proliferation at this T cells : MDSCs ratio. A MDSCs dose at a 1:1 T cells : MDSCs ratio blocked T cell activation and proliferation. However, PD-L1 neutralization mAb did not reverse MDSC-mediated suppression of T cell activation and proliferation under this strong suppressive condition (Fig. 3A & B). These observations indicate that PD-L1-mediated suppressive activity is one of the mechanisms that MDSCs use to suppress T cell activation and proliferation.
Figure 3. PD-L1 contributes to MDSC suppressive activity against T-cell proliferation.
CD3+ T cells were purified from spleens of BALB/c mice and labeled with CFSE. The labeled CD3+ T cells with incubated with biotin-anti-CD3 mAb (50 μg/ml) and washed once with PBS. BM-derived MDSCs were incubated with Biotin-anti-CD11b mAb (50 μg/ml) and washed once with PBS. The Biotin-anti-CD3- bound CD3+ T cells and Biotin-anti-CD11b-bound MDSCs were mixed at the indicated ratios plus streptavidin nanobeads (Biolegend, 10 μL for 1 × 10⁷ cells). The cell mixtures were cultured in anti-CD3-coated plates in the presence of neutralizing anti-PD-L1 antibodies (50 μg/ml) or IgG (50 μg/ml) for 3 days in normoxia. Cells were then stained with CD4- and CD8-specific mAbs and analyzed by flow cytometry for CFSE intensities of CD4+ (A) and CD8+ (B) T cells. Right panels show representative images of one of the two independent experiments. The % T cell suppressions are calculated as percentages of ratio of CFSE intensity of CD4+ (A) or CD8+ T cells in the presence of MDSCs to the CFSE intensity of CD4+ (A) or CD8+ (B) T cells in the absence of MDSCs. Column: mean; Bar: SD.
STAT1 is active in MDSCs
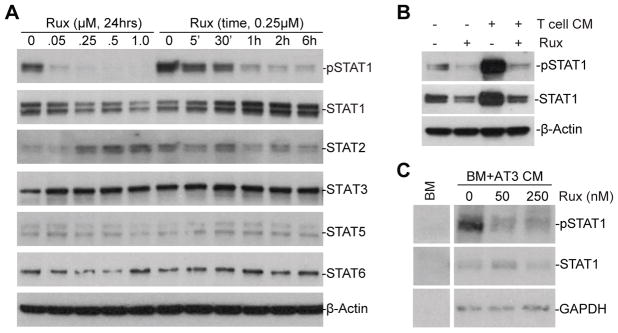
We next sought to determine what regulates PD-L1 expression in MDSCs. The type II IFNγ is a master regulator of induced PD-L1 expression in tumor cells and MDSCs (19, 27, 33). Type I IFNs have also been shown to up-regulate PD-L1 expression (19, 34). Both Type I and Type II regulate gene expression through the Jak-STAT signaling pathway. However, the molecular mechanism underlying PD-L1 expression in MDSCs is still elusive. We analyzed the activation status of STATs in MDSCs in vitro without exogenous interferon treatment. MDSC-like J774M cells were treated with Jak inhibitor ruxolitinib and analyzed for activation of STATs. Among the known STATs, we observed that only STAT1 are constitutively active in J774M cells cultured in vitro (Fig. 4A). Ruxolitinib treatment decreased STAT1 phosphorylation in a dose- and time-dependent manner (Fig. 4A). Activated T cells secrets IFNs, as expected, treatment of J774M with activated T cell-conditioned medium increased STAT1 phosphorylation and ruxolitinib inhibited both constitutive and T cell-conditioned medium-induced STAT1 phosphorylation in vitro (Fig. 4B). STAT1 is also active in BM-derived MDSCs that are induced by AT3 tumor cell-conditioned medium (Fig. 4C). However, we noticed that total STAT1 level is low in the AT3 tumor cell-conditioned medium-induced BM-MDSCs (Fig. 4C), suggesting that tumor cells-secreted factors may repress STAT1 expression in MDSCs. Nevertheless, ruxolitinib inhibited STAT1 phosphorylation in the BM-derived MDSCs. Our data therefore validate the literatures that the STAT1 signaling pathway is inducible in MDSCs. However, our data also suggest that the STAT1 pathway is constitutively active in MDSCs cultured in vitro without exogenous interferon.
Figure 4. STAT1 is constitutively active and regulated by the JAK-STAT signaling pathway in MDSCs in vitro.
A. J774M cells were treated with ruxolitinib at the indicated doses for 24 hrs or treated with ruxolitinib (250 nM) for different time as indicated. Total cell lysates were prepared and analyzed by Western blotting with the specific antibodies for the indicated proteins. β-actin was used as a normalization control. B. J774M cells were cultured in the presence of activated T cell-conditioned medium, ruxolitinib (250 nM) or both for 24 hrs and analyzed for pSTAT1 and STAT1 protein levels by Western blotting analysis. β-actin was used as a normalization control. C. BM cells were cultured in AT3 tumor cell-conditioned medium for 4 days to induce MDSCs. The BM-derived MDSCs were then treated with ruxolitinib (250 nM) for 24 hrs and analyzed for pSTAT1 and STAT1 protein levels by Western blotting analysis. GAPDH was used as a normalization control. Shown are representative results of one of three experiments.
To determine whether the constitutively active STAT1 regulates PD-L1 expression in MDSCs, J774M cells were treated with ruxilitinib and analyzed for PD-L1 expression. Ruxolitinib decreased PD-L1 expression level in J774M cells in a dose-dependent manner (Fig. 5A). Treatment of GM-CSF-induced BM MDSCs dramatically decreased PD-L1 expression levels (Fig. 5B). Further analysis of subsets of MDSCs revealed that ruxolitinib exhibits greater inhibitory activity in suppression of PD-L1 expression in PMN-MDSCs than in M-MDSCs (Fig. 5B). Similar findings were also observed in AT3 tumor cell conditioned medium-induced MDSCs (Fig. 5C).
Figure 5. The JAK-STAT signaling pathway regulates PD-L1 expression in MDSCs.
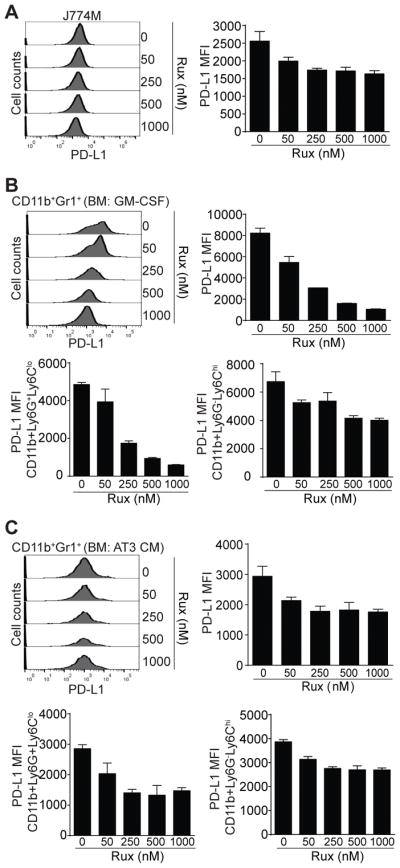
A. J774M cells were treated with ruxolitinib at the indicated doses for 24 hours. Cells were then stained with CD11b-, Gr1-1, and PD-L1-specific mAbs and analyzed by flow cytometry. CD11b+Gr1+ cells were gated and analyzed for PD-L1 MFI. Shown are representative results of one of two experiments. The PD-L1 MFI as shown in A was quantified and presented at the right. Column: mean; Bar: SD. B & C. BM cells were cultured in the presence of GM-CSF (B) or AT3 tumor cell-conditioned medium (C) and ruxolitinib at the indicated doses for 4 days. Cells were stained with CD11b-, Gr1- and PD-L1-specific mAbs, or CD11b-, Ly6G-, Ly6C, and PD-L1-specific mAbs. CD11b+Gr1+ cells were gated and analyzed for PD-L1 MFI (top left panels) and the PD-L1 MFI of CD11b+Gr1+ cells were quantified and presented at the top right. CD11b+Ly6G+Ly6Clo and CD11b+Ly6G−Ly6Chi cells were also gated and quantified for PD-L1 MFI (bottom panels). Shown are representative results of one of two experiments. Column: Mean; Bar: SD.
MDSCs express type I interferons
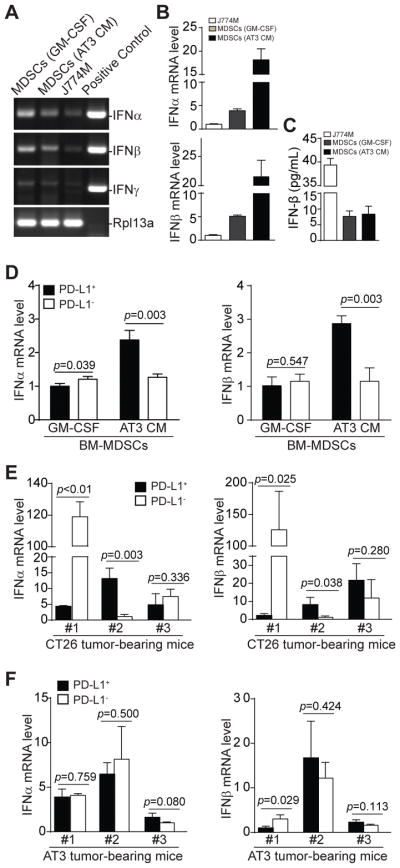
The above observations that MDSCs exhibit constitutive STAT1 activation suggest that MDSCs may express endogenous IFNs to activate the STAT signaling pathway to maintain PD-L1 expression. To test this hypothesis, we analyzed interferon expression in MDSC cells. RT-PCR analysis revealed that in vitro cultured MDSC-like J774M cells and BM-derived MDSCs express IFNα and IFNβ, but not IFNγ (Fig. 6A), with the tumor cell-conditioned medium-induced MDSCs expressed the highest mRNA levels of both IFNα and IFNβ (Fig. 6B). However, cytokines assay analysis of the cell culture medium indicates that J774M cells secrete the highest IFNβ protein (Fig. 6C).
Figure 6. IFNα and IFNβ expression profiles in PD-L1+ and PD-L1− MDSCs in vitro and in vivo.
A. BM cells were cultured in the presence of GM-CSF or AT3 tumor cell-conditioned medium for 5 days. These BM-derived MDSCs and J774M cells were analyzed by semi-quantitative PCR using mouse IFNα, IFNβ and IFNγ-specific primers. Cloned mouse IFNα, IFNβ and IFNγ cDNAs were used as positive controls. Rpl13a was used as normalization control. B. Analysis of IFNα and IFNβ mRNA levels in MDSCs by qPCR. β-actin was used as internal control. C. Culture supernatants of MDSCs as described in A were analyzed for IFNβ protein levels using flow-based beads array as described in the methods. D. BM-derived MDSCs as described in A were sorted into CD11b+Gr1+PD-L1+ (PD-L1+) and CD11b+Gr1+PD-L1− (PD-L1−) subsets and analyzed by qPCR for IFNα and IFNβ mRNA level using Rpl13a as internal controls. Column: mean; Bar: SD. E & F. Spleens were collected from CT26 (E, n=3) or AT3 (F, n=3) tumor-bearing mice. CD11b+Gr1+PD-L1+ (PD-L1+) and CD11b+Gr1+PD-L1− (PD-L1−) subsets of MDSCs were sorted and analyzed by qPCR for IFNα and IFNβ mRNA levels using Rpl13a as internal controls. Column: mean; Bar: SD.
CD11b+Gr1+ MDSCs were then sorted into PD-L1+ and PD-L1− cells and analyzed for IFNα and IFNβ mRNA levels. PD-L1+ and PD-L1− MDSCs from GM-CSF-induced BM MDSCs showed no significant differences in IFNα and IFNβ mRNA levels (Fig. 6D). However, PD-L1+ MDSCs from AT3 tumor cell-conditioned medium-induced MDSCs exhibited significantly higher mRNA levels of both IFNα and IFNβ than PD-L1− MDSCs (Fig. 6D). MDSCs from CT26 tumor-bearing mice showed variable IFNα and IFNβ mRNA levels between individual mouse in the PD-L1+ and PD-L1− subsets (Fig. 6E), whereas the mRNA levels of both IFNα and IFNβ were not significantly different between PD-L1+ and PD-L1− MDSCs in AT3 tumor-bearing mice (Fig. 6F). Our data indicate that MDSCs express both IFNα and IFNβ, but the expression levels of IFNα and IFNβ are generally not significantly different between PD-L1+ and PD-L1− MDSCs.
Type I IFN regulates PD-L1 expression via an autocrine mechanism
Our observations that IFNα and IFNβ are constitutively expressed and STAT1 is constitutively active in MDSCs and that both IFNα and IFNβ up-regulate PD-L1 expression in MDSCs strongly suggest that endogenously expressed IFNα and IFNβ regulate PD-L1 expression in MDSCs via an autocrine mechanism. To test this hypothesis, we treated BM-derived MDSCs with recombinant IFNα and IFNβ and analyzed PD-L1 expression. Treatment of GM-CSF-induced MDSCs with IFNα and IFNβ significantly decreased CD11b+Gr1+ MDSC frequencies but increased the percentages of CD11b−Gr1− cells (Fig. 7A & C). IFNα and IFNβ treatment also significantly increased PD-L1 expression levels of MDSCs (Fig. 7B & C). Similar patterns were observed in AT3 tumor cell conditioned medium-induced MDSCs (Fig. 7A–C). As a complimentary approach, we cultured MDSCs with anti-IFNAR1-blocking mAb to inhibit type I IFNs signaling. anti-IFNAR1-blocking mAb significantly decreased PD-L1 expression in J774M cells (Fig. 7D). Similarly, blocking IFNAR1 signaling significantly decreased PD-L1 expression levels in AT3 tumor cell-conditioned medium-induced MDSCs (Fig. 7E). Taken together, our data suggest that the PD-L1 expression is maintained and regulated by endogenous type I IFNs in MDSCs via an autocrine mechanism.
Figure 7. Type I interferon regulates PD-L1 expression in MDSCs by an autocrine manner.
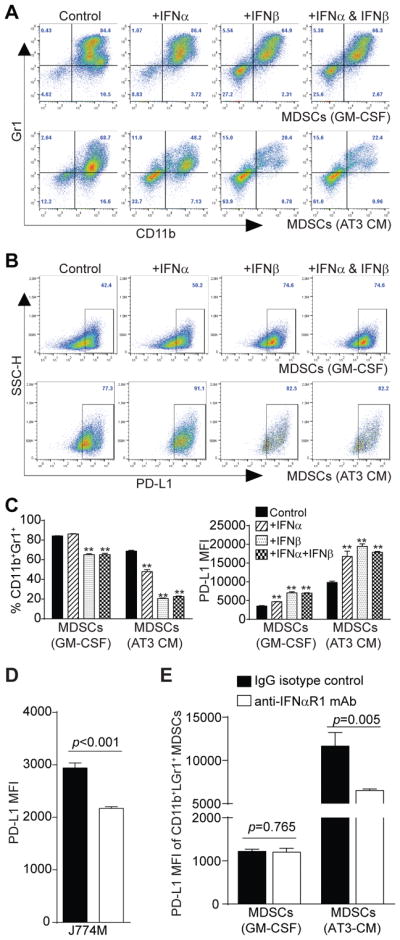
A. BM cells were cultured in the presence of GM-CSF (top panel) or AT3 tumor cell-conditioned medium (bottom panel). Recombinant IFNα (20 ng/ml), recombinant IFNβ (20 ng/ml) or both IFNα and IFNβ were added to the cultures. Four days later, cells were stained with CD11b-, Gr1-, and PD-L1-specific mAbs and analyzed by flow cytometry. Shown are representative plots of CD11b+Gr1+ cells of one of two experiments. B. The CD11b+Gr1+ cells as shown in A were gated and plotted for PD-L1 expression levels. C. CD11b+Gr1+ cells as shown in A were quantified and presented at the left. MFIs of PD-L1on MDSCs from different treatment groups as gated in B were also quantified and presented at the right. Column: mean; Bar: SD. D. J774M cells were cultured in the presence of IgG isotype control or IFNβ (10 μg/ml) neutralizing mAb for 4 days and analyzed for PD-L1 expression level. Column: mean, Bar: SD. E. BM cells were cultured in GM-CSF or AT3 tumor cell-conditioned medium in the presence of IgG isotype control mAb or anti-IFNAR1 neutralizing mAb (50 μg/ml) for 4 days. CD11b+Gr1+ cells were then gated and quantified for PD-L1 MFI. Column: mean, Bar: SD. Shown are representative results of one of two independent experiments.
IFNAR1 level is correlated with PD-L1 expression level in MDSCs
Our above observations indicate that autocrine IFNα and IFNβ regulate PD-L1 expression, although PD-L1+ MDSCs do not preferentially express IFNα or IFNβ. So what factor determines PD-L1 high expression in PD-L1+ MDSCs? Both IFNα and IFNβ signal through their receptor IFNAR1. We therefore analyzed the IFNAR1 expression levels in MDSCs. J774M cells express IFNAR1 (Fig. 8A), which received IFNα signal increased PD-L1 expression in J774M cells significantly (Fig. 8B).
Figure 8. IFNα up-regulates PD-L1 expression in MDSCs in vitro.
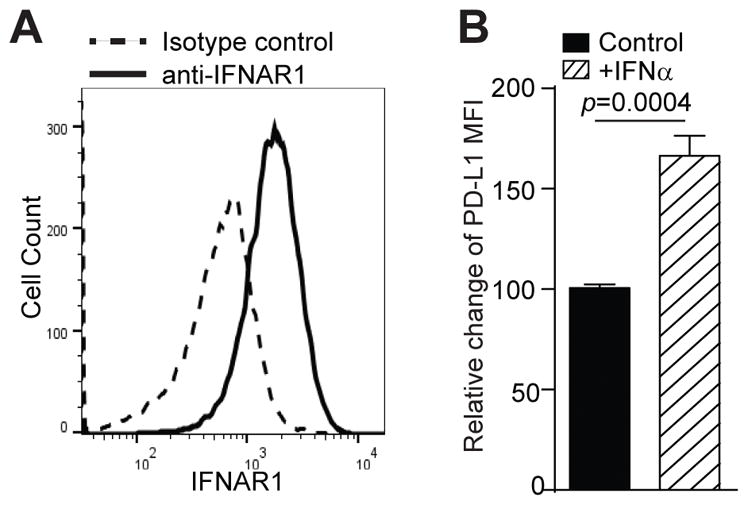
A. J774M cells were stained with CD11b-, Gr1-, and IFNAR1-specific mAbs and analyzed by flow cytometry. CD11b+Gr1+ cells were gated and analyzed for IFNAR1 expression level. IgG isotype control staining was used as a negative control. B. J774M cells were treated with recombinant IFNα (20 ng/ml) for 24 hours and analyzed for PD-L1 expression levels by flow cytometry. The MFI of untreated cells was arbitrarily set as 1. Column: mean; Bar: SD.
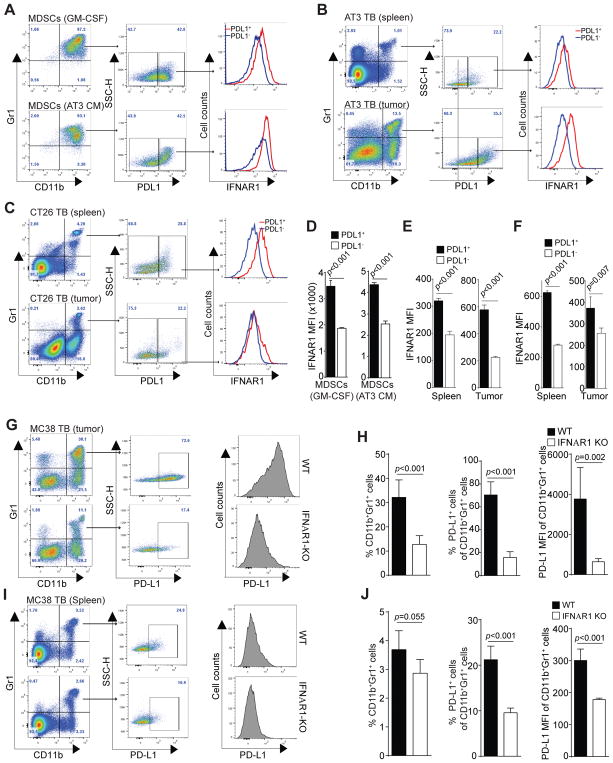
Next, PD-L1+ and PL-L1− CD11b+Gr1+ MDSCs were analyzed for IFNAR1 levels. For both GM-CSF-induced and AT3 tumor cell conditioned medium-induced MDSCs, PD-L1+ subset of MDSCs expressed significantly higher IFNAR1 than PD-L1− subset of MDSCs (Fig. 9A & D). To determine whether this finding can be extended to MDSCs in tumor-bearing mice in vivo, CD11b+Gr1+ MDSCs from spleens and tumors of AT3 tumor-bearing mice were gated for PD-L1 expression levels. The PD-L1+ and PD-L1− MDSCs were then analyzed for IFNAR1 expression levels. PD-L1+ subset of MDSCs express significantly higher levels of IFNAR1 than PD-L1− MDSCs in both spleens and tumor tissues (Fig. 9B & E). Similar IFNAR1 expression patterns were also observed in CT26 tumor-bearing mice (Fig. 9C & F). These observations clearly demonstrated that PD-L1 expression level is positively correlated with the IFNAR1 level on MDSCs both in vitro and in vivo.
Figure 9. IFNAR1 controls PD-L1 expression in MDSCs.
A. BM cells were cultured in the presence of GM-CSF (top panel) or AT3 tumor cell-conditioned medium for 4 days. These BM-derived CD11b+Gr1+ cells were analyzed for PD-L1 expression levels. PD-L1+ and PD-L1− MDSCs were then analyzed for IFNAR1 expression level. Shown are representative results of one of three experiments. B. IFNAR1 MFIs of PD-L1+ and PD-L1− MDSCs as shown in A were quantified. Column: mean; Bar: SD. C. Spleens and tumors were collected from AT3 mammary carcinoma-bearing mice (n=5). CD11b+Gr1+ cells were analyzed for PD-L1 expression levels. PD-L1+ and PD-L1− MDSCs were then analyzed for IFNAR1 expression level. Shown are representative results of one of three tumor-bearing mice. D. IFNAR1 MFIs of PD-L1+ and PD-L1− MDSCs as shown in C were quantified. Column: mean; Bar: SD. E. Spleens and tumors were collected from CT26 colon carcinoma-bearing mice (n=4). CD11b+Gr1+ cells were analyzed for PD-L1 expression levels. PD-L1+ and PD-L1− MDSCs were then analyzed for IFNAR1 expression level. Shown are representative results of one of three tumor-bearing mice. F. IFNAR1 MFIs of PD-L1+ and PD-L1− MDSCs as shown in E were quantified. Column: mean; Bar: SD. G–J. Tumors (G) and spleens (I) were collected from MC38 tumor-bearing WT (n=5) and IFNAR1 KO (n=5) mice and prepared for single cells. Cells were stained with CD11b-, Gr1, and PD-L1-specific mAbs and CD11b+Gr1+ cells were gated for PD-L1 expression levels. The PD-L1+ and PD-L1− MDSCs were then analyzed for PD-L1 MFI. Shown are representative plots of one each of WT and IFNAR1 KO mice. The percentages of CD11b+Gr1+ cells and PD-L1+CD11b+Gr1+ cells in tumors (H) and spleens (J) of WT and IFNAR1 KO mice were quantified. The PD-L1 MFI of CD11b+Gr1+ from WT and IFNAR1 KO mice were also quantified. Column: mean; Bar: SD.
IFNAR1 controls PD-L1 expression in MDSCs
The above observation that the PD-L1 expression levels are correlated with the IFNAR1 expression levels in MDSCs in vitro and in vivo suggest that the IFNAR1 might controls PD-L1 expression level. To test this hypothesis, MC38 colon cancer mouse models were established in WT and IFNAR1 KO mice, respectively. Tumors and spleens were then collected from tumor-bearing mice and analyzed MDSCs for PD-L1 expression levels. In the tumor tissues, CD11b+Gr1+ MDSCs of WT mice clearly express significantly higher levels of PD-L1 than that of IFNAR1 KO mice (Fig. 9G & H). Similar MDSC percentages and PD-L1 expression patterns were observed in the spleens of the WT and IFNAR1 KO mice (Fig. 9I & J). Taken together, our data demonstrated that the PD-L1 expression level in PD-L1+ MDSCs is controlled not by the expression levels of endogenous IFNα and IFNβ, but by the IFNAR1 level in MDSCs in vivo.
Discussion
Compelling experimental data from both human cancer patients and mouse tumor models have shown that the ARG- and iNOS-mediated arginine metabolism pathways play key roles in MDSC-mediated immune suppression of T cell functions (8, 9, 11, 12). The immune suppressive ligand PD-L1 is expressed on tumor-induced MDSCs. The function of PD-L1 in suppression of T cell function is apparently tumor type and cellular context-dependent (15). While PD-L1 of MDSCs induced by the EL4 tumor did not exhibit suppressive activity against T cell activation in vitro and function in vivo under normoxia culture conditions (15), blockade of PD-L1 function under hypoxia significantly abrogated the suppressive activity of B10-F1- tumor-induced MDSCs in suppression of T cell activation (21). In this study, we validate these findings. Furthermore, we made use of an artificial T cell-MDSC interaction model to bring T cells and MDSCs in direct contact to mimic the physiological TCR-MHC I complex interactions (32) and observed that blocking PD-L1 with a neutralizing mAb decreased MDSC-mediated suppressive activity against T cell proliferation in vitro, suggesting that PD-L1 contributes at least in part to the suppressive activity of MDSCs against T cell activation. This observation supports the notion that MDSCs might act in a similar manner as antigen-presenting cells that binds to T cells to engage the PD-1 receptor through their PD-L1. However, further studies are required to determine the different functions of MDSC-expressed PD-L1 in different tumor models under different cellular contexts.
It is well documented that IFNγ functions as a master regulator of PD-L1 expression in tumor cells and it is proposed that tumor cell express PD-L1 as an adaptive immune resistance mechanism in response to IFNγ production by tumor-reactive T cells (35–37). Although IFNγ has been shown to up-regulate PD-L1 expression in tumor cells and myeloid cells (27, 34, 38), analysis of interferon expression in MDSC-like cells in vitro indicates that IFNγ is undetectable in MDSCs cultured in vitro. Instead, we observed that both IFNα and IFNβ are expressed in cultured CD11b+Gr1+ MDSC-like cells in vitro. Furthermore, high level of IFNβ protein was detected in MDSC culture medium. These observations thus suggest that endogenous IFNα and IFNβ regulate PD-L1 expression in MDSCs in vitro and may play a role in immune suppression. Type I IFNs are generally considered immunostimulatory cytokines that enhance cancer immune surveillance (39–42). It is well-documented that type I IFNs produced by tumor cells and tumor-infiltrating dendritic cells control the autocrine and paracrine circuits to regulate host cancer immune surveillance (43–47). In this study, we observed that type I interferon activates the expression of the immune suppressive PD-L1 in MDSCs, suggesting that, like tumor cells, MDSCs may also acquire an adaptive resistant mechanism by responding to endogenous type I IFNs to express PD-L1. However, the precise role of this immunosuppressive function of IFNα and IFNβ in host anti-cancer immune response reminds to be determined.
IFNα and IFNβ signal through the interferon receptor type I (IFNAR) to activate Jak 1 and TYK2, which phosphorylates STAT1, as well as other STAT family members, depending on the cellular context (40, 41). Phosphorylated STAT1 may dimerize with another phosphorylated STAT1 to form a pSTAT1 homodimer or with other STATs to form heterodimers. pSTAT1 then directly activate the expression IRF1 to up-regulate PD-L1 expression (19, 33). Consistent with endogenous IFNα and IFNβ expression, we observed that MDSC-like cells exhibit constitutive STAT1 phosphorylation. However, no other phosphorylated STATs were detected, suggesting the pSTAT1 homodimer might mediates the endogenous IFNα/β-mediated PD-L1 expression in MDSCs in vitro. In support of these in vitro observations, both IFNα and IFNβ are expressed in MDSCs from BM-derived MDSCs and tumor-induced MDSCs. Although exogenous IFNα and IFNβ may contribute to PD-L1 up-regulation in tumor cells and myeloid cells (19, 27, 34), our data suggest that MDSCs-expressed endogenous IFNα and IFNβ regulate PD-L1 expression via an autocrine mechanism. Therefore, it seems that MDSCs may express and secrete type I IFNs that in turn binds to the IFNAR1 to activate STAT1 to up-regulate PD-L1 expression in MDSCs. We should point out that the MDSC-like J774M is a myeloid cell line, not primary cells. Therefore, further studies in primary myeloid cells are needed to determine the constitutive STAT1 activation and PD-L1 expression regulation in primary MDSCs.
IFNα and IFNβ are expressed in MDSCs in vitro and in vivo, the expression levels of IFNα and IFNβ are apparently not correlated with the PD-L1 expression levels in MDSCs, suggesting that endogenous IFNα and IFNβ regulate PD-L1 expression but are not the determining factors of PD-L1 expression levels in MDSCs. As discussed above, IFNα and IFNβ signal through the IFNAR which consists of IFNAR1 and IFNAR2 (40, 41). Analysis of the IFNAR1 expression level revealed that IFNAR1 levels are positively correlated with PD-L1 expression levels in MDSCs in vitro and in vivo and IFNAR1 deficiency leads to diminished PD-L1 expression in tumor-induced MDSCs. There are at least 14 IFNα isoforms which are each encoded by individual genes but all signal through IFNAR (48, 49). Our finding that the IFNAR1 level, not the IFNα expression level, controls IFNα signaling and target gene expression thus suggests that IFNAR1, not the types of IFNα isoforms, is the determining factor for the type I IFN signaling pathway.
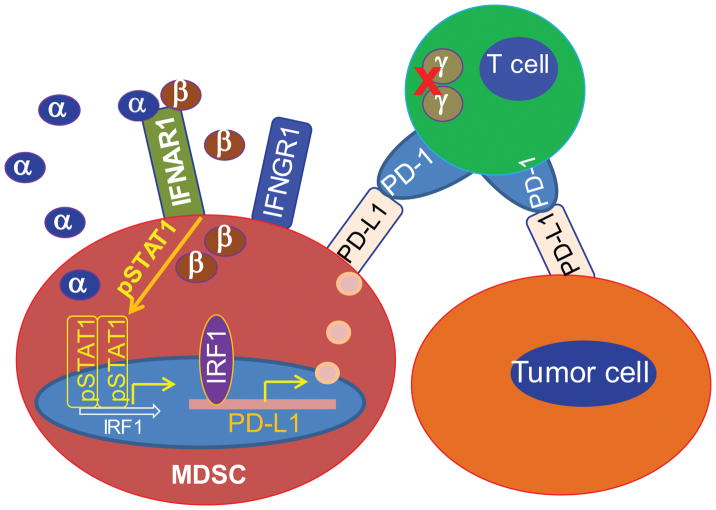
It is known that IFNγ is a master regulator of PD-L1, and PD-L1 expression up-regulation by IFNγ is an adaptive resistance response to the activated T cells in the tumor microenvironment (35–37). IFNγ is produced by activated T cells and NK cells in the tumor microenvironment. MDSCs are potent suppressors of both T cells and NK cells (5, 8, 9) and often massively accumulate in the tumor microenvironment (3). Suppressed T cells and NK cells may not produce IFNγ or produce a low level of IFNγ. Therefore, as a compensatory mechanism, MDSCs may secrete type I interferons to maintain PD-L1 expression to exert their maximal immune suppressive activity in the immune suppressive tumor microenvironment. Therefore, the autocrine IFNα/IFNβ-pSTAT1-PD-L1 circuit may be a crucial pathway for PD-L1 expression in MDSCs to maintain MDSC immune suppressive function in the tumor microenvironment (Fig. 10).
Figure 10. Model of PD-L1 expression regulation in MDSCs in the tumor microenvironment.
Activated T cell-produced IFNγ is a master regulator of PD-L1. However, T cell activation may be suppressed in the immune suppressive tumor microenvironment, resulting in loss or low level of IFNγ production. As a compensatory mechanism, MDSCs may secrete type I interferons to maintain PD-L1 expression to exert their maximal immune suppressive activity in the immune suppressive tumor microenvironment. Therefore, the autocrine IFNα/IFNβ-pSTAT1-PD-L1 circuit may be a crucial pathway for up-regulation of PD-L1 expression in MDSCs to maintain MDSC immune suppressive function in the tumor microenvironment.
Acknowledgments
We thank Dr. Jeanene Pihkala at the Medical College of Georgia Flow Cytometry Core Facility and Dr. Ningchun Xu at Georgia Cancer Center Flow Cytometry Core Facility for assistance in cell sorting.
Footnotes
Conflict of interest: The authors declare no potential conflicts of interest.
Author contributions
W.X., J.D.K., C.L., M.L.I.: performed experiments and analyzed data. W.X., K.L.: wrote the manuscript. K.L. designed the studies.
References
- 1.Bronte V, Brandau S, Chen SH, Colombo MP, Frey AB, Greten TF, Mandruzzato S, Murray PJ, Ochoa A, Ostrand-Rosenberg S, Rodriguez PC, Sica A, Umansky V, Vonderheide RH, Gabrilovich DI. Recommendations for myeloid-derived suppressor cell nomenclature and characterization standards. Nat Commun. 2016;7:12150. doi: 10.1038/ncomms12150. [DOI] [PMC free article] [PubMed] [Google Scholar]
- 2.Gabrilovich DI. Myeloid-Derived Suppressor Cells. Cancer Immunol Res. 2017;5:3–8. doi: 10.1158/2326-6066.CIR-16-0297. [DOI] [PMC free article] [PubMed] [Google Scholar]
- 3.Gabrilovich DI, Ostrand-Rosenberg S, Bronte V. Coordinated regulation of myeloid cells by tumours. Nat Rev Immunol. 2012;12:253–268. doi: 10.1038/nri3175. [DOI] [PMC free article] [PubMed] [Google Scholar]
- 4.Parker KH, Beury DW, Ostrand-Rosenberg S. Myeloid-Derived Suppressor Cells: Critical Cells Driving Immune Suppression in the Tumor Microenvironment. Adv Cancer Res. 2015;128:95–139. doi: 10.1016/bs.acr.2015.04.002. [DOI] [PMC free article] [PubMed] [Google Scholar]
- 5.Hoechst B, Voigtlaender T, Ormandy L, Gamrekelashvili J, Zhao F, Wedemeyer H, Lehner F, Manns MP, Greten TF, Korangy F. Myeloid derived suppressor cells inhibit natural killer cells in patients with hepatocellular carcinoma via the NKp30 receptor. Hepatology. 2009;50:799–807. doi: 10.1002/hep.23054. [DOI] [PMC free article] [PubMed] [Google Scholar]
- 6.Messmer MN, Netherby CS, Banik D, Abrams SI. Tumor-induced myeloid dysfunction and its implications for cancer immunotherapy. Cancer Immunol Immunother. 2015;64:1–13. doi: 10.1007/s00262-014-1639-3. [DOI] [PMC free article] [PubMed] [Google Scholar]
- 7.Lee JM, Seo JH, Kim YJ, Kim YS, Ko HJ, Kang CY. The restoration of myeloid-derived suppressor cells as functional antigen-presenting cells by NKT cell help and all-trans-retinoic acid treatment. Int J Cancer. 2012;131:741–751. doi: 10.1002/ijc.26411. [DOI] [PubMed] [Google Scholar]
- 8.Rodriguez PC, Quiceno DG, Zabaleta J, Ortiz B, Zea AH, Piazuelo MB, Delgado A, Correa P, Brayer J, Sotomayor EM, Antonia S, Ochoa JB, Ochoa AC. Arginase I production in the tumor microenvironment by mature myeloid cells inhibits T-cell receptor expression and antigen-specific T-cell responses. Cancer Res. 2004;64:5839–5849. doi: 10.1158/0008-5472.CAN-04-0465. [DOI] [PubMed] [Google Scholar]
- 9.Bronte V, Serafini P, Mazzoni A, Segal DM, Zanovello P. L-arginine metabolism in myeloid cells controls T-lymphocyte functions. Trends Immunol. 2003;24:302–306. doi: 10.1016/s1471-4906(03)00132-7. [DOI] [PubMed] [Google Scholar]
- 10.Brito C, Naviliat M, Tiscornia AC, Vuillier F, Gualco G, Dighiero G, Radi R, Cayota AM. Peroxynitrite inhibits T lymphocyte activation and proliferation by promoting impairment of tyrosine phosphorylation and peroxynitrite-driven apoptotic death. J Immunol. 1999;162:3356–3366. [PubMed] [Google Scholar]
- 11.Nagaraj S, Gupta K, Pisarev V, Kinarsky L, Sherman S, Kang L, Herber DL, Schneck J, Gabrilovich DI. Altered recognition of antigen is a mechanism of CD8+ T cell tolerance in cancer. Nat Med. 2007;13:828–835. doi: 10.1038/nm1609. [DOI] [PMC free article] [PubMed] [Google Scholar]
- 12.Mundy-Bosse BL, Lesinski GB, Jaime-Ramirez AC, Benninger K, Khan M, Kuppusamy P, Guenterberg K, Kondadasula SV, Chaudhury AR, La Perle KM, Kreiner M, Young G, Guttridge DC, Carson WE., 3rd Myeloid-derived suppressor cell inhibition of the IFN response in tumor-bearing mice. Cancer Res. 2011;71:5101–5110. doi: 10.1158/0008-5472.CAN-10-2670. [DOI] [PMC free article] [PubMed] [Google Scholar]
- 13.Hui E, Cheung J, Zhu J, Su X, Taylor MJ, Wallweber HA, Sasmal DK, Huang J, Kim JM, Mellman I, Vale RD. T cell costimulatory receptor CD28 is a primary target for PD-1-mediated inhibition. Science. 2017;355:1428–1433. doi: 10.1126/science.aaf1292. [DOI] [PMC free article] [PubMed] [Google Scholar]
- 14.Prima V, Kaliberova LN, Kaliberov S, Curiel DT, Kusmartsev S. COX2/mPGES1/PGE2 pathway regulates PD-L1 expression in tumor-associated macrophages and myeloid-derived suppressor cells. Proc Natl Acad Sci U S A. 2017;114:1117–1122. doi: 10.1073/pnas.1612920114. [DOI] [PMC free article] [PubMed] [Google Scholar]
- 15.Youn JI, Nagaraj S, Collazo M, Gabrilovich DI. Subsets of myeloid-derived suppressor cells in tumor-bearing mice. J Immunol. 2008;181:5791–5802. doi: 10.4049/jimmunol.181.8.5791. [DOI] [PMC free article] [PubMed] [Google Scholar]
- 16.Fujimura T, Ring S, Umansky V, Mahnke K, Enk AH. Regulatory T cells stimulate B7-H1 expression in myeloid-derived suppressor cells in ret melanomas. J Invest Dermatol. 2012;132:1239–1246. doi: 10.1038/jid.2011.416. [DOI] [PubMed] [Google Scholar]
- 17.Schroder M, Loos S, Naumann SK, Bachran C, Krotschel M, Umansky V, Helming L, Swee LK. Identification of inhibitors of myeloid-derived suppressor cells activity through phenotypic chemical screening. Oncoimmunology. 2017;6:e1258503. doi: 10.1080/2162402X.2016.1258503. [DOI] [PMC free article] [PubMed] [Google Scholar]
- 18.Iwata T, Kondo Y, Kimura O, Morosawa T, Fujisaka Y, Umetsu T, Kogure T, Inoue J, Nakagome Y, Shimosegawa T. PD-L1+MDSCs are increased in HCC patients and induced by soluble factor in the tumor microenvironment. Sci Rep. 2016;6:39296. doi: 10.1038/srep39296. [DOI] [PMC free article] [PubMed] [Google Scholar]
- 19.Lu C, Redd PS, Lee JR, Savage N, Liu K. The expression profiles and regulation of PD-L1 in tumor-induced myeloid-derived suppressor cells. Oncoimmunology. 2016;5:e1247135. doi: 10.1080/2162402X.2016.1247135. [DOI] [PMC free article] [PubMed] [Google Scholar]
- 20.Limagne E, Euvrard R, Thibaudin M, Rebe C, Derangere V, Chevriaux A, Boidot R, Vegran F, Bonnefoy N, Vincent J, Bengrine L, Ladoire S, Delmas D, Apetoh L, Ghiringhelli F. Accumulation of MDSC and Th17 cells in patients with metastatic colorectal cancer predict the efficacy of a FOLFOX-bevacizumab drug treatment regimen. Cancer Res. 2016 doi: 10.1158/0008-5472.CAN-15-3164. [DOI] [PubMed] [Google Scholar]
- 21.Noman MZ, Desantis G, Janji B, Hasmim M, Karray S, Dessen P, Bronte V, Chouaib S. PD-L1 is a novel direct target of HIF-1alpha, and its blockade under hypoxia enhanced MDSC-mediated T cell activation. J Exp Med. 2014;211:781–790. doi: 10.1084/jem.20131916. [DOI] [PMC free article] [PubMed] [Google Scholar]
- 22.Lastwika KJ, Wilson W, 3rd, Li QK, Norris J, Xu H, Ghazarian SR, Kitagawa H, Kawabata S, Taube JM, Yao S, Liu LN, Gills JJ, Dennis PA. Control of PD-L1 Expression by Oncogenic Activation of the AKT-mTOR Pathway in Non-Small Cell Lung Cancer. Cancer Res. 2016;76:227–238. doi: 10.1158/0008-5472.CAN-14-3362. [DOI] [PubMed] [Google Scholar]
- 23.Parsa AT, Waldron JS, Panner A, Crane CA, Parney IF, Barry JJ, Cachola KE, Murray JC, Tihan T, Jensen MC, Mischel PS, Stokoe D, Pieper RO. Loss of tumor suppressor PTEN function increases B7-H1 expression and immunoresistance in glioma. Nat Med. 2007;13:84–88. doi: 10.1038/nm1517. [DOI] [PubMed] [Google Scholar]
- 24.Akbay EA, Koyama S, Carretero J, Altabef A, Tchaicha JH, Christensen CL, Mikse OR, Cherniack AD, Beauchamp EM, Pugh TJ, Wilkerson MD, Fecci PE, Butaney M, Reibel JB, Soucheray M, Cohoon TJ, Janne PA, Meyerson M, Hayes DN, Shapiro GI, Shimamura T, Sholl LM, Rodig SJ, Freeman GJ, Hammerman PS, Dranoff G, Wong KK. Activation of the PD-1 pathway contributes to immune escape in EGFR-driven lung tumors. Cancer Discov. 2013;3:1355–1363. doi: 10.1158/2159-8290.CD-13-0310. [DOI] [PMC free article] [PubMed] [Google Scholar]
- 25.Taube JM, Anders RA, Young GD, Xu H, Sharma R, McMiller TL, Chen S, Klein AP, Pardoll DM, Topalian SL, Chen L. Colocalization of inflammatory response with B7-h1 expression in human melanocytic lesions supports an adaptive resistance mechanism of immune escape. Sci Transl Med. 2012;4:127ra137. doi: 10.1126/scitranslmed.3003689. [DOI] [PMC free article] [PubMed] [Google Scholar]
- 26.Spranger S, Spaapen RM, Zha Y, Williams J, Meng Y, Ha TT, Gajewski TF. Up-regulation of PD-L1, IDO, and T(regs) in the melanoma tumor microenvironment is driven by CD8(+) T cells. Sci Transl Med. 2013;5:200ra116. doi: 10.1126/scitranslmed.3006504. [DOI] [PMC free article] [PubMed] [Google Scholar]
- 27.Garcia-Diaz A, Shin DS, Moreno BH, Saco J, Escuin-Ordinas H, Rodriguez GA, Zaretsky JM, Sun L, Hugo W, Wang X, Parisi G, Saus CP, Torrejon DY, Graeber TG, Comin-Anduix B, Hu-Lieskovan S, Damoiseaux R, Lo RS, Ribas A. Interferon Receptor Signaling Pathways Regulating PD-L1 and PD-L2 Expression. Cell Rep. 2017;19:1189–1201. doi: 10.1016/j.celrep.2017.04.031. [DOI] [PMC free article] [PubMed] [Google Scholar]
- 28.Stewart TJ, Liewehr DJ, Steinberg SM, Greeneltch KM, Abrams SI. Modulating the expression of IFN regulatory factor 8 alters the protumorigenic behavior of CD11b+Gr-1+ myeloid cells. J Immunol. 2009;183:117–128. doi: 10.4049/jimmunol.0804132. [DOI] [PMC free article] [PubMed] [Google Scholar]
- 29.Liu F, Li X, Lu C, Bai A, Bielawski J, Bielawska A, Marshall B, Schoenlein PV, Lebedyeva IO, Liu K. Ceramide activates lysosomal cathepsin B and cathepsin D to attenuate autophagy and induces ER stress to suppress myeloid-derived suppressor cells. Oncotarget. 2016;7:83907–83925. doi: 10.18632/oncotarget.13438. [DOI] [PMC free article] [PubMed] [Google Scholar]
- 30.Kusmartsev S, Nagaraj S, Gabrilovich DI. Tumor-associated CD8+ T cell tolerance induced by bone marrow-derived immature myeloid cells. J Immunol. 2005;175:4583–4592. doi: 10.4049/jimmunol.175.7.4583. [DOI] [PMC free article] [PubMed] [Google Scholar]
- 31.Nagaraj S, Gabrilovich DI. Tumor escape mechanism governed by myeloid-derived suppressor cells. Cancer Res. 2008;68:2561–2563. doi: 10.1158/0008-5472.CAN-07-6229. [DOI] [PubMed] [Google Scholar]
- 32.Liu K, Catalfamo M, Li Y, Henkart PA, Weng NP. IL-15 mimics T cell receptor crosslinking in the induction of cellular proliferation, gene expression, and cytotoxicity in CD8+ memory T cells. Proc Natl Acad Sci U S A. 2002;99:6192–6197. doi: 10.1073/pnas.092675799. [DOI] [PMC free article] [PubMed] [Google Scholar]
- 33.Lee SJ, Jang BC, Lee SW, Yang YI, Suh SI, Park YM, Oh S, Shin JG, Yao S, Chen L, Choi IH. Interferon regulatory factor-1 is prerequisite to the constitutive expression and IFN-gamma-induced upregulation of B7-H1 (CD274) FEBS Lett. 2006;580:755–762. doi: 10.1016/j.febslet.2005.12.093. [DOI] [PubMed] [Google Scholar]
- 34.Shaabani N, Duhan V, Khairnar V, Gassa A, Ferrer-Tur R, Haussinger D, Recher M, Zelinskyy G, Liu J, Dittmer U, Trilling M, Scheu S, Hardt C, Lang PA, Honke N, Lang KS. CD169+ macrophages regulate PD-L1 expression via type I interferon and thereby prevent severe immunopathology after LCMV infection. Cell Death Dis. 2016;7:e2446. doi: 10.1038/cddis.2016.350. [DOI] [PMC free article] [PubMed] [Google Scholar]
- 35.Topalian SL, Taube JM, Anders RA, Pardoll DM. Mechanism-driven biomarkers to guide immune checkpoint blockade in cancer therapy. Nat Rev Cancer. 2016;16:275–287. doi: 10.1038/nrc.2016.36. [DOI] [PMC free article] [PubMed] [Google Scholar]
- 36.Ribas A. Adaptive Immune Resistance: How Cancer Protects from Immune Attack. Cancer Discov. 2015;5:915–919. doi: 10.1158/2159-8290.CD-15-0563. [DOI] [PMC free article] [PubMed] [Google Scholar]
- 37.Tumeh PC, Harview CL, Yearley JH, Shintaku IP, Taylor EJ, Robert L, Chmielowski B, Spasic M, Henry G, Ciobanu V, West AN, Carmona M, Kivork C, Seja E, Cherry G, Gutierrez AJ, Grogan TR, Mateus C, Tomasic G, Glaspy JA, Emerson RO, Robins H, Pierce RH, Elashoff DA, Robert C, Ribas A. PD-1 blockade induces responses by inhibiting adaptive immune resistance. Nature. 2014;515:568–571. doi: 10.1038/nature13954. [DOI] [PMC free article] [PubMed] [Google Scholar]
- 38.Loke P, Allison JP. PD-L1 and PD-L2 are differentially regulated by Th1 and Th2 cells. Proc Natl Acad Sci U S A. 2003;100:5336–5341. doi: 10.1073/pnas.0931259100. [DOI] [PMC free article] [PubMed] [Google Scholar]
- 39.Zitvogel L, Galluzzi L, Kepp O, Smyth MJ, Kroemer G. Type I interferons in anticancer immunity. Nat Rev Immunol. 2015;15:405–414. doi: 10.1038/nri3845. [DOI] [PubMed] [Google Scholar]
- 40.Parker BS, Rautela J, Hertzog PJ. Antitumour actions of interferons: implications for cancer therapy. Nat Rev Cancer. 2016;16:131–144. doi: 10.1038/nrc.2016.14. [DOI] [PubMed] [Google Scholar]
- 41.Ivashkiv LB, Donlin LT. Regulation of type I interferon responses. Nat Rev Immunol. 2014;14:36–49. doi: 10.1038/nri3581. [DOI] [PMC free article] [PubMed] [Google Scholar]
- 42.Rautela J, Baschuk N, Slaney CY, Jayatilleke KM, Xiao K, Bidwell BN, Lucas EC, Hawkins ED, Lock P, Wong CS, Chen W, Anderson RL, Hertzog PJ, Andrews DM, Moller A, Parker BS. Loss of Host Type-I IFN Signaling Accelerates Metastasis and Impairs NK-cell Antitumor Function in Multiple Models of Breast Cancer. Cancer Immunol Res. 2015;3:1207–1217. doi: 10.1158/2326-6066.CIR-15-0065. [DOI] [PubMed] [Google Scholar]
- 43.Dunn GP, Bruce AT, Sheehan KC, Shankaran V, Uppaluri R, Bui JD, Diamond MS, Koebel CM, Arthur C, White JM, Schreiber RD. A critical function for type I interferons in cancer immunoediting. Nat Immunol. 2005;6:722–729. doi: 10.1038/ni1213. [DOI] [PubMed] [Google Scholar]
- 44.Diamond MS, Kinder M, Matsushita H, Mashayekhi M, Dunn GP, Archambault JM, Lee H, Arthur CD, White JM, Kalinke U, Murphy KM, Schreiber RD. Type I interferon is selectively required by dendritic cells for immune rejection of tumors. J Exp Med. 2011;208:1989–2003. doi: 10.1084/jem.20101158. [DOI] [PMC free article] [PubMed] [Google Scholar]
- 45.Bald T, Landsberg J, Lopez-Ramos D, Renn M, Glodde N, Jansen P, Gaffal E, Steitz J, Tolba R, Kalinke U, Limmer A, Jonsson G, Holzel M, Tuting T. Immune cell-poor melanomas benefit from PD-1 blockade after targeted type I IFN activation. Cancer Discov. 2014;4:674–687. doi: 10.1158/2159-8290.CD-13-0458. [DOI] [PubMed] [Google Scholar]
- 46.Sisirak V, Faget J, Gobert M, Goutagny N, Vey N, Treilleux I, Renaudineau S, Poyet G, Labidi-Galy SI, Goddard-Leon S, Durand I, Le Mercier I, Bajard A, Bachelot T, Puisieux A, Puisieux I, Blay JY, Menetrier-Caux C, Caux C, Bendriss-Vermare N. Impaired IFN-alpha production by plasmacytoid dendritic cells favors regulatory T-cell expansion that may contribute to breast cancer progression. Cancer Res. 2012;72:5188–5197. doi: 10.1158/0008-5472.CAN-11-3468. [DOI] [PubMed] [Google Scholar]
- 47.Yang X, Zhang X, Fu ML, Weichselbaum RR, Gajewski TF, Guo Y, Fu YX. Targeting the tumor microenvironment with interferon-beta bridges innate and adaptive immune responses. Cancer Cell. 2014;25:37–48. doi: 10.1016/j.ccr.2013.12.004. [DOI] [PMC free article] [PubMed] [Google Scholar]
- 48.van Pesch V, Lanaya H, Renauld JC, Michiels T. Characterization of the murine alpha interferon gene family. J Virol. 2004;78:8219–8228. doi: 10.1128/JVI.78.15.8219-8228.2004. [DOI] [PMC free article] [PubMed] [Google Scholar]
- 49.van Pesch V, Michiels T. Characterization of interferon-alpha 13, a novel constitutive murine interferon-alpha subtype. J Biol Chem. 2003;278:46321–46328. doi: 10.1074/jbc.M302554200. [DOI] [PubMed] [Google Scholar]


