

Abstract
Bipolar disorder (BD) patients show aberrant white matter microstructure compared to healthy controls but little is known about the relation with clinical characteristics. We therefore investigated the relation of white matter microstructure with the main pharmacological treatments as well its relation with IQ. Patients with BD (N=257) and controls (N=167) underwent diffusion tensor imaging (DTI) and comprehensive clinically assessments including IQ estimates. DTI images were analyzed using tract-based spatial statistics. Fractional anisotropy (FA) and Mean Diffusivity (MD) were determined. Patients had significantly lower FA and higher MD values throughout the white matter skeleton compared to controls. Within the BD patients, lithium use was associated with higher FA and lower MD. Antipsychotic medication use in the BD patients was not associated with FA but, in contrast to lithium, was associated with higher MD. IQ was significantly positively correlated with FA and negatively with MD in patients as well as in controls. In this large DTI study we found evidence for marked differences in FA and MD particularly in (but not restricted to) corpus callosum, between BD patients and controls. This effect was most pronounced in lithium-free patients, implicating that lithium affects white matter microstructure and attenuates differences associated with bipolar disorder. Effects of antipsychotic medication intake were absent in FA and only subtle in MD relative to those of lithium. The abnormal white matter microstructure was associated with IQ but not specifically for either group.
Keywords: bipolar disorder, lithium, antipsychotic medication, IQ, diffusion-weighted imaging, TBSS
1. Introduction
Converging evidence from magnetic resonance imaging studies suggests that deviations in local white matter volume as well as abnormal structural connectivity play a role in the pathogenesis of BD (O’Donoghue et al., 2017; Bellani et al., 2016 Benedetti and Bollettini, 2014). However, little is known about the influence of clinical characteristics like psychotropic medication on white matter microstructure or whether potential changes in white matter microstructure is related to level of intelligence in patients with Bipolar disorder (BD).
Whereas there is general consensus that lithium has a normalizing or preserving effect on brain volume, leading to attenuated differences between patients and controls (Bearden et al., 2007; Germaná et al., 2010, Singh and Chang, 2012; Hafeman et al., 2012; Abramovic et al., 2016, Hibar et al., 2017), such a role is much less clear for lithium in studies of white matter microstructure. Lithium was positively associated with clusters in the corpus callosum (CC; Walterfang et al., 2009), the left anterior corona radiate and two small peripheral tracts in the frontal orbital cortex (Haarman et al., 2016), however, samples have been small and negative findings have been reported as well (Versace et al., 2008). Also, the effect of other psychotropic medication on brain structure remains unclear. We previously reported that smaller total brain volume in BD patients may be attenuated by lithium, and not by antipsychotic medication use (Abramovic et al. 2016). Thus far, few studies reported on the role of psychotropic medication on white matter measurements. To our knowledge, there is only one study showing a lower connectivity in parietal and occipital cortices following antipsychotic treatment (Szeszko et al., 2014). Considering that more than half of patients with BD are prescribed antipsychotic medication (Kessing et al., 2016), the relation of these drugs with white matter microstructure is warranted. A secondary advantage is that such studies may inform on schizophrenia patients as well, where such studies cannot be performed as the number of patients who are not on antipsychotics is usually too small.
A second topic of interest in the context of white matter microstructure is the potential relationship with IQ as both IQ and white matter volume contribute to the clinical phenotype of bipolar disorder (Forcada et al., 2011). Studies in controls have shown that intelligence is positively related to connectivity in the fiber tracts connecting frontal and parietal areas (Schmithorst et al., 2005). In addition, connectivity in the splenium and left-side inferior longitudinal and arcuate fasciculi predicted level of intelligence (Clayden et al., 2011; Barbey et al., 2013; Gläscher et al., 2010; Schmithorst et al., 2005; Navas-Sánchez et al. 2014). BD has been associated with lower intelligence (Trotta et al., 2015; Frangou et al., 2005; Vreeker et al., 2016). Therefore, we set out to investigate whether white matter deficits we may find in BD are associated with IQ.
We use diffusion tensor images to estimate fractional anisotropy (FA) and mean diffusivity (MD) in white matter tracts on a voxel level. FA is a measure for directional diffusion, which is an indication of the distribution of water molecules in the cellular compartments. Because water is more restricted in white matter due to the myelin sheets, FA is usually higher in intact white matter tracts than in grey matter, cerebrospinal fluid or disrupted fibers. MD reflects the average rate of water diffusion, which is usually higher in damaged tissue (Madden et al., 2012). As tissue damage often leads to more free diffusion and less restriction, lower FA is often (but not always) related to higher MD.
The aim of the current study is to investigate differences in white matter microstructure between BD patients and controls and whether they are related to lithium and antipsychotic treatment and IQ. Based on previous studies suggesting abnormalities in the white matter microstructure in patients with bipolar disorder, we expected to find widespread decreases in FA and increases in MD in white matter tracts of patients compared to control subjects. Also, we expected to find less profound deviations in FA in patients on lithium compared to non-using patients.
2. Experimental procedures
Participants
In this cross-sectional study, 262 patients with BD type I and 169 control subjects participated. Control subjects did not have BD, schizophrenia or any other psychotic disorder, nor had their first-degree relatives. Inclusion criteria for all participants were: a minimum age of 18 years old, at least three Dutch-born grandparents, and a good understanding of Dutch language. Subjects with a history of head trauma or a neurological illness were excluded.
The current sample is a subsample of a larger cohort, which was recruited at the University Medical Center Utrecht (UMCU), the Netherlands, as part of a collaboration between the University of California Los Angeles (UCLA) and several Dutch health care institutes. The cohort investigates genetic and phenotypic information of patients with bipolar disorder type I, first-degree relatives and controls. All scans were performed at the same scanner located in the University Medical Center Utrecht. Subjects were scanned between June 2011 and July 2014. The diagnoses of patients were confirmed with the Structured Clinical Interview for DSM-IV (SCID; First et al., 1997). Also, the Questionnaire for Bipolar Illness (QBP-NL; Dutch translation by Akkerhuis, et al., 1997; an adaption of the Enrolment Questionnaire as previously used in the Stanley Foundation Bipolar Network by Leverich et al., 2001; Suppes et al., 2001) was used. Mood status was assessed at inclusion through self-report using the 30-item Inventory of Depressive Symptoms-Self Report (IDS-SR30 ; Rush et al., 1996) and the Altman Self-Rating Mania Scale (ASRM; Altman et al., 1997). Mean and standard deviation of these measures were added to Table 1. We measured substance abuse in patients using the CIDI, while it was assessed in controls with the MINI. None of the subjects was admitted at the moment of assessment. Control subjects were screened for psychiatric diagnoses using the M.I.N.I. (Mini International Neuropsychiatric Interview; Sheehan et al., 1998). Interviews were conducted by at least one well-trained independent rater.
Table 1.
Demographical and clinical information of patients with bipolar disorder (N=257) and controls (N=167).
| Demographics | Bipolar patients (N = 257) |
Control subjects (N = 167) |
t-test/χ2 (p-value) |
|---|---|---|---|
| Age in years, mean (s.d.) | 48.2 (12.3) | 45.1 (14.9) | 0.03 |
| Sex, M/F (% male) | 125/132 (48.6%) | 84/83 (50.3%) | 0.77 |
| Handedness, R/L/B (% right) a | 224/24/8 (87.5%) | 140/21/5 (84.3%) | 0.57 |
| Premorbid IQ, mean (s.d.) | 107.5 (9.2) | 107.5 (9.2) | 0.89 |
| Current IQ, mean (s.d.) | 99.3 (14.0) | 107.9 (16.6) | <0.001 |
| Number of episodes, median | |||
| Mania | 4 | ||
| Depression | 5 | ||
| Mood status at inclusion | |||
| Manic symptoms (ASRM), mean (s.d.) | 2.6 (2.9) | ||
| Depressive symptoms (IDS-SR30), mean (s.d.) | 16.6 (11.4) | ||
| Medicationb, N (% on): | |||
| Lithium | 169 (65.8%) | ||
| Antipsychotic medication | 108 (42.0%) | ||
| Typical antipsychotic medicationc | 9 | ||
| Atypical antipsychotic medicationc | 100 |
Handedness was missing for 1 patient and 1 control
at time of scanning
one subject used typical and atypical antipsychotic medication
Four subtests of the Dutch version of the WAIS-III (Wechsler D., 1997) were used to estimate current IQ, being Digit Symbol Coding (processing speed), Block Design (visuospatial capacities), Arithmetic (working memory) and Information (general knowledge). The combination of these four subtests has been shown to reliably estimate IQ in schizophrenia patients (R2=0.90) and controls (R2=0.86) (Blyler et al. 2000). We have also performed the DART, which is the Dutch version of the National Adult Reading Test (Schmand et al., 1991), as an estimation for premorbid IQ. This data was available for 210 patients and 151 controls. Written informed consent was obtained from all participants. The Humans Ethics Committee of the UMCU and the UCLA Human Subjects review board approved the study.
Image acquisition
Three-dimensional T1-weighted images were acquired on a 3 Tesla Philips Achieva scanner (Philips Healthcare, Best, the Netherlands), equipped with an 8-channel SENSE headcoil. Fast field echo scans with 200 contiguous sagittal slices (TE=4.6 ms, TR=10 ms, flip angle=8°, FOV=240 mm, 0.75 × 0.75 × 0.80 mm3 voxels) were obtained. In addition, two sets of 30 diffusion-weighted imaging (b-weighting 1000 s/m2) scans were acquired and five diffusion unweighted scans (TE/TR 7035/68 ms; FOV=240mm, 2 mm isotropic voxel size; 75 slices at 2 mm thickness, no gap).
An independent radiologist evaluated the brain scans of all subjects and those with clinical outcomes were excluded from the analysis. Processing was done on the neuroimaging computer network of the University Medical Center Utrecht – Brain Center Rudolf Magnus, Utrecht, the Netherlands.
Preprocessing
Using the diffusion-weighted imaging data, fractional anisotropy (FA) and Mean Diffusivity (MD) of the tensor were determined as estimates of white matter microstructure.
All DWI images were pre-processed using FSL’s FMRIB’s Diffusion Toolbox. First, with Topup the images were realigned and corrected for possible susceptibility distortions using two non-diffusion weighted (b-value=0) images with opposite phase-encoding directions. Second, Eddy correction was used to correct for eddy-current distortions and possible head movements. Then, the Brain Extraction Tool (BET) was used to exclude all non-brain tissue (Smith, 2002). The diffusion tensor model was then fitted to each voxel using dtifit. Quality control was performed by visual inspection of the raw DTI and FA images.
Tract Based Spatial Statistics (TBSS)
We performed group comparisons solely on the white matter skeleton, in order to minimize the chance that results are driven by partial volume effects or confounded by morphological differences, and to increases the statistical power of the analysis.
Voxelwise statistical analysis of the FA data was carried out using TBSS (Tract-Based Spatial Statistics; Smith et al., 2006), part of FSL (Smith et al., 2004; http://www.fmrib.ox.ac.uk/fsl). First, FA images were created by fitting a tensor model to the raw diffusion data using FDT, and then brain-extracted using BET. All subjects’ FA data were then aligned into a common space using the nonlinear registration tool FNIRT (Andersson 2007a, 2007b), which uses a b-spline representation of the registration warp field (Rueckert 1999). Next, the mean FA image was created and thinned to create a mean FA skeleton which represents the centers of all tracts common to the group. This white matter skeleton was thresholded at FA=0.2 to exclude nonwhite matter and voxels in extremities where there is too much cross-subject variability in alignment. Each subject’s aligned FA data was then projected onto this white matter skeleton, and the maximum FA value is searched along the normals to the skeleton and dragged onto the skeleton for group-level comparisons.
To investigate how MD varies between groups, the original nonlinear registration was applied to the MD data, and the warped MD data was projected onto the original mean FA skeleton.
Statistical analyses
Demographic and clinical variables
Data were examined for normality of the distribution, outliers and extreme values. Demographic and clinical variables were compared for the different group comparisons described below, using Student’s t tests and χ2-tests as appropriate.
We compared patients with bipolar disorder and control subjects on age, gender distribution, handedness and IQ. In addition, in separate analyses we compared patients on and off lithium, and patients on and off antipsychotic medication on number of episodes, history of psychotic episodes (yes/no), and age at onset. Age at illness onset is defined as the age of first manic or depressive episode. The sample largely overlapped with the samples described in Abramovic et al (2016) and Vreeker et al. (2017), except for 9 patients and 4 controls for whom the DTI scans were not obtained.
FA and MD differences between groups
First, we investigated the correlation between white matter microstructure and diagnosis, by comparing patients with BD and control subjects on FA and MD in each voxel. Secondly, we investigated the role of lithium and antipsychotic medication intake by performing two separate group analyses: 1) by splitting up the patients with bipolar disorder into two subgroups, depending on current lithium use or not, and compare FA and MD betweenpatients on (Li+) and off lithium (Li−) and 2) by splitting up the patients with bipolar disorder into two subgroups, depending on current antipsychotic use or not, and compare FA and MD between patients on (AP+) and off antipsychotic medication (AP−). Also, each medication group was compared with controls. Third, we investigate the role of IQ in the comparison between BD patients and controls.
A general linear model was used to test differences between groups (BP vs HC; Li+ vs Li−, AP+ vs AP−) in FA and MD, with age and gender as covariates. To investigate the effect of IQ in the comparison between patients and controls, IQ and group-by-IQ interaction were added. The analyses were imbedded in Randomise, which is a tool for permutation-based non-parametric testing. Threshold-free cluster enhancement (TFCE) was applied to a permutation analysis. TFCE is a method for enhancing cluster-wise structures corrected for multiple testing, while the image remains voxelwise. A p-value is calculated for each voxel, corrected with family-wise error (FWE) correction via permutation testing with 5000 random permutations. The TFCE corrected p-maps were thresholded at pFWE<0.05 and only the clusters above this threshold are reported. The anatomical regions of these clusters were identified using the ‘JHU ICBM-DTI-81 White-Matter Labels’ atlas.
3. Results
Demographic and clinical variables
No significant differences were found between patients and controls on gender and handedness distribution. BD patients were slightly, but significantly, older than controls, i.e. 3.1 years (p=0.03). The majority of patients used lithium (65.8%) and 42.0% used antipsychotic medication at the time of scanning. Nine patient used typical antipsychotic medication, and among these nine patients one patient also used atypical antipsychotic medication.
As expected, current IQ was significantly lower in patients than in controls (Vreeker et al., 2016). Patients on lithium had significantly lower IQ than patients who were not on lithium (p=0.04). Patients on antipsychotics were significantly younger than patients who were not on antipsychotics (p=0.01). For further demographic and clinical information, see Table 1 and Table 2.
Table 2.
Demographical and clinical information of patients with bipolar disorder using lithium (Li+) and lithium-free (Li−) and patients using antipsychotic medication (AP+) versus patients not using antipsychotics (AP−). Significant differences were depicted in bold.
| Demographics | Li− (N = 88) | Li+ (N = 169) | p-value | AP+ (N = 108) | AP− (N = 132) | p-value |
|---|---|---|---|---|---|---|
| Age in years (s.d.) [range] | 49.7 (11.98) | 47.4 (12.5) | 0.15 | 45.8 (11.2) | 49.8 (12.9) | 0.01 |
| Sex, M/F (% male) | 42/46 (47.3%) | 83/86 [20–79] | 0.83 | 50/58 [21–67]b | 68/64 [20–79]b | 0.42 |
| Handedness, R/L/B (% right) | 76/9/3 (86.8%) | 148/15/5 (49.7%) | 0.92 | (46.5%) 91/12/4 | (52.2%) 117/12/3 | 0.68 |
| Premorbid IQ, mean (s.d.) | 107.5 (8.4) | 107.7 (9.3) (86.3%)a | 0.80 | (85.8%) 106.6 (9.6) | 108.3 (8.5) | 0.19 |
| Current IQ, mean (s.d.) | 102.4 (13.1) | 98.4 (13.6) | 0.04 | 99.6 (13.9) | 99.6 (12.7) | 0.98 |
| Medication, N (% on): | ||||||
| Lithium | – | – | 68 (63.0%) | 95 (72.0%) | 0.14 | |
| Antipsychotic medication | 40 (51.9%) | 68 (41.7%) | 0.14 | – | – | – |
FA and MD differences between groups
Global
See Figure 1 for mean FA and MD for the different groups. Mean FA was significantly lower and mean MD was significantly higher in patients than in controls (respectively, F(1,421)=12.50, p<0.001; F(1,421)=10.61, p=0.001). Mean FA was significantly higher and mean MD was significantly lower in Li+ patients relative to Li− patients (respectively, F(1,253)=13.34, p<0.001; F(1,253)=16.06, p<0.001). Mean FA did not differ significantly between patients on and off AP (F(1,236)=3.33, p=0.07), but mean MD was significantly higher in AP+ patients than in AP− patients (F(1,236)=5.94, p=0.02).
Figure 1.
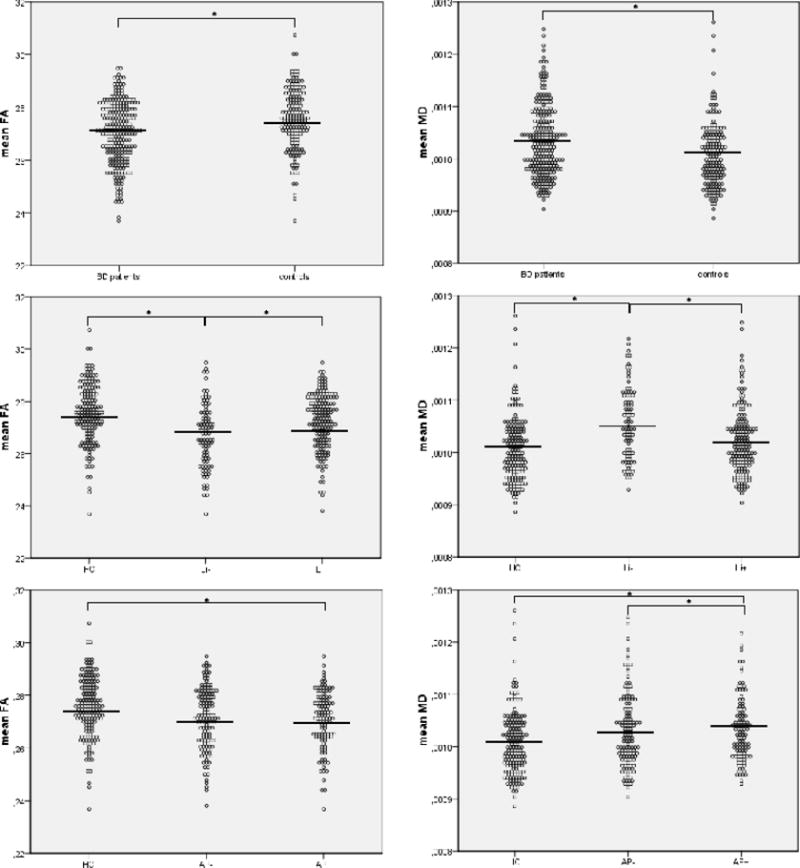
Comparison of mean FA and mean MD in Li- (N=88) and Li+ (N=169) patients with bipolar disorder versus controls (N=107). and AP− (N=132) and AP+ (N=108) patients with bipolar disorder versus controls. Corrected means are shown.
Local
BD patients had significantly lower FA than controls in the corpus callosum, fornix, external capsule, cerebral peduncle, sagital stratum, superior corona radiata and posterior thalamic radiation (see Figure 2a). There were no areas where controls showed lower FA than patients with BD.
Figure 2.
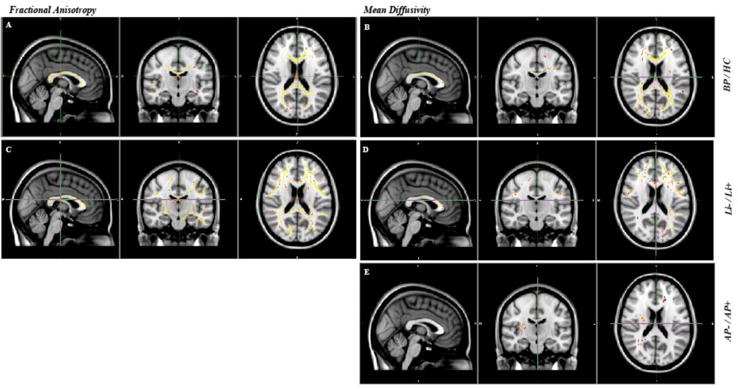
A) Lower FA in patients with BP (N=257) compared with controls (N=167). B) Lower MD in controls than in patients with BP. Age and gender have been added to the analyses as covariates. C) Lower FA in Li− patients compared with Li+ patients. D) Lower MD in Li+ patients compared with Li- patients. E) Higher MD in AP+ patients compared with AP− patients.
Age and gender have been added to the analyses as covariates. Results are FWE-corrected and projected on a red-yellow color scale for which the range is shown for (red) p<0.05.
Patients showed significantly higher MD than controls in the corpus callosum, anterior and superior corona radiate, posterior thalamic radiation, and superior longitudinal fasiculus. The local pattern of higher MD largely overlapped with the tracts that had lower FA in patients (see Figure 2b). There were no areas where patients showed lower MD than controls.
Lithium
Li− patients showed significant lower FA values than Li+ patients in the corpus callosum, fornix, and the major and minor forceps. There were no areas of lower FA in patient on versus off lithium (see Figure 2c). MD showed an opposite, although less pronounced effect in similar areas, where MD was higher in Li− than in Li+ patients. There were no areas where MD was higher in Li+ than in Li− patients (see Figure 2d).
Antipsychotics
There were no significant differences in FA between patients on and off antipsychotic medication. There were a few significant voxels spread throughout the brain where AP+ patients showed significantly higher MD than AP− patients (see Figure 2e). There were no areas with higher MD in AP− than AP+ patients.
See supplemental data for a comparison between both medication based patient groups and controls.
Association between IQ and white matter microstructure
There was a significant positive correlation between IQ and mean FA (r(360)=0.21, p<0.001) and a significant negative correlation between IQ and mean MD (r (360)=−0.14, p<0.01) in the combined group of patients and controls. Also, voxelwise, there were significant positive correlations between IQ and FA and negative correlations between IQ and MD (see Figure 3 and suppl. 3). Positive correlations between FA and IQ were found in the cingulum, fornix, external capsula, posterior thalamic radiation and uncinate fasiculus. Negative correlations between MD and IQ were found in the corpus callosum, superior and posterior corona radiate, left sagittal striatum, bilateral posterior limb of the internal capsule and superior longitudinal fasiculus.
Figure 3.
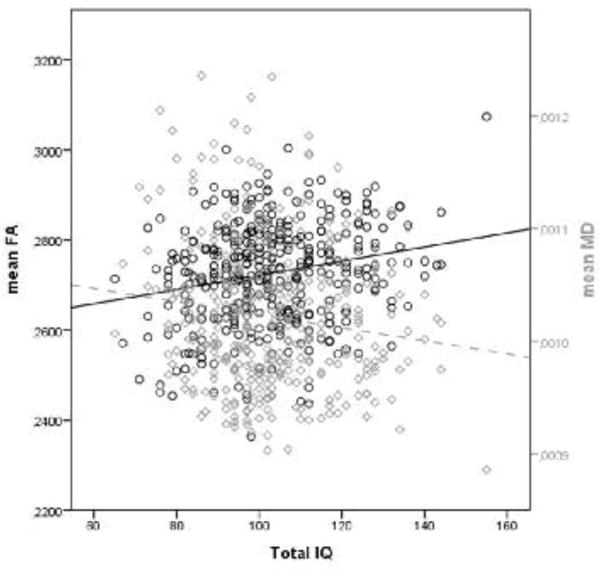
The correlation between mean FA and mean MD, and IQ in the combined group of patients and controls.
There were no significant group-by-IQ interactions for mean and local FA and MD, implicating that the correlations of FA and MD with IQ did not differ significantly between BD patients and controls.
4. Discussion
In the largest single-site sample of patients with BD type I and controls we investigated the association of white matter microstructure with IQ and psychotropic medication.
In addition to the confirmation of substantial white matter differences in bipolar disorder two findings stand out. First, we found association of FA and MD within BD patients consistent with a ‘normalizing’ or ‘protective’ effect of lithium on white matter microstructure in BD patients, similar to what has been reported for brain volume (Hafeman et al., 2012; Abramovic et al., 2016). In contrast, patients on antipsychotics showed slightly higher MD as compared to those without, while FA showed no differences between groups, implicating that the effects of antipsychotics are subtle relative to those of lithium. A second finding of note is the small positive correlations between IQ and mean and local FA and negative correlations with mean and local MD in the total sample, which did not differ significantly between patients and controls.
In a review of the literature, Bellani and colleagues (2009) summarized the evidence for white matter disruptions (estimated from diffusion tensor imaging [DTI]) in patients with BD, and provided suggestive evidence for a link with cognitive and emotional deficits. More recently, a meta-analysis showed a significant decrease in FA in the genu of the corpus callosum, left cingulum, and right anterior superior longitudinal fasciculus as compared with controls (Wise et al., 2016). In addition, MD is shown to increase in the anterior part and the corpus of the CC in patients (Bruno et al., 2008; Bellani et al., 2009, 2016). Based on these findings, abnormalities in FA and MD in BD appear widespread, affecting many white matter tracts.
The differences we report between BD patients and controls are most pronounced in the corpus callosum and in clusters widespread across the brain. Findings in the corpsus callosum are in line with current literature of evidence for altered white matter microstructure in fibers connecting the two hemispheres (Wise et al, 2016; Bellani et al., 2009, 2016). The widespread deviations suggest deficits of neural connectivity in multiple networks. Recently, a study on the brains’ network architecture in this same cohort, showed reduced global efficiency in association with disruptions in interhemispheric connectivity, while the central brain hubs were not affected (Collins et al., 2016). Consequently, simple correlations between regions of interest and specific clinical variables may be less informative than linking these variables to networks of brain measures.
The relevance of the findings in the corpus callosum are supported by previous reports that the white matter microstructure in the corpus callosum is associated with cognitive performance (Poletti et al., 2015; Ajilore et al., 2015). The pattern of significant correlations of IQ with FA and MD in the corpus callosum that we here report is also in line with the study from Navas-Sanchez and colleagues (2014), who reported a positive correlation between IQ and FA in the CC in healthy subjects. Of note is that across the whole sample, global and local FA and MD were, respectively positively and negatively correlated to level of IQ. This may not be surprising as data from healthy twins and their siblings suggest a common genetic origin between callosal white matter connectivity and intelligence (Hulshoff Pol et al., 2006).
An important finding is the evidence that lithium possibly attenuates decreases in FA, which suggests that lithium masks illness-related FA decreases. Higher MD in patients without lithium versus those on lithium could result from a direct effect of lithium on water diffusion, as MD measures the restriction of water diffusion and lithium is an important electrolyte. Lithium is also known to affect neurotransmission via several second messenger systems, thereby modifying gene transcription within the cells. It inhibits Glycogen Synthase Kinase 3 Beta (GSK-3β), which is shown to be overactive in BD patients (Muneer, 2017; Luykx et al., 2010). GSK-3β plays a role in gene transcription, synaptic plasticity and cell structure (Mahli et al., 2013). Interestingly rodent studies have shown re-myelinisation after GSK-3β inhibition (Azim and Butt, 2011; Chen et al., 2016), suggesting that lithium may affect white matter microstructure via inhibiting GSK-3β (Hunsberger et al., 2009).
In contrast to the large differences in white matter microstructure related to lithium, the differences related to antipsychotic medication were limited. Bipolar disorder patients on antipsychotics showed higher MD, and no differences on FA, in several small areas scattered across the white matter. In a review of the literature, Hafeman and colleagues (2012) reported that most studies show no significant effect of antipsychotic medication status on brain measures. However, the current study is about 5 times larger than the largest study to date, implicating that the effect of AP on white matter microstructure is subtle, and less pronounced than the effect of lithium.
In addition to the cross-sectional design of the study several limitations should be considered. First, it was not possible to take duration of medication use and medication dosages into account, nor was it feasible to include medication naïve patients. Second, patients on lithium have a slightly lower IQ than patients off lithium. However, because we did not find a significant group-by-IQ interaction it is unlikely that IQ explains the higher FA and lower MD in patients on lithium. In addition, it might be that patients who were lithium free at time of study inclusion used lithium in the past. However, in that event this would not lead to type I error as we would underestimate the effect of lithium in FA and MD, as animal studies have shown that lithium effects on the brain are not reversible (Vernon et al., 2013).
In conclusion, this study presents evidence for widespread abnormalities in patients with bipolar disorder, suggesting affected neural connectivity in multiple networks. The reported white matter abnormalities may be attenuated by lithium use, while antipsychotic medication showed a more subtle effect. It is unlikely that these abnormalities white matter microstructure explain the lower IQ reported in bipolar disorder patients.To disentangle the underlying mechanisms of BD it is of relevance to further study the clinical and functional relevance of white matter abnormalities, and particularly longitudinal studies are of value to evaluate the effects of different treatments over time and inform of the underlying causality.
Supplementary Material
Acknowledgments
We thank the study participants and also Amke Edomskis, Karlijn Schols, Michiel Flik, Juliana Schott, Bart Duin for their help with the data collection.
Role of the Funding Source
This study was supported by NIMH grant number: R01 MH090553 (to RAO). The NIMH had no further role in study design, in the collection, analysis and interpretation of the data, in the writing of the report, and in the decision to submit the paper for publication. The authors of this paper do not have any commercial associations that might pose a conflict of interest in connection with this manuscript.
Footnotes
Publisher's Disclaimer: This is a PDF file of an unedited manuscript that has been accepted for publication. As a service to our customers we are providing this early version of the manuscript. The manuscript will undergo copyediting, typesetting, and review of the resulting proof before it is published in its final citable form. Please note that during the production process errors may be discovered which could affect the content, and all legal disclaimers that apply to the journal pertain.
Conflict of Interest
The authors confirm that there are no known conflicts of interest associated with this publication and there has been no significant financial support for this work that could have influenced its outcome
Contributors
Lucija Abramovic wrote the manuscript and performed the statistical analyses. Marco Boks provided consultation and support on statistical methods, and assisted with manuscript edits. Annabel Vreeker, Sanne Verkooijen and Annet van Bergen assisted with data collection. Roel Ophoff and René Kahn served as senior authors and assisted with study design. Neeltje van Haren provided consultation, supervised the analyses and worked with Lucija Abramovic on subsequent manuscript drafts. All authors contributed to and have approved the final manuscript.
References
- Abramovic L, Boks MP, Vreeker A, Bouter DC, Kruiper C, Verkooijen S, van Bergen AH, Ophoff RA, Kahn RS, van Haren NEM. The association of antipsychotic medication and lithium with brain measures in patients with bipolar disorder. European Neuropsychopharmacology. 2016;26:1741–1751. doi: 10.1016/j.euroneuro.2016.09.371. [DOI] [PubMed] [Google Scholar]
- Ajilore O, Vizueta N, Walshaw P, Zhan L, Leow A, Altshuler LL. Connectome signatures of neurocognitive abnormalities in euthymic bipolar I disorder. Journal of Psychiatric Research. 2015;68:37–44. doi: 10.1016/j.jpsychires.2015.05.017. [DOI] [PMC free article] [PubMed] [Google Scholar]
- Andersson JL, Jenkinson M, Smith S. Non-linear optimisation FMRIB technical report TR07JA1. 2007a from www.fmrib.ox.ac.uk/analysis/techrep.
- Andersson JL, Jenkinson M, Smith S. Non-linear registration, aka Spatial normalisation FMRIB technical report TR07JA2 FMRIB Analysis Group of the University of Oxford. 2007b:2. [Google Scholar]
- Azim K, Butt AM. GSK3β negatively regulates oligodendrocyte differentiation and myelination in vivo. Glia. 2011;59:540–553. doi: 10.1002/glia.21122. [DOI] [PubMed] [Google Scholar]
- Bearden CE, Thompson PM, Dalwani M, et al. Greater Cortical Gray Matter Density in Lithium-Treated Patients with Bipolar Disorder. Biological psychiatry. 2007;62:7–16. doi: 10.1016/j.biopsych.2006.10.027. [DOI] [PMC free article] [PubMed] [Google Scholar]
- Barbey AK, Colom R, Grafman J. Dorsolateral prefrontal contributions to human intelligence. Neuropsychologia. 2013;51:1361–1369. doi: 10.1016/j.neuropsychologia.2012.05.017. [DOI] [PMC free article] [PubMed] [Google Scholar]
- Bellani M, Boschello F, Delvecchio G, Dusi N, Altamura CA, Ruggeri M, Brambilla P. DTI and myelin plasticity in bipolar disorder: integrating neuroimaging and neuropathological findings. Frontiers in psychiatry. 2016:7. doi: 10.3389/fpsyt.2016.00021. [DOI] [PMC free article] [PubMed] [Google Scholar]
- Bellani M, Yeh PH, Tansella M, Balestrieri M, Soares JC, Brambilla P. DTI studies of corpus callosum in bipolar disorder. Biochemical Society Transactions. 2009;37 doi: 10.1042/BST0371096. [DOI] [PubMed] [Google Scholar]
- Benedetti F, Bollettini I. Recent findings on the role of white matter pathology in bipolar disorder. Harvard review of psychiatry. 2014;22:338–341. doi: 10.1097/HRP.0000000000000007. [DOI] [PubMed] [Google Scholar]
- Blyler CR, Gold JM, Iannone VN, Buchanan RW. Short form of the WAIS-III for use with patients with schizophrenia. Schizophrenia research. 2000;46:209–215. doi: 10.1016/s0920-9964(00)00017-7. [DOI] [PubMed] [Google Scholar]
- Bruno S, Cercignani M, Ron MA. White matter abnormalities in bipolar disorder: a voxel-based diffusion tensor imaging study. Bipolar disorders. 2008;10:460–468. doi: 10.1111/j.1399-5618.2007.00552.x. [DOI] [PMC free article] [PubMed] [Google Scholar]
- Chen Y, Weng J, Han D, Chen B, Ma M, Yu Y, Ming L, Zhongdi L, Peixun Z, Baoguo J. GSK3β inhibition accelerates axon debris clearance and new axon remyelination. American Journal of Translational Research. 2016;8:5410. [PMC free article] [PubMed] [Google Scholar]
- Clayden JD, Jentschke S, Muñoz M, Cooper JM, Chadwick MJ, Banks T, Clark CA, Vargha-Khadem F. Normative development of white matter tracts: similarities and differences in relation to age, gender, and intelligence. Cerebral Cortex. 2011:1738–1747. doi: 10.1093/cercor/bhr243. [DOI] [PubMed] [Google Scholar]
- Collin G, van den Heuvel MP, Abramovic L, Vreeker A, de Reus MA, van Haren NEM, Boks MPM, Ophoff RA, Kahn RS. Brain network analysis reveals affected connectome structure in bipolar I disorder. Human Brain Mapping. 2016;37:122–134. doi: 10.1002/hbm.23017. [DOI] [PMC free article] [PubMed] [Google Scholar]
- Ewing-Cobbs L, Hasan KM, Prasad MR, Kramer L, Bachevalier J. Corpus callosum diffusion anisotropy correlates with neuropsychological outcomes in twins disconcordant for traumatic brain injury. American Journal of Neuroradiology. 2006;27:879–881. [PMC free article] [PubMed] [Google Scholar]
- Forcada I, Papachristou E, Mur M, Christodoulou T, Jogia J, Reichenberg A, Vieta E, Frangou S. The impact of general intellectual ability and white matter volume on the functional outcome of patients with Bipolar Disorder and their relatives. Journal of Affective Disorders. 2011;130:413–420. doi: 10.1016/j.jad.2010.10.048. [DOI] [PubMed] [Google Scholar]
- First MBF, Spitzer RL, Gibbon M, Williams JBW. Structured Clinical Interview for DSM-IV-TR Axis I Disorders, Research Version, Patient Edition. (SCID-I/P) New York: 2002. [Google Scholar]
- Frangou S, Donaldson S, Hadjulis M, Landau S, Goldstein LH. The Maudsley Bipolar Disorder Project: executive dysfunction in bipolar disorder I and its clinical correlates. Biological psychiatry. 2005;58:859–864. doi: 10.1016/j.biopsych.2005.04.056. [DOI] [PubMed] [Google Scholar]
- Germaná C, Kempton MJ, Sarnicola A, Christodoulou T, Haldane M, Hadjulis M, Girardi P, Tatarelli R, Frangou S. The effects of lithium and anticonvulsants on brain structure in bipolar disorder. Acta Psychiatr Scand. 2010;122:481–487. doi: 10.1111/j.1600-0447.2010.01582.x. [DOI] [PubMed] [Google Scholar]
- Gläscher J, Rudrauf D, Colom R, Paul LK, Tranel D, Damasio H, Adolphs R. Distributed neural system for general intelligence revealed by lesion mapping. Proceedings of the National Academy of Sciences. 2010;107:4705–4709. doi: 10.1073/pnas.0910397107. [DOI] [PMC free article] [PubMed] [Google Scholar]
- Haarman BCM, Riemersma–Van der Lek RF, Burger H, de Groot JC, Drexhage HA, Nolen WA, Cerliani L. Diffusion tensor imaging in euthymic bipolar disorder–A tract-based spatial statistics study. Journal of Affective Disorders. 2016;203:281–291. doi: 10.1016/j.jad.2016.05.040. [DOI] [PubMed] [Google Scholar]
- Hafeman DM, Chang KD, Garrett AS, Sanders EM, Phillips ML. Effects of medication on neuroimaging findings in bipolar disorder: An updated review. Bipolar Disord. 2012;14:375–410. doi: 10.1111/j.1399-5618.2012.01023.x. [DOI] [PubMed] [Google Scholar]
- Hibar DP, Westlye LT, Doan NT, Jahanshad N, Cheung JW, Ching CRK, Versace A, Bilderbeck AC. Cortical abnormalities in bipolar disorder: an MRI analysis of 6503 individuals from the ENIGMA Bipolar Disorder Working Group. Mol Psychiatry. 2017:1–11. doi: 10.1038/mp.2017.73. [DOI] [PMC free article] [PubMed] [Google Scholar]
- Hulshoff Pol HEH, Schnack HG, Posthuma D, Mandl RC, Baare WF, van Oel C, van Haren NEM, Collins DL, Evans AC, Amunts K, Bürgel U, Zilles K, de Geus E, Boomsma DI, Kahn RS. Genetic contributions to human brain morphology and intelligence. Journal of Neuroscience. 2006;26:10235–10242. doi: 10.1523/JNEUROSCI.1312-06.2006. [DOI] [PMC free article] [PubMed] [Google Scholar]
- Hunsberger J, Austin DR, Henter ID, Chen G. The neurotrophic and neuroprotective effects of psychotropic agents. Dialogues in clinical neuroscience. 2009;11:333. doi: 10.31887/DCNS.2009.11.3/jhunsberger. [DOI] [PMC free article] [PubMed] [Google Scholar]
- Kessing LV, Vradi E, Andersen PK. Nationwide and population-based prescription patterns in bipolar disorder. Bipolar disorders. 2016;18:174–182. doi: 10.1111/bdi.12371. [DOI] [PubMed] [Google Scholar]
- Kontis D, Catani M, Cuddy M, Walshe M, Nosarti C, Jones D, Wyatt J, Rifkin K, Murray R, Allin M. Diffusion tensor MRI of the corpus callosum and cognitive function in adults born preterm. Neuroreport. 2009;20:424–428. doi: 10.1097/WNR.0b013e328325a8f9. [DOI] [PubMed] [Google Scholar]
- Leverich GS, Nolen WA, Rush AJ, McElroy SL, Keck PE, Denicoff KD, Suppes T, Altshuler LL, Kupka R, Kramlinger KG, Post RM. The Stanley Foundation Bipolar Treatment Outcome Network: I. Longitudinal methodology. J Affect Disord. 2001;67:33–44. doi: 10.1016/s0165-0327(01)00430-x. [DOI] [PubMed] [Google Scholar]
- Luykx JJ, Boks MP, Terwindt AP, Bakker S, Kahn RS, Ophoff RA. The involvement of GSK3beta in bipolar disorder: integrating evidence from multiple types of genetic studies. European Neuropsychopharmacology. 2010;20:357–368. doi: 10.1016/j.euroneuro.2010.02.008. [DOI] [PubMed] [Google Scholar]
- Madden DJ, Bennett IJ, Burzynska A, Potter GG, Chen NK, Song AW. Diffusion tensor imaging of cerebral white matter integrity in cognitive aging. Biochimica et Biophysica Acta (BBA)-Molecular Basis of Disease. 2012;1822:386–400. doi: 10.1016/j.bbadis.2011.08.003. [DOI] [PMC free article] [PubMed] [Google Scholar]
- Malhi GS, Tanious M, Das P, Coulston CM, Berk M. Potential mechanisms of action of lithium in bipolar disorder: Current understanding. CNS Drugs. 2013;27:135–153. doi: 10.1007/s40263-013-0039-0. [DOI] [PubMed] [Google Scholar]
- Muneer A. Wnt and GSK3 Signaling Pathways in Bipolar Disorder: Clinical and Therapeutic Implications. Clinical Psychopharmacology and Neuroscience. 2017;15:100. doi: 10.9758/cpn.2017.15.2.100. [DOI] [PMC free article] [PubMed] [Google Scholar]
- Navas-Sánchez FJ, Alemán-Gómez Y, Sánchez-Gonzalez J, Guzmán-De-Villoria JA, Franco C, Robles O, Arango C, Desco M. White matter microstructure correlates of mathematical giftedness and intelligence quotient. Human brain mapping. 2014;35:2619–2631. doi: 10.1002/hbm.22355. [DOI] [PMC free article] [PubMed] [Google Scholar]
- O’Donoghue S, Holleran L, Cannon DM, McDonald C. Anatomical dysconnectivity in bipolar disorder compared with schizophrenia: A selective review of structural network analyses using diffusion MRI. Journal of Affective Disorders. 2017;209:217–228. doi: 10.1016/j.jad.2016.11.015. [DOI] [PubMed] [Google Scholar]
- Poletti S, Bollettini I, Mazza E, Locatelli C, Radaelli D, Vai B, Smeraldi E, Colombo C, Benedetti F. Cognitive performances associate with measures of white matter integrity in bipolar disorder. Journal of affective disorders. 2015;174:342–352. doi: 10.1016/j.jad.2014.12.030. [DOI] [PubMed] [Google Scholar]
- Rueckert D, Sonoda LI, Hayes C, Hill DL, Leach MO, Hawkes DJ. Nonrigid registration using free-form deformations: application to breast MR images. IEEE transactions on medical imaging. 1999;18:712–721. doi: 10.1109/42.796284. [DOI] [PubMed] [Google Scholar]
- Schmand B, Bakker D, Saan R, Louman J. The Dutch Reading Test for Adults: a measure of premorbid intelligence level. Tijdschrift voor gerontologie en geriatrie. 1991;22:15–19. [PubMed] [Google Scholar]
- Schmithorst VJ, Wilke M, Dardzinski BJ, Holland SK. Cognitive functions correlate with white matter architecture in a normal pediatric population: a diffusion tensor MRI study. Human brain mapping. 2005;26:139–147. doi: 10.1002/hbm.20149. [DOI] [PMC free article] [PubMed] [Google Scholar]
- Sheehan DV, Lecrubier Y, Sheehan KH, Amorim P, Janavs J, Weiller E, Hergueta T, Baker R, Dunbar GC. The Mini-International Neuropsychiatric Interview (M.I.N.I.): The development and validation of a structured diagnostic psychiatric interview for DSM-IV and ICD-10. Journal of Clinical Psychiatry. 1998;59:22–33. [PubMed] [Google Scholar]
- Singh MK, Chang KD. The Neural Effects of Psychotropic Medications in Children and Adolescents. Child Adolesc Psychiatr Clin N Am. 2012;21:753–771. doi: 10.1016/j.chc.2012.07.010. [DOI] [PMC free article] [PubMed] [Google Scholar]
- Smith SM. Fast robust automated brain extraction. Human brain mapping. 2002;17:143–155. doi: 10.1002/hbm.10062. [DOI] [PMC free article] [PubMed] [Google Scholar]
- Smith SM, Jenkinson M, Johansen-Berg H, Rueckert D, Nichols TE, Mackay CE, et al. Tract-based spatial statistics: voxelwise analysis of multi-subject diffusion data. Neuroimage. 2006;31:1487–1505. doi: 10.1016/j.neuroimage.2006.02.024. [DOI] [PubMed] [Google Scholar]
- Smith SM, Jenkinson M, Woolrich MW, Beckmann CF, Behrens TE, Johansen-Berg H, Bannister PR, De Luca M, Drobnjak I, Flitney DE, Niazy RK, Saunders J, Vickers J, Zhang Y, De Stefano N, Brady JM, Matthews PM. Advances in functional and structural MR image analysis and implementation as FSL. Neuroimage. 2004;23:S208–S219. doi: 10.1016/j.neuroimage.2004.07.051. [DOI] [PubMed] [Google Scholar]
- Suppes T, Leverich GS, Keck PE, Nolen WA, Denicoff KD, Altshuler LL, McElroy SL, Rush AJ, Kupka R, Frye MA, Bickel M, Post RM. The Stanley Foundation Bipolar Treatment Outcome Network – II. Demographics and illness characteristics of the first 261 patients. J Affect Disord. 2001;67:45–59. doi: 10.1016/s0165-0327(01)00432-3. [DOI] [PubMed] [Google Scholar]
- Szeszko PR, Robinson DG, Ikuta T, Peters BD, Gallego JA, Kane J, Malhotra AK. White matter changes associated with antipsychotic treatment in first-episode psychosis. Neuropsychopharmacology. 2014;39:1324–1331. doi: 10.1038/npp.2013.288. [DOI] [PMC free article] [PubMed] [Google Scholar]
- Tamnes CK, Østby Y, Walhovd KB, Westlye LT, Due-Tønnessen P, Fjell AM. Intellectual abilities and white matter microstructure in development: a diffusion tensor imaging study. Human brain mapping. 2010;31:1609–1625. doi: 10.1002/hbm.20962. [DOI] [PMC free article] [PubMed] [Google Scholar]
- Trotta A, Murray RM, MacCabe JH. Do premorbid and post-onset cognitive functioning differ between schizophrenia and bipolar disorder? A systematic review and meta-analysis. Psychological medicine. 2015;45:381–394. doi: 10.1017/S0033291714001512. [DOI] [PubMed] [Google Scholar]
- Vernon AC, Hajek T. Effects of lithium on magnetic resonance imaging signal might not preclude increases in brain volume after chronic lithium treatment. Biol Psychiatry. 2013;74:e39–e40. doi: 10.1016/j.biopsych.2012.12.028. [DOI] [PubMed] [Google Scholar]
- Versace A, Almeida JR, Hassel S, Walsh ND, Novelli M, Klein CR, Kupfer DJ, Philips ML. Elevated left and reduced right orbitomedial prefrontal fractional anisotropy in adults with bipolar disorder revealed by tract-based spatial statistics. Archives of general psychiatry. 2008;65:1041–1052. doi: 10.1001/archpsyc.65.9.1041. [DOI] [PMC free article] [PubMed] [Google Scholar]
- Vreeker A, Abramovic L, Boks MPM, Verkooijen S, van Berger AH, Ophoff RA, Kahn RS, van Haren NEM. The relationship between brain volumes and intelligence in bipolar disorder. Journal of Affective Disorders. 2017;223:59–64. doi: 10.1016/j.jad.2017.07.009. [DOI] [PMC free article] [PubMed] [Google Scholar]
- Vreeker A, Boks MPM, Abramovic L, Verkooijen S, Van Bergen AH, Hillegers MHJ, Spijker AT, Hoencamp E, Regeer EJ, Riemersma-van der Lek RF, Stevens AWMM, Schulte PFJ, Vonk R, Hoekstra R, van Beveren NJM, Kupka RW, Brouwer RW, Bearden CE, MacCabe JH, Ophoff RA, GROUP investigators High educational performance is a distinctive feature of bipolar disorder: a study on cognition in bipolar disorder, schizophrenia patients, relatives and controls. Psychological medicine. 2016;46:807–818. doi: 10.1017/S0033291715002299. [DOI] [PMC free article] [PubMed] [Google Scholar]
- Walterfang M, Wood AG, Barton S, Velakoulis D, Chen J, Reutens DC, Kempton MJ, Haldane M, Pantelis C, Frangou S. Corpus callosum size and shape alterations in individuals with bipolar disorder and their first-degree relatives. Prog Neuropsychopharmacol Biol Psychiatry. 2009;33:1050–1057. doi: 10.1016/j.pnpbp.2009.05.019. [DOI] [PubMed] [Google Scholar]
- Wise T, Radua J, Nortje G, Cleare AJ, Young AH, Arnone D. Voxel-based meta-analytical evidence of structural disconnectivity in major depression and bipolar disorder. Biological psychiatry. 2016;79:293–302. doi: 10.1016/j.biopsych.2015.03.004. [DOI] [PubMed] [Google Scholar]
Associated Data
This section collects any data citations, data availability statements, or supplementary materials included in this article.