Abstract
Metallic medical devices such as intravascular stents can undergo fretting damage in vivo that might increase their susceptibility to pitting corrosion. As a result, the US Food and Drug Administration has recommended that such devices be evaluated for corrosion resistance after the devices have been fatigue tested in situations where significant micromotion can lead to fretting damage. Three common alloys that cardiovascular implants are made from [MP35N cobalt chromium (MP35N), electropolished nitinol (EP NiTi), and 316LVM stainless steel (316LVM)] were selected for this study. In order to evaluate the effect of wire fretting on the pitting corrosion susceptibility of these medical alloys, small and large fretting scar conditions of each alloy fretting against itself, and the other alloys in phosphate buffered saline (PBS) at 37°C were tested per ASTM F2129 and compared against as received or PBS immersed control specimens. Although the general trend observed was that fretting damage significantly lowered the rest potential (Er) of these specimens (p < 0.01), fretting damage had no significant effect on the breakdown potential (Eb, p > 0.05) and hence did not affect the susceptibility to pitting corrosion. In summary, our results demonstrate that fretting damage in PBS alone is not sufficient to cause increased susceptibility to pitting corrosion in the three common alloys investigated.
Keywords: fretting, corrosion, medical device
INTRODUCTION
Implanted medical devices, such as intravascular stents, made out of metallic alloys are often tested to evaluate their corrosion resistance. To increase a device’s resistance to corrosion, manufacturers may use surface treatment techniques to improve the oxide layer that naturally forms on these medical alloys. However, intravascular stents undergo both fretting and fatiguing conditions simultaneously in vivo, which could lead to damage of the protective oxide layer and hence increase susceptibility to pitting corrosion of these metallic devices.1 Specifically, this oxide layer can be damaged at points of contact between struts on one stent or on overlapping regions of multiple stents.1,2 Localized corrosion of these stents in vivo can result in metal ion dissolution and accumulation in the surrounding tissue which may trigger inflammatory reactions and lead to restenosis.3–5 Thus, the US Food and Drug Administration published a guidance document that had recommended corrosion testing be performed for intravascular stents that were subjected to fatigue and fretting testing.6 In a previous study examining the effect of fatigue on the susceptibility of pitting corrosion, wire samples of 316LVM stainless steel, MP35N cobalt chromium, and nitinol that underwent fatigue testing prior to testing for pitting corrosion susceptibility per ASTM F21297 were compared with control samples that did not undergo fatigue testing. Although evidence of crack formations were present along the surface of wire samples, corrosion testing revealed that fatigue did not alter the pitting corrosion susceptibility.8 Furthermore, it was shown that immersion time in phosphate buffered saline (PBS) was a driving factor behind significant differences in rest potential (Er), which was consistent with other findings. 9 Although one study demonstrated that the fretting and fatiguing of overlapped stents significantly increased their susceptibility to pitting corrosion,1 it is not clear whether the fretting damage alone contributed to the increased susceptibility or if it was due to the complexity of the stent geometry and simultaneous axial loading, both of which could have increased the chance for localized pitting corrosion to occur. Understanding the effect of fretting damage on pitting corrosion susceptibility is important as it is often observed on overlapped stents and braided devices post fatigue testing.10 Thus, the goal of this research was to determine whether fretting damage has a significant effect on the pitting corrosion susceptibility of metals commonly used to manufacture cardiovascular devices.
MATERIALS AND METHODS
Materials
Three common alloys that cardiovascular implants are constructed from were selected for this study: MP35N cobalt chromium (MP35N) per ASTM F562, electropolished nitinol (EP NiTi) per ASTM F2063, and 316LVM stainless steel (316LVM) per ASTM F138. Individual wire specimens (0.5 mm diameter) were obtained for ease of manipulation and inducing consistent wire fretting damage as compared to the use of stents or other devices due to their simple geometry. A single fretting region on a wire specimen was also easier to control and achieve as compared to stents where fretting damage and localized pitting corrosion can occur at multiple locations. Along with greater reproducibility, the wire geometry is expected to be representative of cardiovascular devices made from wire or laser cut from a tube.
Test plan
Wire samples were divided into control and specimen groups as shown below.
As received
Immersed in PBS as a soak control
Small fretting damage
Large fretting damage
Test conditions (1) and (2) served as control groups with condition 2 serving as a control to determine if immersion in PBS alone affects pitting corrosion susceptibility. Small (3) and large (4) fretting damage groups were tested to determine if pitting corrosion susceptibility was dependent on the amount of fretting damage with the small fretting damage being similar to what has been observed in vitro and in vivo1,2,10 and the large fretting case representing more extreme damage. For test conditions (3) and (4), each alloy studied was fretted (either small or large) against another wire of the same alloy or one of the other two alloys as shown in Table I. In total, there were 24 possible different testing conditions. However, the large fretting condition of EP NiTi against 316LVM could not be achieved because either the EP NiTi wire would fracture or the 316LVM wire would bend and plastically deform before sufficiently large fretting conditions could be achieved. Six samples for each test condition were used for a total of 138 wire specimens.
TABLE I.
Wire Fretting Depths Achieved for Different Material Combination and Fretting Sizes
| Fretted Wire vs. Rotating Wire | Maximum Depth of Fretting Scar (μm) | |
|---|---|---|
|
| ||
| Small | Large | |
| MP35N vs. MP35N | 20 ±5 | 104 ±9 |
| MP35N vs. EP NiTi | 49 ±26 | 139 ±32 |
| MP35N vs. 316LVM | 40 ±23 | 94 ±11 |
| EP NiTi vs. MP35N | 55 ±14 | 113 ±15 |
| EP NiTi vs. EP NiTi | 32 ±17 | 206 ±26 |
| EP NiTi vs. 316LVM | 29 ±13 | NA |
| 316LVM vs. MP35N | 105 ±23 | 164 ±18 |
| 316LVM vs. EP NiTi | 32 ±10 | 103± 18 |
| 316LVM vs. 316LVM | 30 ±3 | 130 ±13 |
Fretting testing
Stationary wire samples for test conditions (3) and (4) were held perpendicular to another straight wire that was rotating at 60 Hz in a 37°C PBS bath using modified Valley Instruments (Positool Instruments) wire fatigue testers for 250,000 cycles. Neither wire in the experimental setup underwent cyclic strain. Fretting damage was induced by clamping magnets and spacers around the stationary and rotating wires to continually apply an approximately constant force between them as shown in Figure 1. Magnets were coated with two layers of insulation coating (Miccrostop, Tolber Chemical, AK) to prevent any galvanic effects and corrosion of the magnets while submerged in PBS. Fretting scar depth was measured with an optical profilometer (Contour GT, Bruker). Small and large fretting scars along the stationary wire surfaces were achieved by varying the separation distance and size of the clamping magnets. Given the differences between materials, the fretting scar depth varied for the different material combinations as seen in Table I. In all cases, the amount of fretting damage between the small and large fretting conditions was ensured to be significantly different from each other (p < 0.01). Smaller fretting scars were defined as scars with an average depth < 100 μm while large fretting scars were defined as scars with an average depth > 100 μm. With the exception of 316LVM small fretted against MP35N (105 μm) and MP35N large fretted against 316LVM (94 μm), we were able to achieve these target depths. The small fretting scar depth is similar to what has been observed in stents that have undergone fatigue testing in vitro1 or on those that were explanted.2,10
FIGURE 1.
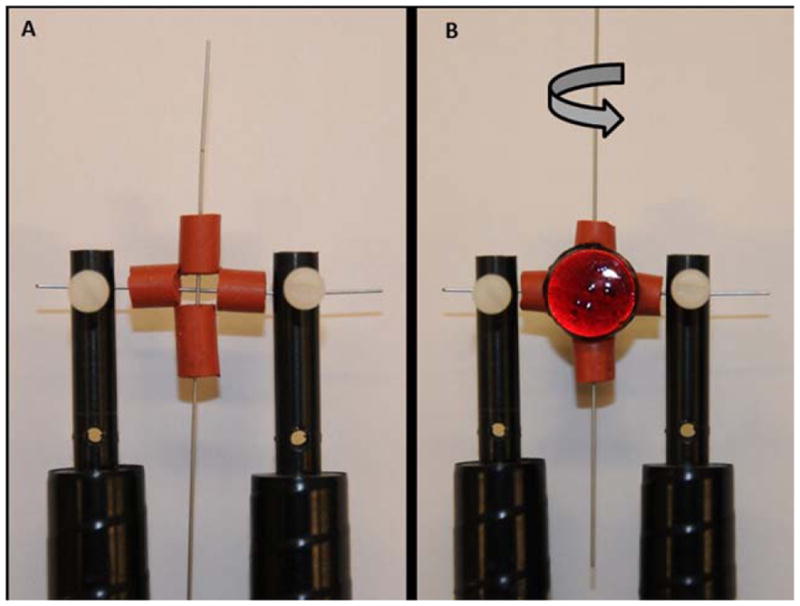
(A) Setup used to clamp wires perpendicular to each other using foam spacers for wire fretting. The longer, vertical wire was rotating with one end held in the wire fatigue tester chuck while the other end was free. Both ends of the stationary, horizontal wire were held fixed by wire holders. (B) Coated magnets were placed on both sides of the foam spacers to induce fretting damage in the stationary, horizontal wire specimen.
Corrosion testing
After undergoing one of the previously described testing conditions, 4.3 cm long wire specimens were cleaned with De-Ionized (DI) water and dried. Only stationary wire specimens were used for corrosion testing. Conductive silver paint (Fast Drying Silver Paint, Ted Pella, CA) was used to establish an electrical connection between the wire and the specimen holder. The silver painted connection and the other cut end of the stationary wire specimen were covered with two layers of insulation coating such that only the lateral surface of the wire was exposed during corrosion testing.
Corrosion testing was performed according to the guidelines provided in ASTM F2129, “Standard Test Method for Conducting Cyclic Potentiodynamic Polarization Measurements to Determine the Corrosion Susceptibility of Small Implant Devices.” That is, all testing was conducted in PBS solution at 37°C with nitrogen gas purging using a standard three electrode electrochemical cell. A saturated calomel electrode was used as the reference electrode and a graphite rod as the counter electrode. An Interface 1000 potentiostat (Gamry Instruments, PA) was used to monitor the open circuit potential (OCP) for 1 hour. A potentiodynamic scan from OCP to 1000 mV versus Saturated Calomel Electrode (SCE) and back to OCP at a scan rate of 1 mV/s was performed. The OCP at the end of one-hour monitoring was recorded as the rest potential (Er), and the breakdown potential (Eb) was recorded as the potential at which a two decade increase in current was observed. The difference between the breakdown potential and rest potential, over potential (Eb−Er), was also calculated and recorded.
Scanning electron microscopic (SEM) imaging
Prior to and after corrosion testing, two samples from each test condition were cleaned with DI water and examined using Scanning electron microscopy (SEM, JEOL JSM-6390LV). Using 100× and 150× magnification, the fretted region of the wire samples post-corrosion testing were examined using both secondary and backscatter mode. Because breakdown and pitting occurred in all 316LVM stainless steel specimens, they were examined with SEM to determine the number of samples with pitting occurring at or away from the fretted region.
Statistical analysis
Minitab (Minitab, State College, PA) software was used to conduct statistical analysis to determine whether there were any significant differences for rest potentials, breakdown potentials, or over potentials between control and fretted wire samples and between small and large fretting scars. Rest potential was assumed to have a normal distribution for all materials and conditions while the breakdown and over potential were only assumed to be normal when breakdown occurred prior to reaching the vertex potential of 1000 mV. For materials where breakdown was not observed or observed sometimes (MP35N and EP NiTi), the breakdown potential, Eb, was assumed to be 1000 mV which resulted in censored data. Uncensored data was analyzed with two-sample t-tests whereas censored data (breakdown potential for EP NiTi and MP35N, and over potential for EP NiTi and MP35N) was analyzed with log-rank tests. Statistical significance was set at α = 0.05 for most tests except where a Bonferroni Correction for multiple comparisons was needed. When multiple comparisons were conducted on the same data (soak vs. each fretted condition and as received vs. each fretted condition), α = 0.05/6 = 0.008 was used. For the fretted 316LVM samples, a χ2 test was performed to determine if the location of observed pitting corrosion depended significantly on the material against which the samples were fretted; small and large fretted samples were grouped together for this analysis.
RESULTS
Table I demonstrates the average fretting depths achieved for each wire fretting test condition as measured by optical profilometry. As previously stated, a large fretting condition for EP NiTi against 316LVM could not be achieved due to wire fracture prior to achieving sufficient fretting depth. In Figure 2, representative cyclic potentiodynamic curves for the 316LVM wire samples from all four test conditions are depicted. Figure 3 illustrates the rest potential of the three alloys for all test conditions and Table II provides the corresponding p-values. For the small fretted 316LVM samples, average rest potential tended to decrease in comparison to both the as received and soak control. Similarly, some large fretted MP35N and 316LVM samples displayed significant decreases in rest potential when compared to their respective as received and soak control samples and to a greater extent than that observed in corresponding small fretted samples. The rest potential of the small and large fretted EP NiTi samples did not significantly change when compared to either the as received or soak control samples with the exception of EP NiTi large fretted against MP35N.
FIGURE 2.
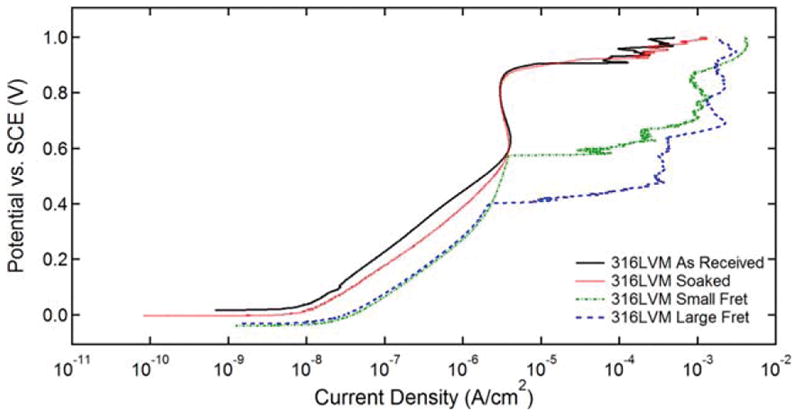
Representative potentiodynamic curves for as received and soak 316LVM wire specimens along with curves for small and large fretted samples that demonstrated the lowest breakdown potential. Only the forward scans are shown for clarity.
FIGURE 3.
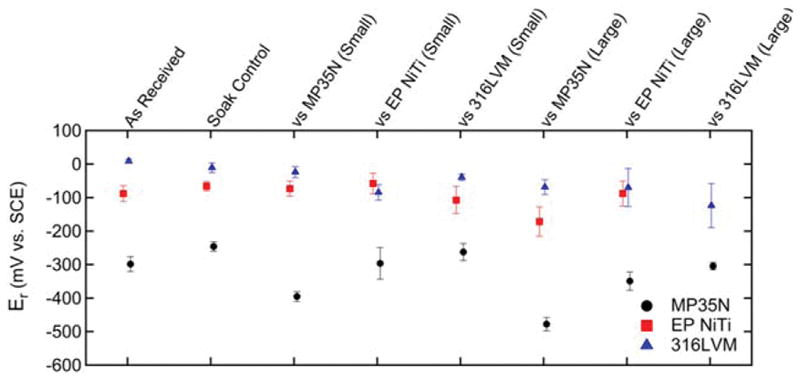
Rest potentials of as received, soak, small, and large fretted wire samples.
TABLE II.
p-Values from Statistical Analysis of Rest, Breakdown, and Over Potentials
| MP35N | EP NiTi | 316LVM | |||||||
|---|---|---|---|---|---|---|---|---|---|
|
|
|
|
|||||||
| Er | Eb | Eb − Er | Er | Eb | Eb − Er | Er | Eb | Eb − Er | |
| As Rec. vs. Soak | 0.002* | NA | 0.001* | 0.110 | 0.823 | 0.527 | 0.033* | 0.505 | 0.222 |
| As Rec. vs. MP35N (Small) | <0.001* | NA | 0.001* | 0.348 | 0.226 | 0.839 | 0.005* | 0.353 | 0.615 |
| As Rec. vs. EP NiTi (Small) | 0.923 | NA | 0.557 | 0.118 | 0.778 | 0.584 | <0.001* | 0.322 | 0.829 |
| As Rec. vs. 316LVM (Small) | 0.039 | NA | 0.041 | 0.386 | 0.578 | 0.793 | <0.001* | 0.161 | 0.376 |
| As Rec. vs MP35N (Large) | <0.001* | NA | 0.001* | 0.007* | 0.778 | 0.444 | 0.001* | 0.728 | 0.523 |
| As Rec. vs. EP NiTi (Large) | 0.011 | NA | 0.003* | 0.999 | 0.342 | 0.880 | 0.027 | 0.364 | 0.879 |
| As Rec. vs. 316LVM (Large) | 0.623 | NA | 0.815 | NA | NA | NA | 0.006* | 0.127 | 0.563 |
| Soak vs. MP35N (Small) | <0.001* | NA | 0.001* | 0.523 | 0.226 | 0.237 | 0.209 | 0.218 | 0.297 |
| Soak vs. EP NiTi (Small) | 0.071 | NA | 0.011 | 0.629 | 0.995 | 0.760 | <0.001* | 0.195 | 0.774 |
| Soak vs. 316LVM (Small) | 0.250 | NA | 0.112 | 0.071 | 0.721 | 0.391 | 0.006* | 0.097 | 0.162 |
| Soak vs. MP35N (Large) | <0.001* | NA | 0.001* | 0.004* | 0.995 | 0.309 | 0.001* | 0.518 | 0.885 |
| Soak vs. EP NiTi (Large) | <0.001* | NA | 0.001* | 0.253 | 0.447 | 0.944 | 0.073 | 0.227 | 0.543 |
| Soak vs. 316LVM (Large) | <0.001* | NA | 0.001* | NA | NA | NA | 0.013 | 0.091 | 0.345 |
The leftmost column describes the test conditions being compared in the analysis. The material named in the leftmost column (for example, vs. MP35N) is the “fretted against” material while the column headings in the top row indicate the material with the fretting scar that was subjected to pitting corrosion testing per ASTM F2129. The * indicates statistical significance at p < 0.05 for the as received vs soak comparison and at p < 0.008 for all other comparisons in this table.
As shown in Figure 4, MP35N did not exhibit breakdown under any of the test conditions while 316LVM broke down across all conditions. Moreover, the average breakdown potential of the small and large fretted 316LVM samples were lower than that of their respective as received and soak control groups. Since about half of the EP NiTi samples broke down regardless of the test condition, relatively large standard deviations were obtained, as shown in Figure 4. In Figure 5, the over potentials of the MP35N fretted against MP35N regardless of fretting size are seen to be larger than that of the as received and soak controls. This is due to the fact that the MP35N fretted against MP35N samples had lower rest potentials and were recorded to have a breakdown potential of 1 V. In contrast, there were no statistically significant differences in over potential observed for 316LVM or EP NiTi when comparing the fretted conditions with the as received or soak control groups. See Table II for a complete listing of the corresponding p-values for each statistical comparison.
FIGURE 4.
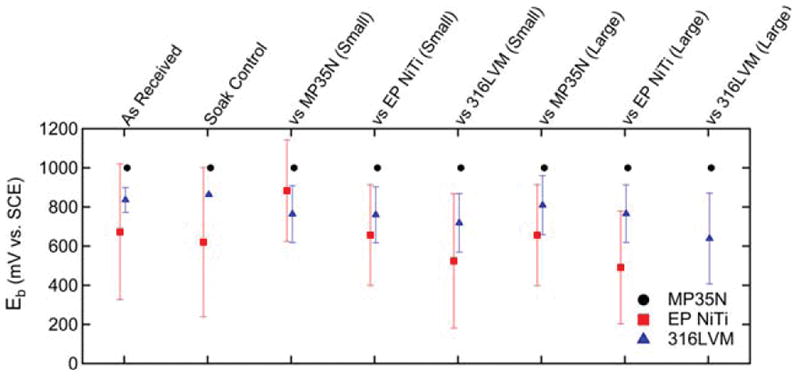
Breakdown potentials of as received, soak, small, and large fretted wire samples. In some instances, breakdown did not occur and the breakdown potential was assumed to be 1000 mV resulting in censored data. Breakdown was not observed for any MP35N specimen and was observed intermittently for EP NiTi.
FIGURE 5.
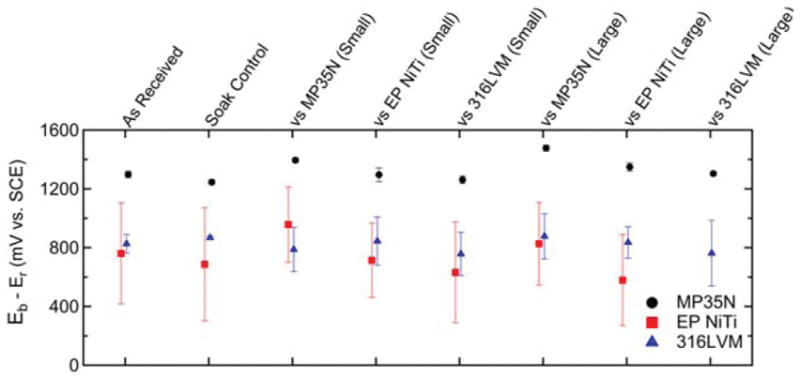
Over potentials of as received, soak, small, and large fretted wire samples. In some instances, breakdown did not occur and the breakdown potential was assumed to be 1000 mV resulting in censored data. Breakdown was not observed for any MP35N specimen and was observed intermittently for EP NiTi.
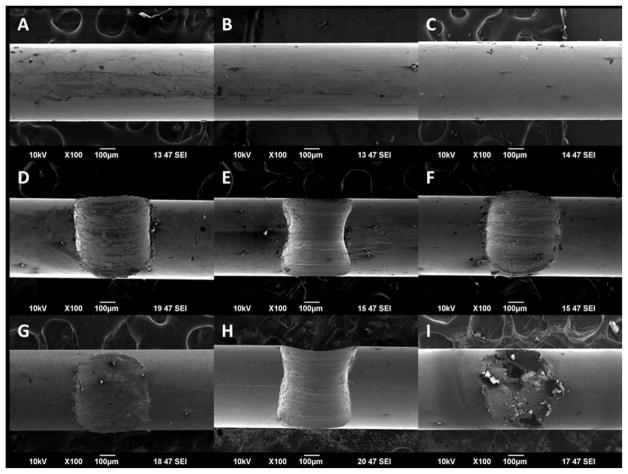
Representative SEM images taken in secondary electron imaging mode of each alloy in the as received condition, after fretting and prior to corrosion testing, and after fretting and corrosion testing are shown in Figure 6. Figure 6(A–C) depicts the surface of the as received MP35N, EP NiTi, and 316LVM wire samples, respectively, with no signs of any damage. After undergoing large fretting conditions, large fretting scars were observed on MP35N, EP NiTi, and 316LVM samples as seen in Figure 6(D–F), respectively. After undergoing fretting and corrosion testing, minimal changes in the surface topography were observed at and around the fretted regions of MP35N and some EP NiTi samples that did not breakdown as seen in Figure 6(G,H). However, for some 316LVM samples, significant pitting corrosion and breakdown was observed to have occurred specifically at the fretted region and nowhere else along the wire as shown in Figure 6(I). Figure 7, 316LVM large fretted against 316LVM, illustrates the profile and variability of the surface of a typical large fretting scar.
FIGURE 6.
SEM images of MP35N, EP NiTi, and 316LVM wire as received (A–C), large fretted before corrosion testing (D–F), and after large fretting and corrosion testing (G–I). Note the presence of severe corrosion damage and pitting is seen at the fretted region of the large fretted 316LVM sample shown in Figure 6(I).
FIGURE 7.
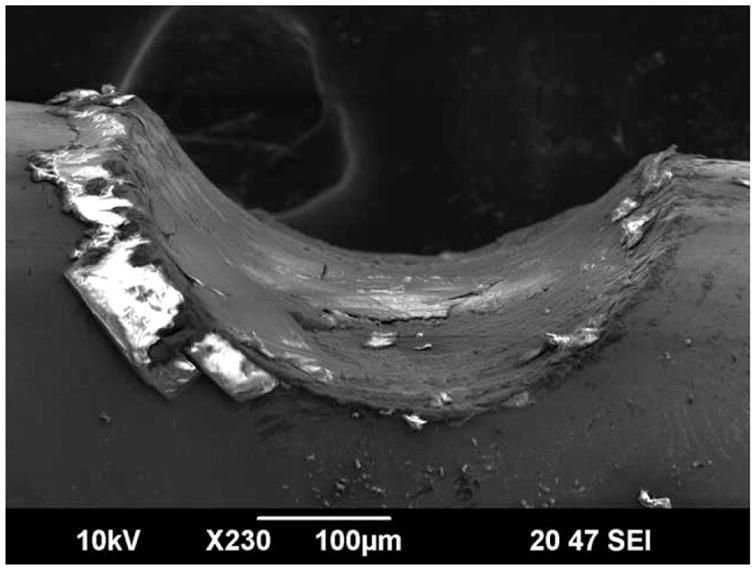
SEM image of 316LVM large fretting scar profile.
Statistical comparisons between small and large fretted specimens are shown in Table III. In general, the only comparisons with statistically significant differences were large fretting scars having lower rest potentials. The rest potential were significantly different for all conditions with the exception of MP35N fretted against EP NiTi (p = 0.056), 316LVM fretted against EP NiTi (p = 0.612), and EP NiTi fretted against EP Niti (p = 0.194). No statistically significant differences were seen in breakdown potential or over potential between the small and large fretting scar groups with the exception of over potential for MP35N fretted against any material. However, this result is somewhat expected since no MP35N samples exhibited breakdown (censored data) and so statistical significance in this group may be attributed to the differences in rest potential. No statistical comparison was possible between small and large fretting scars for EP NiTi fretted against 316LVM since these specimens could not be created as described above.
TABLE III.
p-Values from Statistical Analysis Comparing Small and Large Fretting Scars
| Fretted Against Material | MP35N | EP NiTi | 316LVM | ||||||
|---|---|---|---|---|---|---|---|---|---|
|
|
|
|
|||||||
| Er | Eb | Eb – Er | Er | Eb | Eb – Er | Er | Eb | Eb – Er | |
| MP35N | 0.006* | NA | 0.013* | 0.001* | 0.140 | 0.720 | 0.004* | 0.646 | 0.379 |
| EP NiTi | 0.056 | NA | 0.016* | 0.194 | 0.329 | 0.716 | 0.612 | 0.955 | 0.920 |
| 316LVM | 0.007* | NA | 0.003* | NA | NA | NA | 0.018* | 0.536 | 0.973 |
The * indicates statistical significance at p < 0.05.
After undergoing fretting testing, p-values were obtained to statistically compare rest, breakdown, and over potential values between pairs of as received, soak, small, and large fretted samples composed of the same alloy as shown in Table II. As observed in a previous study,8 comparisons between MP35N as received and soak samples yielded significantly different results for the rest potential (p = 0.002). Half of the comparisons between the as received/soak and fretted MP35N samples resulted in significantly different rest potential values with all the soak vs large fretted MP35N comparisons showing statistical significance (p < 0.001). In contrast, the only significant difference observed for the EP NiTi was the rest potential for the as received/soak samples compared to large fretted against MP35N. For 316LVM, most comparisons between the rest potentials of the as received/soak and fretted wire samples resulted in significantly different values (p < 0.008) while no significant differences were observed for the breakdown or over potentials. For the fretted 316LVM samples, pitting location was determined to be significantly different depending on the material against which the samples were fretted (p < 0.05). The results shown in Table IV demonstrate that for 316LVM samples which were fretted against 316LVM, pitting corrosion occurred at the fretted region for 9 out of 12 samples. In contrast, for 316LVM samples fretted against MP35N or EP NiTi, pitting occurred at the fretted region for only 2 out of 12 and 5 out of 12 samples, respectively. Post hoc χ2 comparisons were conducted to determine which materials resulted in pitting locations that were statistically different from one another using a Bonferroni correction of the p-values such that p = 0.05/3 = 0.017 was considered significant. Only the post hoc χ2 comparison between fretted against 316LVM and fretted against MP35N resulted in a statistically significant difference (p = 0.004).
TABLE IV.
Comparison of the Number of 316LVM Fretted Samples with Pitting Corrosion Observed at the Fretting Scar or Not at the Fretting Scar (Elsewhere)
| Fretted Wire vs. Rotating Wire | Fretting Scar Size | No. of Samples with Pitting at Fretting Scar | No. of Samples with Pitting Not at Fretting Scar (Elsewhere) |
|---|---|---|---|
| 316LVM vs. MP35N | Small | 1 | 5 |
| Large | 1 | 5 | |
| 316LVM vs. EP NiTi | Small | 2 | 4 |
| Large | 3 | 3 | |
| 316LVM vs. 316LVM | Small | 5 | 1 |
| Large | 4 | 2 |
DISCUSSION
Overall, wire fretting was shown to have no significant effect on the pitting corrosion susceptibility of the MP35N, EP NiTi, and 316LVM wire samples systematically evaluated in this study. Small and large fretting scars were able to be reproduced consistently for different pairs of material combinations. Optical profilometry was able to quantify the depth of the induced fretting scars and SEM imaging provided high magnification images of the fretting scar before and after ASTM F2129 corrosion testing. All three alloys tested are commonly used to manufacture stents and generally possess good resistance to pitting corrosion11 in the as manufactured condition.12–14 In our study, approximately 50% of EP NiTi samples broke down for any given test condition, including the as received specimens, demonstrating high levels of variability in susceptibility to pitting corrosion among individual samples, which is similar to what was observed in another study.15. In previous studies, the breakdown potential of nitinol was shown to be heavily influenced by corrosion testing conditions and surface treatments.15,16 Specifically, it was observed that a uniform passive oxide layer is critical to protecting against pitting corrosion.15 This may partly explain the large variations in breakdown potentials observed for EP NiTi in this study where even slight defects or anomalies in the oxide layer of EP NiTi could result in lower breakdown potentials being observed. Perhaps in part due to the large variations in breakdown and over potentials of EP NiTi samples, there were no significant differences between the as received/soak control samples and fretted EP NiTi samples. Similarly, no change in the potentiodynamic response of MP35N samples was observed (see Table II) across all test conditions and it was concluded that the fretting damage had no effect on its susceptibility to pitting corrosion. In contrast, 316LVM broke down across all test conditions as shown in Figure 2 and thus allowed for the best comparative analysis of the effect of fretting on pitting corrosion susceptibility.
The general trend observed was that induced fretting damage resulted in lowering the rest potential values for both small and large fretted samples as compared to their respective as received and soak control samples. This was expected as mechanical abrasion damages the oxide layer which immediately shifts the rest potential in the cathodic direction.17 Once the damage to the oxide layer (in this case fretting) ceases the rest potential gradually increases over time as the oxide layer repassivates at the damaged region of the immersed sample. However, the rest potential may not approach the same equilibrium rest potential prior to fretting damage because at cathodic voltages repassivation of the oxide layer results in formation of a defective oxide which could be more prone to corrosion when compared to the surrounding intact oxide film.17,18 Interestingly, in our study MP35N and 316LVM tended to show more significant reductions in rest potential when subjected to fretting conditions than EP NiTi. The rest potential of any fretted EP NiTi group was not significantly lower than the controls with the exception of EP NiTi large fretted against MP35N. In some cases, such as MP35N small fretted against 316LVM, the rest potential was higher for the fretted samples as compared to the as received control although not to the point of statistical significance. As was shown in a previous study, a key factor that resulted in significantly higher rest potentials was immersion time in PBS.8 That is, although these MP35N samples underwent small fretting damage against 316LVM, their immersion time was about twice as long in PBS (about 70 minutes longer during fretting testing) as compared to the as received MP35N samples. So although the fretting damage is suspected to reduce the rest potential, exposure to PBS may have an opposing effect. Table III illustrates that direct statistical comparison between the small and large fretted groups often resulted in significantly lower rest potentials for samples with the large fretting scar. This greater reduction in rest potential is indicative of the formation of a fretting scar with a larger surface area than that of the corresponding small fretted samples.
Induced fretting damage did not significantly affect the breakdown potential of any of the three alloys tested. Although the average breakdown of 316LVM samples was lower than that of the as received and soak controls as shown in Figure 4, the difference was not statistically significant. In contrast, MP35N fretted samples did not breakdown while EP NiTi broke down inconsistently. Similar to the observations for rest and breakdown potentials of the fretted EP NiTi samples, no significant changes were observed in over potentials when comparing small or large fretted EP NiTi against their respective as received and soak control samples. For the 316LVM samples, no statistical comparison for over potential resulted in a significant p-value. When comparing the small and large fretting scar groups, there were no statistically significant differences found in breakdown potential implying that the size of the fretting scar in our study did not affect localized corrosion susceptibility. In summary, it was shown that wire fretting damage alone was not sufficient to increase susceptibility to pitting corrosion for the alloys and fretting combinations studied here.
While this study showed that fretting damage alone was not sufficient to increase susceptibility to pitting corrosion per ASTM F2129, there are some important limitations to consider in extending this study to expected in vivo performance. This study was performed entirely in PBS which is commonly used for this kind of in vitro testing. However, it is possible that the fluids, proteins, pH changes, crevice like conditions, and inflammatory responses found in vivo could lead to differences in pitting corrosion behavior post-fretting than what we observed here. Additionally, for this study each sample had only a single fretting scar while most devices in vivo would have the opportunity to have multiple fretting scars; this increase in fretting scar area could also adversely affect the corrosion performance and was not considered in our study. Lastly, while this study isolated the sample from any other damage mechanism beyond fretting; it is quite possible that in vivo fretting damage would be one of several damage mechanisms acting on a device and the combination of these damage mechanisms could adversely affect the corrosion performance of the device. This could explain why Trépanier et al.1 observed that there was a decrease in corrosion resistance for overlapped stents undergoing fatigue and fretting conditions and the results presented here did not show that same trend.
Although wire fretting damage did not significantly increase the susceptibility of 316LVM samples to pitting corrosion, it was determined that the location of pitting was significantly affected by the material against which 316LVM samples were fretted (p < 0.05). Specifically, for 316LVM samples fretted against 316LVM, 9 out of 12 had pitting damage at the fretted region which was statistically different from 316LVM samples fretted against MP35N (2 out of 12 with pitting damage at the fretted region). Comparing the other material combinations (fretted against 316LVM with fretted against EP NiTi and fretted against MP35N with fretted against EP NiTi) did not result in statistically significant different pitting corrosion locations. So although 316LVM fretted against 316LVM resulted in more pits at the fretted region than 316LVM fretted against MP35N, statistically both of these conditions were similar to 316LVM being fretted against EP NiTi (5 out of 12 with pitting damage at the fretted region). It may be the case that 316LVM fretted against 316LVM created a weaker spot allowing corrosion to occur more readily at the fretted region, but since none of the 316LVM wires fretted against 316LVM had statistically different breakdown potentials when compared to the as received or soak control samples, the overall effect appears to be relatively minor. It is unclear what caused the change in pitting corrosion location, but differences in material transfer among the fretted against materials could have accounted for the differences observed in the pitting location by locally altering the surface.
CONCLUSION
Cardiovascular devices constructed of metallic alloys can undergo fretting and fatiguing conditions in vivo, both of which could damage the protective oxide layer on their surfaces and potentially lead to pitting corrosion. In a previous study performed in our laboratory, fatigue conditions alone were shown to not significantly affect the pitting corrosion susceptibility of metallic alloys commonly implanted in vivo.8 The work herein set out to determine the effect that wire fretting alone has on the pitting corrosion susceptibility of several metallic alloys commonly used to manufacture intravascular stents. Results from cyclic potentiodynamic corrosion testing showed that MP35N did not break down under any test condition and thus was not affected by wire fretting while EP NiTi inconsistently broke down regardless of fretting damage. Although some 316LVM samples broken down at lower potentials and appeared to exhibit increased susceptibility to pitting corrosion, there was not a statistically significant difference in breakdown potential between fretted samples and non-fretted controls. With 316LVM samples, the fretted against material was found to influence the location of pitting corrosion with samples fretted against 316LVM having more corrosion pits at the fretting scar than samples fretted against MP35N. Overall, within the constraints of this study, it was concluded that wire fretting alone does not lead to increased pitting corrosion susceptibility in the materials studied which aligns with FDA’s current recommendations on corrosion testing for cardiovascular implants.6
Acknowledgments
Contract grant sponsors: Division of Applied Mechanics.
This project was funded by the Division of Applied Mechanics. Similarly, it was supported in part by an appointment to the Research Participation Program at the Center for Devices and Radiological Health administered by the Oak Ridge Institute for Science and Education through an interagency agreement between the U. S. Department of Energy and the U. S. Food and Drug Administration. The mention of commercial products, their sources, or their use in connection with materials reported herein is not to be construed as either an actual or implied endorsement of such products by the Department of Health and Human Services.
References
- 1.Trépanier C, Gong XY, Ditter T, Pelton A, Neely Y, Grishaber R. Effect of wear and crevice on the corrosion resistance of overlapped stents. SMST-2006. Proceedings of the International Conference on Shape Memory and Superelastic Technologies; Menlo Park, CA: SMST Society; 2008. pp. 265–275. [Google Scholar]
- 2.Halwani DO, Anderson PG, Brott BC, Anayiotos AS, Lemons JE. Clinical device-related article surface characterization of explanted endovascular stents: Evidence of in vivo corrosion. J Biomed Mater Res B Appl Biomater. 2010;95(1):225–238. doi: 10.1002/jbm.b.31698. [DOI] [PubMed] [Google Scholar]
- 3.Halwani DO, Anderson PG, Lemons JE, Jordan WD, Anayiotos AS, Brott BC. In-vivo Corrosion and Local Release of Metallic Ions from Vascular Stents into Surrounding Tissue. J Invasive Cardiol. 2010;22(11):528. [PubMed] [Google Scholar]
- 4.Kapnisis KK, Pitsillides CM, Prokopi MS, Lapathitis G, Karaiskos C, Eleftheriou PC, Anayiotos AS. In vivo monitoring of the inflammatory response in a stented mouse aorta model. J Biomed Mater Res A. 2016;104(1):227–238. doi: 10.1002/jbm.a.35560. [DOI] [PubMed] [Google Scholar]
- 5.Caixeta AM, Brito FS, Costa MA, Serrano CV, Petriz JL, Da Luz PL. Enhanced inflammatory response to coronary stenting marks the development of clinically relevant restenosis. Cathet Cardiovasc Interv. 2007;69(4):500–507. doi: 10.1002/ccd.21007. [DOI] [PubMed] [Google Scholar]
- 6.US Food and Drug Administration. Non-clinical tests and recommended labeling for intravascular stents and associated delivery systems: guidance for industry and FDA staff. Food and Drug Administration, Center for Devices and Radiological Health; 2005. [Google Scholar]
- 7.ASTM F2129-06. Standard Test Method for Conducting Cyclic Potentiodynamic Polarization Measurements to Determine the Corrosion Susceptibility of Small Implant Devices. 2001 [Google Scholar]
- 8.Di Prima MA, Guiterrez E, Weaver J. The effect of fatigue on the corrosion resistance of common medical alloys. J Biomed Mater Res B Appl Biomater. 2016 doi: 10.1002/jbm.b.33738. [DOI] [PMC free article] [PubMed] [Google Scholar]
- 9.Nissan A, Eiselstein LE, Steffey D, Corlett N. Effect of Long-Term Immersion on the Pitting Corrosion Resistance of NiTiNol. Proc SMST. 2007;2008:271–278. [Google Scholar]
- 10.Kapnisis KK, Halwani DO, Brott BC, Anderson PG, Lemons JE, Anayiotos AS. Stent overlapping and geometric curvature influence the structural integrity and surface characteristics of coronary nitinol stents. J Mech Behav Biomed Mater. 2013;20:227–236. doi: 10.1016/j.jmbbm.2012.11.006. [DOI] [PubMed] [Google Scholar]
- 11.Corbett RA. Laboratory corrosion testing of medical implants. Proceedings of Materials and Processes for Medical Devices Conference; Ohio: ASM International, Materials Park; 2004. pp. 166–171. [Google Scholar]
- 12.Ornberg A, Pan J, Herstedt M, Leygraf C. Corrosion resistance, chemical passivation, and metal release of 35N LT and MP35N for biomedical material application. J Electrochem Soc. 2007;154(9):C546–C551. [Google Scholar]
- 13.Trepanier C, Tabrizian M, Yahia LH, Bilodeau L, Piron DL. MRS Proceedings. Vol. 459. Cambridge Univ Press; 1996. Improvement of the corrosion resistance of NiTi stents by surface treatments; p. 363. [Google Scholar]
- 14.Shahryari A, Omanovic S. Improvement of pitting corrosion resistance of a biomedical grade 316LVM stainless steel by electrochemical modification of the passive film semiconducting properties. Electrochem Comm. 2007;9(1):76–82. [Google Scholar]
- 15.Trepanier C, Tabrizian M, Yahia LH, Bilodeau L, Piron DL. Effect of modification of oxide layer on NiTi stent corrosion resistance. J Biomed Mater Res. 1998;43:433–440. doi: 10.1002/(sici)1097-4636(199824)43:4<433::aid-jbm11>3.0.co;2-#. [DOI] [PubMed] [Google Scholar]
- 16.Sarkar N, Redmond W, Schwaninger B, Goldberg AJ. The chloride corrosion behavior of four orthodontic wires. J Oral Rehabil. 1983;10(2):121–128. doi: 10.1111/j.1365-2842.1983.tb00106.x. [DOI] [PubMed] [Google Scholar]
- 17.Hoar TP, Mears DC. Corrosion-resistant alloys in chloride solutions – Materials for surgical implants. Proc Roy Soc Lond Ser A Math Phys Sci. 1966;294:486–510. [Google Scholar]
- 18.Bearinger JP, Orme CA, Gilbert JL. Direct observation of hydration of TiO2 on Ti using electrochemical AFM: Freely corroding versus potentiostatically held. Surf Sci. 2001;491(3):370–387. [Google Scholar]


