

Summary
Introduction
Students overestimate alcohol consumption of those around them and underestimate their own, so that quantitative approach may not be the most relevant to assess students’ drinking. The main objective was to provide an appropriate tool for screening for students with potential drinking problems.
Methods
A multicentre cross-sectional survey was conducted by internet between February and June, 2013 in France. Thirteen questions explored alcohol consumption, including 8 concerning after-effects of drinking episodes (4 items of the AUDIT) and alcohol behaviour (CAGE test). A multiple correspondence analysis (MCA) was conducted to identify profiles of student’s alcohol consumption. Partitioning methods were used to group students by mode of alcohol use. The most relevant items included in the MCA were identified. Three questions were identified as most pertinent among the students with potential drinking problems and ranked by a decision tree with the Chi-square Automatic Interaction Detector method. Finally, we assessed the generalisation of the model.
Results
A total of 36,427 students participated in the survey: 25,679 were women (70.5% of respondents), sex ratio 0.42 and mean aged 21.2 (sd 3.7 years). Among those who had experimented with alcohol (N = 33,113), three consumption profiles were identified: “simple/non-use” (66.9%), “intermediate consumption” (25.9%) and “problem drinking” (7.2%). For the latter group, the three most relevant items were (Q20) “not able to stop drinking after starting”, (Q21) “failed to do what was normally expected”, and (Q23) “unable to remember what happened the night before”.
Conclusions
These results provide healthcare professionals with a 3-item screening tool for students “problem drinking”.
Keywords: Alcohol drinking, College students, Prevention, Alcohol misuse, Screening tool
Introduction
Addictive behaviour in students, especially alcohol misuse, is a subject of major concern that has been widely investigated in the literature [1-3]. The negative physical, psychological and sexual consequences associated with alcohol misuse are well known [1-3]. In their study of US college students, Hingson et al. estimated that in a student population of 8,530,318, 10.5% (599,000) were injured in 2001 due to drinking, 12.0% (696,000) were assaulted or hit, and 2.0% (97,000) experienced sexual assault or date rape by another drinking college student [1]. This team later reported that in 1998, 1440 students and in 2005 1825 students from different student populations died from alcohol-related unintentional injuries, for a 3% increase in the rate per 100,000 students per year [2]. Saewyc et al. showed that 16% of both female and male university students had been victims of emotional or physical violence closely related to alcohol misuse [3].
In France, the university student health services (USHS) are responsible for health promotion, surveillance and prevention for students, including screening for addiction problems.
It is difficult for individuals to quantify alcohol consumption, above a certain quantity that varies from person to person [4, 5]. The general population and most particularly young men misperceive their alcohol intake [5-7], as do students, who tend to overestimate that of those around them and underestimate their own [8-10]. In this context, it may be more relevant to identify misuse by measuring the negative consequences of drinking trough specific questionnaire items.
The Alcohol Use Disorders Identification Test (AUDIT) is a self-administered questionnaire of 10 items used to screen for problem drinkers, that is, those whose alcohol use during the past year has been harmful or placed them at risk; it has shown good metrological properties in student populations [11, 12]. Its shorter versions, AUDIT-C, AUDIT*2, and AUDIT*3, have also been evaluated among students; like it, they include a quantitative assessment of alcohol consumption and seek to identify which version is most appropriate for screening for excessive drinking in this population [12-15]. They have shown sensitivity ranging from 80% to more than 90% and specificity from 82% to 95% or more and perform at least as effectively as AUDIT [12-14]. To our knowledge, the AUDIT questions that measure excessive consumption of alcohol by its negative effects on memory and behaviour (items 4, 5, 7 and 8) have not been compared with the complete AUDIT questionnaire to measure their screening performance.
Consequently, in order to improve screening of students with drinking problems, the association of directors of French university health centres (Association des Directeurs des Services de Santé Universitaire-ADSSU), the Interministerial mission for combatting drugs and addictive behaviour (Mission Interministérielle de Lutte contre les Drogues et les Conduites Addictives-MILDECA) and the conference of university presidents (Conférence des Présidents d’Université-CPU) set up a project supported by the French Ministry of Higher Education and Scientific Research.
The principal objective of this study was to provide an appropriate tool for screening for potential student drinking problem.
Methods
A multicentre cross-sectional survey was conducted by internet between February 2 and June 30, 2013 in France. An email was sent by participating USHS to students’ digital workspaces.
QUESTIONNAIRE
The questionnaire was devised by a working group from the USHS of Bordeaux, Clermont-Ferrand, and Grenoble, associated with the ADSSU. Relevant items were selected from a review of the literature, with special reference to four French and European surveys (http://www.ove-national.education.fr/; http://www.ofdt.fr/) [16-18]. The questionnaire comprised 76 items that explored sociodemographic and educational characteristics, substance use, physical, psychological, and sexual violence, physical and mental health, social deprivation, and unmet health care needs (Supplemental Table A).
Supplemental Table A.
survey questionnaire


|
Thirteen questions explored alcohol consumption (Q15-Q23 and Q28-Q31). Four assessed alcohol consumption (as a regular habit), the quantity of alcohol drunk over the past year, in the past 30 days, on a single occasion, and one question measured the number of times the individual had been drunk, according to the OFDT definitions (Q15-Q19) [19]. Eight questions analysed excess alcohol consumption. Four questions came from AUDIT, two that asked about symptoms of dependence (Q20-Q21) and two about harmful use of alcohol (Q22-Q23). These questions were (Q20) “How often during the past year have you found that you were not able to stop drinking once you had started?”, (Q21) “How often during the past year have you failed to do what was normally expected from you because of drinking?”, (Q22) “How often during the last year have you had a feeling of guilt or remorse after drinking?”, and (Q23) “How often during the last year have you been unable to remember what happened the night before because you had been drinking?” The following responses were available: never; less than once a month; once a month; more than once a month; once a week or more. Four questions came from the Cut-Annoyed-Guilty-Eye-opener (CAGE) test (Q28-Q31), which measures problems associated with alcohol consumption at any point in life. The responses to these questions was yes or no: (Q28) “Have you ever felt you needed to cut down on your drinking?”, (Q29) “Have people annoyed you by criticising your drinking?”, (Q30) “Have you ever felt guilty about drinking?”, and (Q31) “Have you ever felt you needed a drink first thing in the morning (eye-opener) to steady your nerves or to get rid of a hangover?” [20].
The online version of the study questionnaire was developed by the Bordeaux School of Public Health (ISPED). Only complete questionnaires were considered. The database was anonymous, created by ISPED, and approved by the French data protection authority (CNIL).
POPULATION
All French USHS (N = 54) were invited to participate in the study. In all, 33, at universities located across France and enrolling 537,092 French students, distributed the questionnaire. Paris-area universities are underrepresented in this group. Among the USHS that did not participate, 10 conducted a different survey (I-share), and the others did not have access to student lists. All students in participating universities were asked to participate through their university e-mail address. Response was fully voluntary.
STATISTICAL ANALYSIS
To make the sample representative of the study population, the data were weighted for gender and university discipline with the raking ratio technique. The adjustment was based on data furnished by the French ministry of higher education and research (http://www.enseignementsup-research.gouv.fr/cid77397/les-effectifs-d-etudiants-dans-le-superieur-en-2012-2013.html). Except for the two variables used for the weighting, all results presented have been weighted.
Descriptive analysis was performed to assess overall and quantitative variables, by calculating percentages and their 95% confidence intervals (95% CI) and means with their standard deviations (sd), respectively. Bivariate analysis was performed with the Chi-square test for qualitative variables and Student’s t-test for quantitative variables.
Among the 13 questions exploring alcohol use, the 10 most informative alcohol-related items were kept: the number of glasses consumed on a single occasion and the number of episodes of drunkenness during the past year, as well as Q20-Q23 and Q28-Q31. A multiple correspondence analysis (MCA) was conducted to identify profiles of consumption by detecting its underlying patterns. We next identified the three items most relevant to characterising each homogeneous pattern cluster by calculating the Cramer’s V. Then, we ranked these three questions identified as most pertinent among the students with potential drinking problems by a decision tree with the Chi-square Automatic Interaction Detection (CHAID) method (a decision tree technique, based on adjusted significance testing) [21-23].
The last step of the statistical analysis assessed the generalizability of our model. The database (33,113 students who had experimented with alcohol) was divided in two parts, a learning group (75% of the sample, 24,689 students) and a validation group (25%, 8424 students) through the measurement of a global error rate, an underestimated error rate and an overestimated error rate.
Significance was defined by a threshold of 5% for all statistical tests. Statistical analysis was performed with SAS software (V9.2. SAS Institute Inc., Cary, NC, 2002-2003) and R-3.1.1.
Results
In all, 36,427 students responded to the survey: 25,679 young women (70.5%) and 10,748 young men (29.5%), for a sex ratio of 0.42. Their mean age was 21.2 (sd 3.7) years. The academic divisions enrolling the most respondents were science and technology, agronomics, industry, and teaching (29.0%), arts, letters, languages, and human and social science (24.6%), and health (19.2%) (Tab. I).
Tab. I.
Socio-demographic and higher education characteristics of overall students included in the survey.
| Na | %b (nc) | md (sde) | |
|---|---|---|---|
| Gender (women)* | 36427 | 70.5 (2,5679) |
|
| Age | 36378 | 21.2 (3.7) |
|
| Academic division* | 36427 | ||
| Science and Technology, Agronomics, Industry, Teaching | 29.0 (10,558) |
||
| Art, Letters and Languages, Human and Social sciences | 24.6 (8,967) |
||
| Health | 19.2 (6,978) |
||
| University institute of Technology |
11.1 (4,029) |
||
| Law, Political sciences | 8.2 (2,991) |
||
| Commerce, Economic sciences, Management | 5.8 (2,097) |
||
| Sport | 2.2 (807) |
a = number of individuals with information about the variable
b = percentage
c = number of individuals with that response category
d = means
e = standard deviation
* = non-weighted data.
Overall, 91.3% of students had experimented with alcohol and 79.0% had used alcohol in the last 30 days; 59.0% reported they had been drunk at least once in the past year (Tab. II). Of students who had experimented with alcohol, 6.9% reported being unable to stop drinking once they had started, 4.9% that they had failed to do what was normally expected from them, 6.0% that they felt guilt or remorse after drinking, and 6.0% that they could not remember what happened the night before at least once in the past month. All harmful alcohol use symptoms were reported more frequently by men (Tab. III).
Tab. II.
Descriptive and bivariate analyses of alcohol use among overall students included in the survey.
| Total* N = 36427 %a (nb) |
Males** N = 10748 %a (nb) |
Females** N = 25679 %a (nb) |
p | |
|---|---|---|---|---|
| Alcohol use | ||||
| Experimentation | 91.3 (33113) | 91.9 (9853) | 90.9 (23260) | < 0.0001 |
| ≥ 1 use in the last 30 days | 79.0 (28197) | 82.9 (8858) | 76.1 (19339) | < 0.0001 |
| ≥ 10 use in the last 30 days | 8.8 (2615) | 14.4 (1470) | 4.6 (1145) | < 0.0001 |
| ≥ 1 use per day | 1.9(522) | 3.3(332) | 0.8(190) | < 0.0001 |
| ≥ 1 drunkenness in the last year | 59.0 (20498) | 66.6 (7095) | 53.2 (13403) | < 0.0001 |
| ≥ 3 drunkenness in the last year | 33.9 (11076) | 43.8 (4595) | 26.3 (6481) | < 0.0001 |
| Drinks on a single occasion < 0.0001 | ||||
| ≤ 4 drinks on a single occasion | 70.0 (24154) | 60.2 (5965) | 77.6 (18189) | |
| 5 or 6 drinks on a single occasion | 16.5 (5194) | 19.0 (1875) | 14.6 (3319) | |
| 7 or 9 drinks on a single occasion | 7.7 (2252) | 10.5 (1006) | 5.5 (1246) | |
| ≥ 10 drinks on a single occasion | 5.8 (1513) | 10.4 (1007) | 2.3(506) | |
a = percentage
b = number of individuals with this response category
c = with at least two positive answers
* = data weighted on gender and academic division
* = data weighted on academic division.
Tab. III.
Another descriptive and bivariate analyses of alcohol use characteristics among male and female students who had experimented with alcohol.
| Total* N = 33113 %a (nb) |
Men** N = 9853 %a (nb) |
Women** N = 23260 %a (nb) |
p | |
|---|---|---|---|---|
| Not able to stop drinking once you had started (Yes) | < 0.0001 | |||
| < 1 time per month | 9.3 (2,882) |
11.0 (1,073) |
8.0 (1,809) |
|
| ≥ 1 time per month | 6.9 (1,851) |
10.2 (931) |
4.3 (920) |
|
| Failed to do what was normally expected from you because of drinking (Yes) |
< 0.0001 | |||
| < 1 time per month | 14.0 (4,348) |
16.4 (1,580) |
12.1 (2,768) |
|
| ≥ 1 time per month | 4.9 (1,326) |
7.3 (649) |
3.2 (677) |
|
| Had a feeling of guilt or remorse after drinking (Yes) | < 0.0001 | |||
| < 1 time per month | 19.9 (6,402) |
21.3 (2,055) |
18.9 (4,347) |
|
| ≥ 1 time per month | 6.0 (1,688) |
7.8 (699) |
4.6 (989) |
|
| Unable to remember what happened the night before because you had been drinking (Yes) | < 0.0001 | |||
| < 1 time per month | 18.5 (5,752) |
22.6 (2,228) |
15.3 (3,524) |
|
| ≥ 1 time per month | 6.0 (1,671) |
8.8 (856) |
3.8 (815) |
|
| Have you ever felt you should cut down on your drinking? (Yes) | 14.7 (4,303) |
18.6 (1,721) |
11.6 (2,582) |
< 0.0001 |
| Have people annoyed you by criticising your drinking? (Yes) | 10.7 (3,033) |
15.8 (1,505) |
6.8 (1,528) |
< 0.0001 |
| Have you ever felt you are drinking too much? (Yes) | 17.3 (5,139) |
22.7 (2,169) |
13.2 (2,970) |
< 0.0001 |
| Have you ever had a drink first thing in the morning to steady your nerves or to get rid of a hangover (eye opener)? (Yes) | 1.2 (309) |
1.9 (164) |
0.7 (145) |
< 0.0001 |
| CAGE-Alcohol positivec | 12.8 (3,716) |
17.3 (1,619) |
9.4 (2,097) |
< 0.0001 |
a = percentage
b = number of individuals with that response category
c = with at least two positive answers
* = data weighted on gender and academic division
** = data weighted on academic division.
Among those who had experimented with alcohol (N = 33,113), three consumption profiles were identified: “simple/non-use” (22,164 students, 66.9%), “intermediate consumption” (8,553 students, 25.9%) and “problem drinking” (2,396 students, 7.2%) (Fig. 1). For the “problem drinking” group, the three most relevant items were (Q20) “not able to stop drinking after starting”, (Q21) “failed to do what was normally expected”, and (Q23) “unable to remember what happened the night before” (Supplemental Table B). In the decision tree, those three relevant items were ranked as follows: (Q23) (Q20), and (Q21).
Fig. 1.
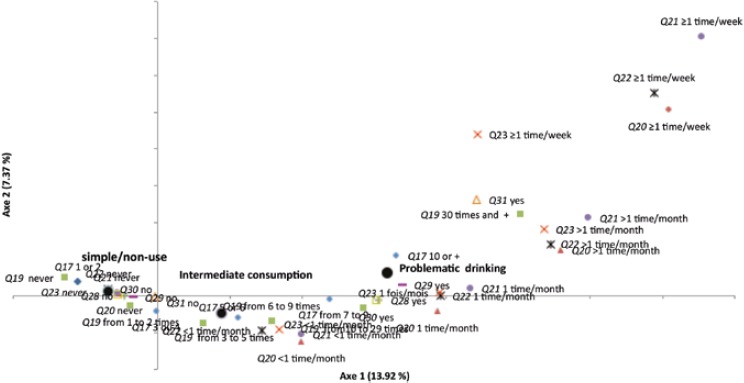
Projection of variables modalities integrating in the multiple correspondence analysis.
Centre of gravity; Item 17: “How many alcoholic drinks do you drink on a single occasion?”; Item 19a: “Have you been drunk in the last year?”; Item 20: “How often during the last year have you found that you were not able to stop drinking once you had started?”; Item 21: “How often during the last year have you failed to do what was normally expected from you because of drinking?”; Item 22: “How often during the last year have you had a feeling of guilt or remorse after drinking?”; Item 23: “How often during the last year, have you been unable to remember what happened the night before because you had been drinking?” and item 28-31: DETA-CAGE.
Supplemental Table B.
results of the three most discriminant items for the three groups, simple use/non-use, intermediate consumption and problem drinking, identified by the multiple correspondence analysis
| Items | Group 1 Simple use/non-use |
Group 2 Intermediate consumption |
Group 3 Problem drinking |
|---|---|---|---|
| Number of drink on a single occasion | 0.542 | 0.401 | 0.413 |
| Annual frequency of drunkenness | 0.689 | 0.548 | 0.556 |
| Not able to stop drinking after starting | 0.541 | 0.430 | 0.679 |
| Failed to do what was normally expected | 0.572 | 0.465 | 0.627 |
| Guilt feelings | 0.613 | 0.526 | 0.553 |
| Unable to remember what happened the night before | 0.652 | 0.551 | 0.645 |
| Have you ever felt you should cut down on your drinking? | 0.400 | 0.239 | 0.321 |
| Have people annoyed you by criticising your drinking? | 0.332 | 0.156 | 0.338 |
| Have you ever felt bad or guilty about your drinking? | 0.465 | 0.291 | 0.354 |
| Have you ever had a drink first thing in the morning to steady your nerves or to get rid of a hangover (eye opener)? | 0.087 | 0.008 | 0.144 |
From the learning portion of the sample (N = 24,689), the three most relevant questions for identifying students with drinking problems were ranked as follows: (Q23) “ unable to remember what happened the night before”, (Q20) “not able to stop drinking after starting”, and (Q21) “failed to do what was normally expected”. Among the students who reported that they could not remember who happened the night before (Q23) “at least once a month”, 40.3% belonged to the group with drinking problems (Supplemental Material 2), while among those who reported that they were unable to stop drinking (Q20) more than once a month, 15.0% did, as did 6.7% of those who reported that they were unable to do what was normally expected (Q21) more than once a month. Overall, 84.5% of the students in the “problem drinking” group were correctly identified by using a simple decision tree. Inversely, the response “never” to those three questions correctly identified 70.0% of the students belonging to the “simple/non-use” group (Fig. 2).
Fig. 2.
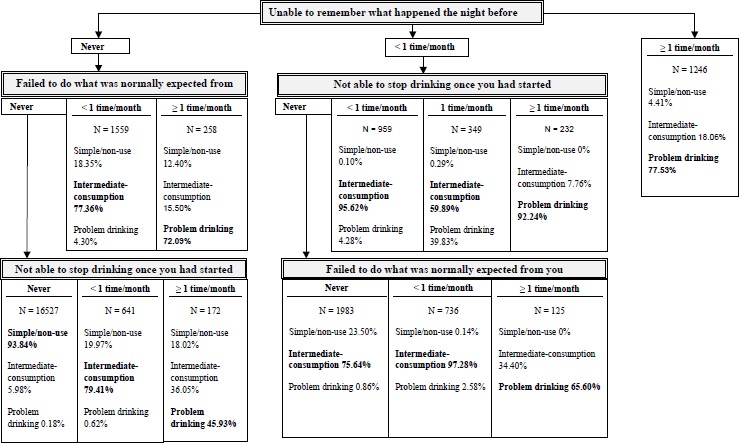
Results of the decision tree (N = 24 689), for students belongs to the simple/non-use group (66.87%), the intermediate group (25.81%) and the problem drinking group (7.32%).
Thus this model, with three simple questions (unable to remember after drinking, not able to stop drinking, failed to do what was expected due to alcohol intake), has good sensibility and enough specificity for identifying students at risk. This indicates that it might be a good tool for screening.
Discussion
The students with drinking problems can be identified during rapid screening in daily practice, by asking three probing questions, all from AUDIT.
Our results are consistent with those of the 2010 French Health Barometer concerning the annual prevalence of at least one episode of drunkenness (59.0% vs 50.9%, respectively) and those of the Eurobarometer concerning binge drinking (responding yes to “I usually consume five servings of alcohol or more on the days I drink” (27.4% vs 22%) [24]. Similar results were also observed concerning the amount drunk at one time despite a different threshold and time period (30.7% vs 27.4%) [25]. The 30-day prevalence of alcohol consumption among the US university students whose alcohol use was assessed by the ACHA-NCHAII (66.8%) and the Monitoring the Future (MTF) surveys (63.1%) was lower than in our study (79.0%) [26, 27]. Nonetheless, results for the percentage of students who had been drunk at least once were quite similar: The MTF survey reported that 57.9% of American university students had been drunk at least one time in the last 12 months, compared with 59.0% in our survey. Moreover, 32.3% of the American students in the ACHA-NCHAII survey admitted to having forgotten where they were or what they had done under the influence of alcohol, a percentage moderately higher than among French students (24.5%).
One of the issues underlying this study was students’ misperceptions of their own alcohol consumption. Our study appears to show a recall bias associated with excessive alcohol consumption. The approaches based on the quantity of alcohol drunk appeared to be much more less discriminant for identifying groups of students at high risk than the questions about the consequences of their drinking. For students with drinking problems, the questions on negative effects on memory and behaviour are informative and contribute to identifying students at high risk. Students thus appear to underestimate the real quantity of alcohol they drank and overlook guilt feelings, but have better perception and report more accurately the consequences of drinking in terms of amnesia, loss of control, and inability to do what was expected of them [4, 5].
To our knowledge, this is the first nationwide study in France intended to analyse students’ practices related to addiction. The Health Barometer analyses the health of the French but not specifically that of students and the OVE conducts studies of students without specifically focusing on their health status. This multicentre cross-sectional study was conducted among a very large sample of students. It is nonetheless impossible to estimate the students’ participation rates, because the Ministry of Education could not provide student enrolment data by university for the year the study took place. Participation varied according to university. Some students could not be asked to participate because we did not obtain the agreement of their university’s communication department. The results are nonetheless homogeneous between the participating universities.
Healthcare professionals but also public authorities now have available three questionnaire items that can be used to assess alcohol consumption and are relevant both for early, routine identification and for initiating prevention campaigns among students with problem drinking. These questions meet the needs of healthcare professionals who have wanted to be able to conduct rapid screening in their everyday practice [28, 29]. Once this screening and identification has been performed, several methods of management are possible: intervention by a healthcare professional, peers, or even self-management on the internet [30-32]. A strategy of correction of misperceptions has also proved effective [33].
The continuation of this work also leads us to approach this research field from another angle. Do the three questions we identified only allow us to identify students who are problem drinkers through the negative consequences that excessive drinking can have? Or do they further allow us to identify difficulties in controlling alcohol consumption that thus reveal vulnerability to future dependence on it? If the latter is the case, these three questions must be considered factors of vulnerability, similar to those previously identified: age at the beginning of drinking, alcohol consumption and drunkenness in middle school and high school, and the frequency of negative effects of alcohol consumption [34].
Conclusions
Questions about the inability to remember what happened the night before, inability to stop drinking, and inability to do what one is normally expected to do provide information that can be used to screen students with drinking problems, using a threshold frequency of at least once a month. These three key points may also be factors of vulnerability to alcohol. The development of management strategies incorporating them is essential.
Acknowledgements
We thank the French Ministry of Education and in particular Mr. S. Carton at the Authority for Higher Education and Integration into the Workplace (Direction Générale de l’Enseignement Supérieur et de l’Insertion Professionnelle-DGESIP). We are grateful to the Conference of University Presidents (Conférence des Présidents d’Université-CPU) and extend special thanks to Mme C. Marseault. We thank Dr Pascal Courty and Dr Michel Zorman.
The surveys were funded by the Ministerial Agency against Drug Abuse and Addictive Behaviour (Mission Interministérielle de Lutte contre les Drogues et les Conduites Addictives-MILDECA).
The author declares that there is no conflict of interest.
Footnotes
Authors’ contributions
JH, AP, VM, SM and LG developed the protocol of the study. JH and SL performed the statistical analysis. All authors interpreted the results. MB, ADL, GB and LG wrote the article, the other authors read it and made revisions for significant content. All authors had full control of the content of the article.
References
- [1].Hingson R, Heeren T, Winter M, Wechsler H. Magnitude of alcohol-related mortality and morbidity among U.S. college students ages 18-24: changes from 1998 to 2001. Annu Rev Public Health 2005;26:259-79. [DOI] [PubMed] [Google Scholar]
- [2].Hingson RW, Zha W, Weitzman ER. Magnitude of and trends in alcohol-related mortality and morbidity among U.S. college students ages 18-24, 1998-2005. J Stud Alcohol Drugs Suppl 2009;12-20. [DOI] [PMC free article] [PubMed] [Google Scholar]
- [3].Saewyc EM, Brown D, Plane M, Mundt MP, Zakletskaia L, Wiegel J, Fleming MF. Gender differences in violence exposure among university students attending campus health clinics in the United States and Canada. J Adolesc Health Off Publ Soc Adolesc Med 2009;45:587-94. [DOI] [PMC free article] [PubMed] [Google Scholar]
- [4].Northcote J, Livingston M. Accuracy of self-reported drinking: observational verification of « last occasion » drink estimates of young adults. Alcohol Alcohol Oxf Oxfs 2011;46:709-13. [DOI] [PubMed] [Google Scholar]
- [5].Garnett C, Crane D, West R, Michie S, Brown J, Winstock A. Normative misperceptions about alcohol use in the general population of drinkers: a cross-sectional survey. Addict Behav 2015;42:203-6. [DOI] [PMC free article] [PubMed] [Google Scholar]
- [6].Cunningham JA, Neighbors C, Wild TC, Humphreys K. Normative misperceptions about alcohol use in a general population sample of problem drinkers from a large metropolitan city. Alcohol Alcohol Oxf Oxfs 2012;47:63-6. [DOI] [PMC free article] [PubMed] [Google Scholar]
- [7].Wild TC. Personal drinking and sociocultural drinking norms: a representative population study. J Stud Alcohol 2002;63:469-75. [DOI] [PubMed] [Google Scholar]
- [8].American College Health Association. The ACHA-National College Health Assessment II survey- Spring 2015 Reference Group Executive Summary. American College Health Association; 2015. p. 20. [Google Scholar]
- [9].Neighbors C, Dillard AJ, Lewis MA, Bergstrom RL, Neil TA. Normative misperceptions and temporal precedence of perceived norms and drinking. J Stud Alcohol 2006;67:290-9. [DOI] [PMC free article] [PubMed] [Google Scholar]
- [10].Kypri K, Langley JD. Perceived social norms and their relation to university student drinking. J Stud Alcohol 2003;64:829-34. [DOI] [PubMed] [Google Scholar]
- [11].Cortés-Tomás M-T, Giménez-Costa J-A, Motos-Sellés P, Sancerni-Beitia M-D. Different versions of the Alcohol Use Disorders Identification Test (AUDIT) as screening instruments for underage binge drinking. Drug Alcohol Depend 2016;158:52-9. [DOI] [PubMed] [Google Scholar]
- [12].Blank M-L, Connor J, Gray A, Tustin K. Screening for hazardous alcohol use among university students using individual questions from the alcohol use disorders identification test-consumption. Drug Alcohol Rev 2015; April 13. doi: 10.1111/dar.12272. [Epub ahead of print]. [DOI] [PubMed] [Google Scholar]
- [13].Cortés-Tomás M-T, Giménez-Costa J-A, Motos-Sellés P, Sancerni-Beitia M-D. Different versions of the Alcohol Use Disorders Identification Test (AUDIT) as screening instruments for underage binge drinking. Drug Alcohol Depend 2016;158:52-9. [DOI] [PubMed] [Google Scholar]
- [14].Demartini KS, Carey KB. Optimizing the use of the AUDIT for alcohol screening in college students. Psychol Assess 2012;24:954-63. [DOI] [PMC free article] [PubMed] [Google Scholar]
- [15].Bush K, Kivlahan DR, McDonell MB, Fihn SD, Bradley KA. The AUDIT alcohol consumption questions (AUDIT-C): an effective brief screening test for problem drinking. Ambulatory Care Quality Improvement Project (ACQUIP). Alcohol Use Disorders Identification Test. Arch Intern Med 1998;158:1789-95. [DOI] [PubMed] [Google Scholar]
- [16].Hibell B, Guttormsson U, Ahlström S, Balakireva O, Bjarnason T, Kokkevi A, Kraus L. The 2011 ESPAD Report. Substance use among students in 36 European Countries. The Swedish Council for Information on Alcohol and Other Drugs (CAN); 2011. p. 394. [Google Scholar]
- [17].La santé mentale des jeunes en insertion [Internet]. [cité 11 mars 2016]. Disponible sur: http://docplayer.fr/6496053-La-sante-mentale-des-jeunes-en-insertion.html.
- [18].Office Français des Drogues et Toxicomanies. Cannabis, alcool, tabac et autres drogues à la find e l’adolescence: usages et évolutions récentes ESCAPAD 2003. OFDT; - Paris: 2004;4. [Google Scholar]
- [19].Richard J-B, Palle C, Guignard R, Nguyen-Thanh V, Beck F. Arwidson. La consommation d’alcool en France en 2014. Evolutions. 2015;6. [Google Scholar]
- [20].Mayfield D, McLeod G, Hall P. The CAGE questionnaire: validation of a new alcoholism screening instrument. Am J Psychiatry 1974;131:1121-3. [DOI] [PubMed] [Google Scholar]
- [21].Roux BL, Rouanet H. Geometric data analysis: from correspondence analysis to structured data analysis [Internet]. Springer; Netherlands; 2005. [cité 9 févr 2018]. Disponible sur: //www.springer.com/gp/book/9781402022357. [Google Scholar]
- [22].kass80.pdf [Internet]. [cité 9 févr 2018]. Disponible sur: http://www4.stat.ncsu.edu/~dickey/Analytics/Datamine/Reference%20Papers/kass80.pdf.
- [23].Greenacre M, Blasius J. Multiple Correspondence Analysis and Related Methods [Internet]. CRC Press; 2006. [cité 9 févr 2018]. Disponible sur: https://www.crcpress.com/Multiple-Correspondence-Analysis-and-Related-Methods/Greenacre-Blasius/p/book/9781584886280. [Google Scholar]
- [24].European Commission. EU citizens’ attitudes towards alcohol [Internet]. 2010. p. 129 Report No.: 331. Disponible sur: http://ec.europa.eu/public_opinion/archives/eb_special_339_320_en.htm.
- [25].Richard J-B, Beck F, Spilka F. Alcohol consumption among young adults (18-25 years) in 2010 in France: specificities and trends since 2005. Bull Epidémiologique Hebd 2013;16-17. [Google Scholar]
- [26].American College Health Association. American College Health Association- National College Health Assessment Spring 2014 Reference Group Executive Summary. 2014. p. 19 pages. [Google Scholar]
- [27].Johnston LD, O’Malley PM, Bachman JG, Schulenberg JE, Miech RA. Monitoring the Future national survey results on drug use, 1975-2013: Volume II, college students and adults ages 19-55. Ann Arbor: Institute for Social Research, The University of Michigan; 2014. [Google Scholar]
- [28].Wilson GB, Lock CA, Heather N, Cassidy P, Christie MM, Kaner EFS. Intervention against excessive alcohol consumption in primary health care: a survey of GPs’ attitudes and practices in England 10 years on. Alcohol Alcohol Oxf Oxfs 2011;46:570-7. [DOI] [PMC free article] [PubMed] [Google Scholar]
- [29].Blanquet M, Peyrol F, Morel F, Morge A, Maradeix B, Gerbaud L, Llorca PM. Prévalence du mésusage de l’alcool et attitudes des médecins libéraux. Alcoologie et Addictologie 2015;37:105-13. [Google Scholar]
- [30].Geisner IM, Varvil-Weld L, Mittmann AJ, Mallett K, Turrisi R. Brief web-based intervention for college students with comorbid risky alcohol use and depressed mood: does it work and for whom? Addict Behav 2015;42:36-43. [DOI] [PMC free article] [PubMed] [Google Scholar]
- [31].Georgie J M, Sean H, Deborah M C, Matthew H, Rona C. Peer-led interventions to prevent tobacco, alcohol and/or drug use among young people aged 11-21 years: a systematic review and meta-analysis. Addict Abingdon Engl 2016;111:391-407. [DOI] [PMC free article] [PubMed] [Google Scholar]
- [32].Robertson-Boersma D, Butt P, Dell CA. Reflections on How a University Binge Drinking Prevention Initiative Supports Alcohol Screening, Brief Intervention, and Referral for Student Alcohol Use. Yale J Biol Med 2015;88:339-46. [PMC free article] [PubMed] [Google Scholar]
- [33].Ridout B, Campbell A. Using Facebook to deliver a social norm intervention to reduce problem drinking at university. Drug Alcohol Rev 2014;33:667-73. [DOI] [PubMed] [Google Scholar]
- [34].Scaglione NM, Mallett KA, Turrisi R, Reavy R, Cleveland MJ, Ackerman S. Who will experience the most alcohol problems in college? The roles of middle and high school drinking tendencies. Alcohol Clin Exp Res 2015;39:2039-46. [DOI] [PMC free article] [PubMed] [Google Scholar]