

Summary
Introduction
The consumption of energy drinks (ED) and ginseng by young people to enhance their mental and physical performance has become widespread. Reported side-effects of ED have raised doubts regarding their safety. This cross-sectional study investigates the phenomenon.
Methods
An anonymous questionnaire was administered to a representative sample of Verona university students. The resulting data were analyzed with Excel 2013, STATA 13 software.
Results
ED and ginseng consumption was reported by 38.6% and 37.4% of the students, respectively. More than 70% of ED and ginseng users were 18 to 22 years old. Excluding non-responders, ED consumers were mostly males (51.8% vs 33.0%), contrary to ginseng consumers (females 40.4% vs 30.9%). Being a working student was significantly positively associated both to EDs (OR 1.5) and ginseng use (OR 1.4). The most frequently reported academic and other reasons for ED use were: “to study longer” (47.5%), and “to socialize” (29.1%). The most often used combinations were ED containing alcohol (65.6%) and ginseng-coffee beverages (71.8%).
Conclusions
The diffusion of ED and ginseng consumption warrants prevention and monitoring measures, and deserves further analysis.
Keywords: Energy Drink, Ginseng, Behavior, University Students, Italys
Introduction
Energy drinks (ED) are beverages that contain caffeine (in the range of 50 to 550 mg per can or bottle), taurine, l-carnitine, carbohydrates, glucuronolactone, vitamins, and herbal supplements such as ginseng and guarana [1]. They are generally known to stimulate cognitive functions and alertness [2]. With the exception of the caffeine, glucose and guarana extracts, there is an overwhelming lack of evidence to support claims that any of the other ingredients in ED contribute to improving cognitive functioning (an effect attributed especially to taurine) or physical performance [3]. The introduction of a now famous ED in Austria in 1987 was followed by an aggressive marketing campaign, which laid the foundations for the more recent upward trend in ED consumption [4]. Sales of ED were estimated to be worth over 12.5 billion USD in 2012, after a 60% growth recorded from 2008 to 2012 [5].
Ginseng is a generic term commonly used to describe a number of different botanical compounds that belong to the genus Panax [6]. In Korea, China, the Himalayan region, Vietnam, Japan and Northern America (regions where it has grown in the wild for thousands of years), ginseng has always been a popular herbal remedy believed to have beneficial effects on global health. Ginseng proponents suggest that it can enhance mental and physical vigor, ease childbirth, and treat inflammatory diseases [7]. The Istituto Superiore di Sanità (Italian National Health Institute) Working Group on smoking, alcohol consumption and drug use, ranks ginseng among the so-called smart drugs, considered as all the natural or artificial compounds not prohibited by existing laws on illicit drugs that may contain active substances with suspected or known psychoactive properties [8].
A study conducted in 2011 [9] found that 48.3% of 439 students attending a Turkish university had used ED at least once in their life, while the prevalence rate of ongoing users was 33%. At another Turkish university, the prevalence rate of ginseng use in 2005 [10] had only been about 6%. The prevalence rates of ED use among university students range from 36.4% to 70.1% in Northern America [11, 12], and are around 38% in Central-South America [13, 14]. As for ginseng consumption, an American study [15] found that 3.3% of the surveyed population had used the herb in the previous week. There are still very few data on the prevalence rates of ginseng use available in literature.
In 2011, the European Food Safety Authority (EFSA) commissioned a study to gather ED consumption data in 16 countries of the European Union. The survey showed that 68% of adolescents (10-18 years old), 30% of adults (18-65 years old), and 18% of children (3-10 years old) had consumed ED at least once in the previous year. The average consumption was 2 liters a month in adults, 2.1 in adolescents, and 0.49 in children [5].
Italy has far from negligible prevalence rates of ED consumption too. In 2012, 41% of 15- to 19-year-old Italian students had used ED, especially among males (54%) [16]. A multicenter survey conducted on Italian adolescents and young adults (14 to 35 years old) found that 20.1% of respondents had used ED at least once in their life [17]. According to another Italian survey, 56.9% of students attending the Faculty of Medicine in Messina used ED [18]. ED consumption is often justified as a way to stay awake, increase energy levels, boost performance during physical exercise, or remain concentrated while studying, or it is drunk together with alcohol while partying [14, 16, 19, 20]. The tendency to mix ED with alcohol, especially at parties [14, 16, 18-20], can also lead to other risk-taking behavior, such as smoking tobacco and cannabis [21].
The adverse effects of ED consumption generally relate to sympathomimetic effects due to an excessive intake of caffeine [22], i.e. irritability, anxiety, restlessness, insomnia, gastrointestinal upsets, tremors, tachycardia, psychomotor agitation and, in rare cases, death [4]. Other side effects described as being related to ED use are “jolt and crash episodes”, headaches, heart palpitations [20], hypertonia (due to vasoconstriction), and bronchial dilation [23, 24]. One publication summarized the demonstrated psychological effects of ED on cognitive functions, mood, sleep, decision-making, and their overall impact on well-being and quality of life [12]. ED consumption is also thought to have a role in the epidemic of obesity and type 2 diabetes, due to the combination of sucrose and caffeine possibly altering the metabolic pathways, and to insulin resistance possibly being induced by caffeine acting as an adenosine receptor antagonist [21, 25-27].
In addition, the misguided conviction of being less subject to the effects of alcohol when it is mixed with an ED prompts individuals to drive without being fully aware of the real risk of road accidents [5]. This can also be interpreted as an adverse effect of people’s inadequate knowledge about ED.
In fact, the proportion of individuals aware of the health-related risks of ED was far lower (57.4%) than the same individuals’ perception of risks related to alcohol assumption (92.9%) [17].
The adverse effects of ginseng are due to a complex mix of numerous potentially bioactive constituents (ginsenosides) [7] and include hypertension, irritability, insomnia, and skin rash [28]. There is little evidence to support its effect in raising blood pressure [29]. Preliminary non-randomized controlled studies have suggested a possible lipid profile improving effect [29].
The aim of the present study was to investigate ED and ginseng consumption in a representative sample of students attending university in north-east Italy.
Materials and methods
This cross-sectional study was conducted during the 2014-2015 academic year and involved students on Bachelor’s (three-year) and Master’s (six-year) degree courses in health care at a university of Verona (Northern Italy). The Bachelor’s (BSc) degree students were attending courses on: Biomedical Laboratory Techniques, Cardiovascular Perfusion Techniques, Dental Hygiene, Imaging and Radiotherapy Techniques, Midwifery, Nursing, Physiotherapy, Psychiatric Rehabilitation Techniques, Speech and Language Therapy; the Master’s degree (MSc) students sampled were studying Medicine and Dentistry.
Data were collected by means of an anonymous multiple-choice questionnaire administered to BSc and MSc students attending the 1st and 3rd years, and to MSc students attending the 5th year. No 3rd-year students of Physiotherapy, Dental Hygiene and Psychiatric Rehabilitation Techniques were sampled because these degree courses were not taking place at the time of our study.
A representative number of students was selected according to the number of students enrolled in the investigated degree courses.
The validated questionnaire obtained information on students’ socio-demographic characteristics, such as age, sex, degree course, occupation (working students vs. non-working/unemployed student), nationality, Italian area of residence (Northern vs Central-Southern Italy). The survey also sought details on the students’ parents, e.g. age, educational level (primary school, secondary school, high school, university), and occupation (self-employed, employee, unemployed, retired, other). The highest educational level achieved by at least one parent was considered as a measure of the family’s level of education, and defined as “low” for primary or secondary school, or “high” for high school or university.
Students were then questioned about their university career and use of ED and ginseng. Considering the frequency of their use in the 6 months prior to the survey, possible answers were: never (0 times), rarely (1-10), sometimes (11-30), often (31-90), or very often (≥ 91 times) in order to evaluate a recent behavioral anamnesis.
Some of the reasons for using ED were related to the academic sphere (e.g. to improve alertness and study longer, concentration while studying, exam performance and attention in classroom). A positive response for at least one of the above reasons was taken as an indication that ED were used for the purpose of cognitive enhancement (CE).
Other possible reasons investigated were: to improve social skills, or performance when driving, practicing sports, or at work.
Some final questions concerned whether ED and/or ginseng were consumed alone or in combination with alcohol, tea, illicit drugs, or medicines.
The data collected from this study were processed in compliance with Italian privacy law (N. 196/2003). All students were over 18 years old (legal age in Italy) and they were assured of the confidentiality of their responses. They were adequately informed about the purposes of the survey and their participation was entirely voluntary.
To ensure a high response rate, the survey was brief, easy to complete (taking less than 15 minutes) and administered at the beginning of a lecture. All questionnaires were collected immediately and the information was entered in a database.
The prevalence rates of the socio-demographic and academic characteristics of the different groups were calculated differently: on the total sample (not recalculated); on the use of ED or ginseng calculated on the total sample; and on the use of ED or ginseng by students’ working status. The combined rates therefore do not always reach 100%.
STATISTICAL AND DATA ANALYSIS
The data processing and the calculation of the confidence intervals (95%) for ED and ginseng users were done with Excel 2013 and STATA 13.
The statistical analyses were conducted using Fisher’s exact test or the chi-square test with Yates’s correction, assuming significance for p < 0.05.
Multiple logistic regressions models (MLRM) were also performed to evaluate the following variables as possible predictors for EDs or ginseng use by students (all sample, working or not working students): male gender, being a Bachelor’s degree student, age (years), coming from the North of Italy and parents’ high educational level. As outcomes we tested the use of the following substances: EDs alone, EDs mixed with alcohol, ginseng alone, ginseng coffee.
Results
ANALYSIS OF THE WHOLE SAMPLE OF 899 STUDENTS INVESTIGATED
A total of 1107 questionnaires were administered and the response rate was 89.4%. Of the 990 questionnaires completed, 899 had been compiled properly and formed the object of our analysis.
The survey showed that 38.6% (95% CI 35.4-41.9%, n = 347) and 37.4% (95% CI 34.2-40.6%, n = 336) of the total sample of 899 students had used ED and ginseng, respectively.
The age of the sample ranged between 18 and 39 years (mean 21 years). Males accounted for 30.3% (n = 272) of the sample, females for 68.8% (n = 619), and 0.9% did not specify their gender (Tabs. I and II).
The students were Italian in 90.3% of cases, while 2.7% were foreigners, and 7.0% did not state their nationality. Most of the students (84.5%) came from Northern Italy (Tabs. I and II).
As shown in Tables I and II, most of MSc students were attending Medicine (23.4%), while most of BSc students were on Nursing courses (47.3%).
Tab. I.
Distribution of total sample by working status and ED use in relation to socio-demographic characteristics and university course (prevalence rate).
| Total sample | Non-working students | Working students | ||||||
|---|---|---|---|---|---|---|---|---|
| Pop. (899) |
ED users (347) |
Pop. (678) |
ED users (253) | Pop. (197) | ED users (87) | |||
| Variables | A(%) | B (%) | B (%) | B (%) | C (%) | B (%) | B (%) | C (%) |
| Gender | ||||||||
| Female | 68.8 | 33.0° | 75.4 | 23.6^ | 71.6 | 22.1 | 8.7 | 26.5 |
| Male | 30.3 | 51.8° | 76.5 | 38.6^ | 74.5 | 22.1 | 12.1 | 23.4 |
| Non-responders | 0.9 | 25 | 37.5 | 25 | 100 | 0 | 0 | 0 |
| Age (years)* | ||||||||
| 18-22 | 74.9 | 78.7 | 78 | 81.8 | 81.8 | 66 | 70.1 | 70.1 |
| 23-27 | 17.7 | 19 | 16.1 | 16.2 | 16.2 | 23.9 | 26.4 | 26.4 |
| ≥28 | 4.8 | 0.9 | 3.9 | 0.4 | 0.4 | 8.1 | 2.3 | 2.3 |
| Non-responders | 2.6 | 1.4 | 2 | 1.6 | 1.6 | 2 | 1.1 | 1.1 |
| Area of residence | ||||||||
| Northern Italy | 84.5 | 39 | 75.9 | 27.8# | 71.3 | 22.9§ | 10.5∞ | 27 |
| Central-Southern Italy | 10.5 | 43.6 | 83.0§ | 38.3# | 87.8 | 12.8 | 3.2∞ | 7.3 |
| Non-responders | 5 | 21.7 | 52.2 | 13 | 60 | 23.9 | 8.7 | 40 |
| Degree course | ||||||||
| Medicine | 23.4 | 31.9 | 83.8 | 26.2 | 82.1 | 15.7 | 5.2 | 16.4 |
| Dentistry | 5.9 | 54.7 | 81.1 | 41.5 | 75.9 | 13.2 | 11.3 | 20.7 |
| Nursing | 47.3 | 40.7 | 70.8 | 27.5 | 67.6 | 24.9 | 12 | 29.5 |
| Biomedical Laboratory Techniques | 5.2 | 51.1 | 85.1 | 42.6 | 83.3 | 14.9 | 8.5 | 16.7 |
| Speech and Language Therapy | 4.2 | 23.7 | 73.7 | 13.2 | 55.6 | 23.7 | 10.5 | 44.4 |
| Midwifery | 4.2 | 26.3 | 78.9 | 23.7 | 90 | 21.1 | 2.6 | 10 |
| Imaging-Radiotherapy Techniques | 3.8 | 50 | 67.6 | 35.3 | 70.6 | 32.4 | 14.7 | 29.4 |
| Physiotherapy | 3 | 48.1 | 63 | 33.3 | 69.2 | 37 | 14.8 | 30.8 |
| Cardiovascular Perfusion Techniques | 1.3 | 0 | 100 | 0 | 0 | 0 | 0 | 0 |
| Dental Hygiene | 1.1 | 30 | 60 | 30 | 100 | 30 | 0 | 0 |
| Psychiatric Rehabilitation Techniques | 0.6 | 40 | 40 | 20 | 50 | 60 | 20 | 50 |
Pop.: population; A: Non-recalculated prevalence rate; B: Prevalence rate calculated on total sample; C: Prevalence rate calculated on ED users
* age reported as non-recalculated prevalence rate
°; ^; §; #; ∞: p < 0.05.
Tab. II.
Distribution of total sample by working status and ginseng use in relation to socio-demographic characteristics and university course (prevalence rate).
| Total sample | Non-working students | Working students | ||||||
|---|---|---|---|---|---|---|---|---|
| Pop. (899) | Ginseng users (336) | Pop. (678) | Ginseng users (246) | Pop. (197) | Ginseng users (83) | |||
| Variables | A(%) | B (%) | B (%) | B (%) | C (%) | B (%) | B (%) | C (%) |
| Gender | ||||||||
| Female | 68.8 | 40.4* | 75.4 | 28.9 | 71.6 | 22.1 | 29.6' | 73.5 |
| Male | 30.3 | 30.9* | 76.5 | 24.6 | 79.8 | 22.1 | 20.6' | 67.5 |
| Non-responders | 0.9 | 25.0 | 37.5 | 0.0 | 0.0 | 0.0 | 25.0 | 100.0 |
| Age (years)** | ||||||||
| 18-22 | 74.9 | 75.3 | 78.0 | 75.0 | 75.0 | 66.0 | 78.0 | 78.0 |
| 23-27 | 17.7 | 19.0 | 16.1 | 18.7 | 18.7 | 23.9 | 20.5 | 20.5 |
| ≥28 | 4.8 | 2.7 | 3.9 | 2.8 | 2.8 | 8.1 | 2.4 | 2.4 |
| Non-responders | 2.6 | 3.0 | 2.0 | 3.3 | 3.3 | 2.0 | 0.0 | 0.0 |
| Area of residence | ||||||||
| Northern Italy | 84.5 | 38.2 | 75.9 | 27.9 | 72.4 | 22.9§ | 10.0& | 26.2 |
| Central-Southern Italy | 10.5 | 30.9 | 83.0§ | 26.6 | 89.7 | 12.8 | 3.2& | 10.3 |
| Non-responders | 5.0 | 37.0 | 52.2 | 19.6 | 52.9 | 23.9 | 8.7 | 23.5 |
| Degree course | ||||||||
| Medicine | 23.4 | 39.5 | 83.8 | 31.0 | 78.3 | 15.7 | 8.1 | 20.5 |
| Dentistry | 5.9 | 35.8 | 81.1 | 30.2 | 84.2 | 13.2 | 5.7 | 15.8 |
| Nursing | 47.3 | 34.6 | 70.8 | 23.5 | 68.0 | 24.9 | 9.6 | 27.9 |
| Biomedical Laboratory Techniques | 5.2 | 51.1 | 85.1 | 40.4 | 79.2 | 14.9 | 10.6 | 20.8 |
| Speech and Language Therapy | 4.2 | 52.6 | 111 | 36.8 | 70.0 | 23.7 | 15.8 | 30.0 |
| Midwifery | 4.2 | 47.4 | 78.9 | 34.2 | 72.2 | 21.1 | 13.2 | 27.8 |
| Imaging-Radiotherapy Techniques | 3.8 | 32.4 | 67.6 | 26.5 | 81.8 | 32.4 | 5.9 | 18.2 |
| Physiotherapy | 3.0 | 33.3 | 63.0 | 25.9 | 77.8 | 37.0 | 7.4 | 22.2 |
| Cardiovascular Perfusion Techniques | 1.3 | 0.0 | 100.0 | 0.0 | 0.0 | 0.0 | 0.0 | 0.0 |
| Dental Hygiene | 1.1 | 20.0 | 60.0 | 10.0 | 50.0 | 30.0 | 10.0 | 50.0 |
| Psychiatric Rehabilitation Techniques | 0.6 | 60.0 | 40.0 | 40.0 | 66.7 | 60.0 | 20.0 | 33.3 |
Pop.: population; A: Non-recalculated prevalence rate; B: Prevalence rate calculated on total sample; C: Prevalence rate calculated on ginseng users
** age reported as non-recalculated prevalence rate
*, &,', §: p < 0.05.
Figure 1 shows the socio-demographic features of the students’ 1,798 parents. Not all students completing the questionnaire provided all the required information on both parents, in which case they were referred to as “non-responders”. Most parents (50.2%) were 51-60 years old, many had a high educational level (46.9%), and most were in employment (74.3%).
Fig. 1.
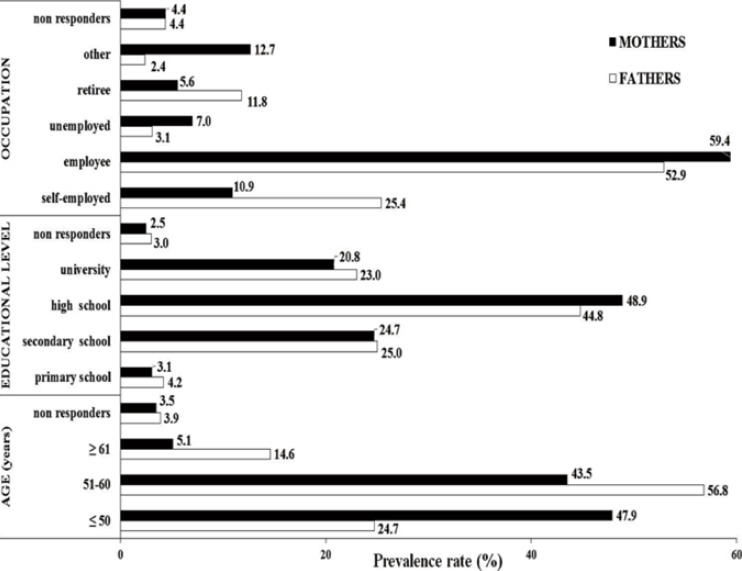
Socio demographic features of students’ parents. (Prevalence rate).
No statistically significant association emerged between a low family educational level and the students’ use of either ED (Fisher’s exact test) or ginseng (chi-square with Yates’ correction).
ANALYSIS AND COMPARISON OF SAMPLED STUDENTS BY WORKING STATUS
Tables I and II shows the distribution of the sample grouped as working students (21.9%) and non-working students (75.4%) in relation to their ED and ginseng use, gender, age bracket, place of residence, and type of university course. Only 2.7% of the students did not report their employment status.
The two groups were comparable in terms of gender composition (p = ns, Fisher’s exact test). The most prevalent age range in both groups was between 18 and 22 years (78.0% of the non-working students, and 66.0% of the working students). Considering the data calculated on the total sample, the non-working students were mostly from Central-Southern Italy (83.0%), while the working students were largely from Northern Italy (22.9%) and this difference was statistically significant (p < 0.05, Fisher’s exact test).
The courses attended by the highest percentage of the non-working students in our sample were: Medicine (83.8%) among the MSc students, and Cardiovascular Perfusion Techniques (100.0%) among the BSc students. The highest proportions of the working students were studying Medicine for MSc (15.7%), and Psychiatric Rehabilitation Techniques for BSc (60.0%).
ANALYSIS OF ED AND GINSENG USERS
The main features of ED and ginseng users are as follows (Tabs. I and II):
ED consumers differed by gender (33.0% of the female sample vs 51.8% of the male sample; p < 0.05, Fisher’s exact test), and so did ginseng users (40.4% of the female sample vs 30.9% of the male sample; p < 0.05, Fisher’s exact test).
More than 70% of the ED and ginseng users were between 18 and 22 years old. In this age group the percentage of ED users was significantly higher than among the older students (40.6% vs 34.2%, p < 0.05, Fisher’s exact test). There was no statistically significant difference in the percentage of ginseng consumers between the students aged 18-22 years (37.6%) and the older students (36.1%) (p = ns, Fisher’s exact test).
Most of the ED users were from Central-Southern Italy (43.6%), while most of the ginseng users were from Northern Italy (38.2%); for both ED and ginseng use there was no significant difference relating to their area of residence (p = ns, Fisher’s exact test).
In our sample, 25.1% of ED users and 24.7% of ginseng users were working students. Among all the working students in the sample, the prevalence rates of ED and ginseng consumption were 44.2% and 42.1%, respectively. Instead, among all non-working students, the prevalence rates of ED and ginseng consumption were 37.3% and 36.3%, respectively. According to multiple logistic regression model (MLRM), being a working student was significantly (p < 0.05) positively associated to EDs use (OR 1.5) and to ginseng use (OR 1.4), as shown in Table III.
The courses attended by the highest percentage of the ED consumers were: Dentistry (54.7%) among the MSc; and Biomedical Laboratory Techniques (51.1%) among the BSc. The highest proportions of ginseng users were studying Medicine for MSc (39.5%), or Psychiatric Rehabilitation Techniques for BSc (60.0%).
Tab. III.
Multiple Logistic Regression Models for EDs or ginseng s use predictors.
| Predictors Outcomes of the models | Male gender | Age (years) | Coming from North of Italy | Being a Bachelor’s degree student | Being a working student | Parents’ high educational level |
|---|---|---|---|---|---|---|
|
EDs use by all students (n = 899)
* (Pseudo-R2= 0.0447) |
OR 2.3* (1.7-3.2) | OR 0.9* (0.8-0.9) | OR 1.0 (0.6-1.6) | OR 1.4* (1.0-1.9) | OR 1.5* (1.0-2.1) | OR 0.9 (0.6-1.3) |
|
Ginseng use by all students (n = 899)
* (Pseudo-R2 = 0.0121) |
OR 0.7* (0.5-0.9) | OR 1.0 (0.9-1.0) | OR 1.1 (0.7-1.8) | OR 0.8 (0.6-1.2) | OR 1.4* (1.0-2.0) | OR 1.0 (0.7-1.4) |
|
EDs use by working students (n = 197)
* (Pseudo-R2 = 0.0440) |
OR 1.9* (1.0-3.7) | OR 0.9* (0.8-1.0) | OR 3.1 (0.8-12.5) | OR 1.4 (0.7-3.1) | -^ | OR 1.3 (0.6-2.6) |
|
Ginseng use by working students (n = 197)
* (Pseudo-R2 = 0.0838) |
OR 0.3* (0.2-0.7) | OR 0.9* (0.8-1.0) | OR 2.0 (0.5-8.1) | OR 0.6 (0.3-1.4) | -^ | OR 1.2 (0.5-2.5) |
|
EDs use by not working students (n = 678)
* (Pseudo-R2 = 0.0504) |
OR 2.5* (1.7-3.6) | OR 0.8* (0.8-0.9) | OR 0.8 (0.5-1.4) | OR 1.4 (1.0-2.0) | -^ | OR 0.8 (0.5-1.2) |
|
Ginseng use by not working students (n = 678) (Pseudo-R2 = 0.0025) |
OR 0.8 (0.5-1.2) | OR 1.0 (1.0-1.1) | 0R1.1 (0.6-1.9) | OR 0.9 (0.6-1.3) | -^ | OR 0.9 (0.6-1.5) |
|
EDs use to improve alertness and study longer by all students (n = 899)
* (Pseudo-R2 =0.0321) |
OR 2.2* (1.5-3.2) | OR 0.9* (0.8-1.0) | OR 1.2 (0.6-2.2) | OR 1.7* (1.1-2.6) | OR 1.3 (0.8-2.0) | OR 0.9 (0.8-2.0) |
|
EDs plus alcohol use by all students (n = 899)
* (Pseudo-R2= 0.0574) |
OR 2.9* (2.0-4.1) | OR 0.9* (0.8-0.9) | OR 0.8 (0.5-1.3) | OR 1.3 (0.9-1.9) | OR 1.4 (1.0-2.1) | OR 0.8 (0.5-1.2) |
|
Ginseng-coffee use by all students (n = 899)
* (Pseudo-R2 =0.0163) |
OR 0.6* (0.4-0.9) | OR 1.0 (0.9-1.0) | 0R1.2 (0.7-2.2) | OR 0.7 (0.5-1.1) | OR 1.5* (1.0-2.1) | OR1.1 (0.7-1.7) |
* p < 0.05
-^ Not evaluated.
No statistically significant differences emerged relating to the type of degree course attended by or ginseng users (MSc 38.8% vs BSc 36.8%; p = ns, Fisher’s exact test).
Instead, according to MLRM, being a Bachelor’s degree student was significantly (p < 0.05) positively associated to EDs use (OR 1.4) (Tab. III).
Figure 2 shows the prevalence rates of ED and ginseng users in the various years of the different degree courses. Among the students of Medicine, ED use decreased from the first year (33.7%) to the fifth (28.3%), while ginseng consumption rose from the first year (38.5%) to the third (47.8%), then decreased by the fifth year (35.0%).
Fig. 2.
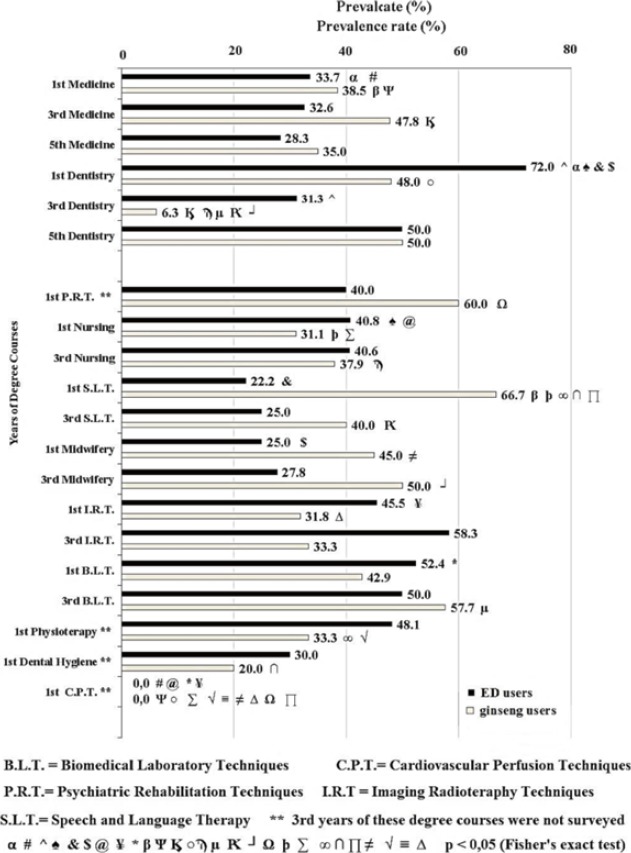
Distribution of ED and ginseng users by degree and year of course. (Prevalence rate).
As for the students of Dentistry, ED use dropped significantly from the first year (72.0%) to the third (31.3%), (p < 0.05, Fisher’s exact test), then increased again by the fifth (50.0%). The same trend was seen for ginseng consumers, with 48.0% in the 1st year, 6.3% in the 3rd, and 50.0% in the fifth.
In the first year of BSc, ED use ranged from 52.4% (in Biomedical Laboratory Techniques) to 22.2% (in Speech and Language Therapy), while ginseng use ranged from 66.7% (in Speech and Language Therapy) to 20.0% (in Dental hygiene).
In the 3rd year of BSc, ED use ranged from 58.3% (in Imaging-Radiotherapy Techniques) to 25.0% (in Speech and Language Therapy), while ginseng consumption ranged from 57.7% (in Biomedical Laboratory Techniques) to 33.3% (in Imaging-Radiotherapy Techniques).
Overall, the differences in the prevalence rates of ED and ginseng consumption by year of each degree course were never statistically significant (p = ns, Fisher’s exact test), except between the 1st and 3rd years of Dentistry for both ED and ginseng, and between the 3rd and 5th years of Dentistry for ginseng alone (p < 0.05, Fisher’s exact test). ED and ginseng consumption was also compared among students in the same years of different degree courses.
ANALYSIS OF WORKING STUDENTS ENGAGING IN ED OR GINSENG USE
The population of working students using ED revealed no statistically significant differences by distribution between BSc (44.6%) and MSc (42.5%), (p = ns, Fisher’s exact test). On the other hand, there was a statistically significant difference between working students using ED aged 18-22 years (46.9%) and those aged 23 or more (39.7%), (p < 0.05, Fisher’s exact test). Male gender was significantly positively (OR 1.9, p < 0.05, MLRM) associated with EDs use by working students (Tab. III).
The population of working students using ginseng was not homogeneous by gender (29.6% females vs 20.6% males; p < 0.05, Fisher’s exact test). Male gender (OR 0.3, p < 0.05, MLRM) and age (OR 0.9. p < 0.05, MLRM) were significantly negatively associated to ginseng use by this type of students (Tab. III).
ANALYSIS OF NON-WORKING STUDENTS ENGAGING IN ED OR GINSENG USE
The population of non-working students using ED differed statistically by gender (23.6% females vs 38.6% males; p < 0.05, Fisher’s exact test), but not by type of degree courses (35.2% MSc vs 38.3% BSc; p = ns, Fisher’s exact test).
Age (OR 0.8. p < 0.05, MLRM) was significantly negatively associated to ginseng use by this type of students (Tab. III).
The population of non-working students using ginseng was homogeneous in terms of gender (28.9% females vs 24.6% males), area of residence (27.9% from Northern and 26.6% from Central-Southern Italy), and MSc (37.0%) vs BSc (36.0%), (p = ns, Fisher’s exact test). The same applied to the age factor, with no statistically significant difference between ginseng users aged 18-22 years (35.0%) and those aged 23 and over (39.3%), (p = ns, Fisher’s exact test).
REASONS FOR SUBSTANCE USE AND THEIR ASSOCIATIONS
Table IV shows the prevalence rates of the reasons for using ED and whether they were used alone or combined with other substances.
Tab. IV.
ED use: reasons for use and associations with other substances (prevalence rate).
| Use in previous 6 months | 1-10 times | 11-30 times | 31-90 times | ≥ 91 times | Total | |
|---|---|---|---|---|---|---|
| Associations with EDs | No | 53.3% | 9.5% | 1.7% | 1.2% | 65.7% |
| Alcohol | 45.2% | 12.4% | 4.9% | 3.1% | 65.6% | |
| Coffee | 9.5% | 2.6% | 0.6% | 0.0% | 12.7% | |
| Tea | 5.2% | 1.2% | 0.9% | 0.0% | 7.3% | |
| Drugs | 2.6% | 2.0% | 0.6% | 0.3% | 5.5% | |
| Medicines | 2.9% | 0.9% | 0.3% | 0.0% | 4.1% | |
| Reasons for ED use: to improve | Alertness and study longer | 38.0% | 6.9% | 2.6% | 0.0% | 47.5% |
| Concentration while studying | 24.2% | 4.9% | 1.7% | 0.0% | 30.8% | |
| Social skills (*) | 21.3% | 4.9% | 1.7% | 1.2% | 29.1% | |
| Sports performance | 19.6% | 2.3% | 1.4% | 0.3% | 23.6% | |
| Exam performance | 13.5% | 1.7% | 2.0% | 0.3% | 17.5% | |
| Driving performance | 8.6% | 2.9% | 0.9% | 0.0% | 12.4% | |
| Attention in classroom | 10.1% | 1.2% | 0.9% | 0.0% | 12.2% | |
| Working performance | 7.8% | 2.6% | 1.4% | 0.0% | 11.8% | |
(*) To socialize (e.g. at parties, disco, bars).
For the sample as a whole (n = 899), the prevalence rate of ED use for at least one ‘academic’ reason was 22.7%, while it was 21.2% for at least one ‘other’ reason; this difference was statistically significant (p < 0.01, Fisher’s exact test).
The most frequently mentioned academic reason for using ED was “to improve alertness and study longer” (47.5%), while the most common other reason was “to socialize, at parties or the disco for instance” (29.1%). Whatever the motives for using ED, the most often reported frequency of their usage was 1-10 times in the previous six months (93.1%).
ED and alcohol emerged as a very common combination (65.6%), comparable with the prevalence rate of ED used alone (65.7%). Only a minority of respondents combined ED with medicines (4.1%), or illicit drugs (5.5%).
As for the prevalence rates of ginseng use, alone or combined with other substances. The most common associations were ginseng with coffee (71.8%), while it was rarely combined with drugs (2.4%). The reported frequency of ginseng usage (alone or combined with other substances) was most often “1-10 times in the previous six months” (80.7%) (Fig. 3).
Fig. 3.
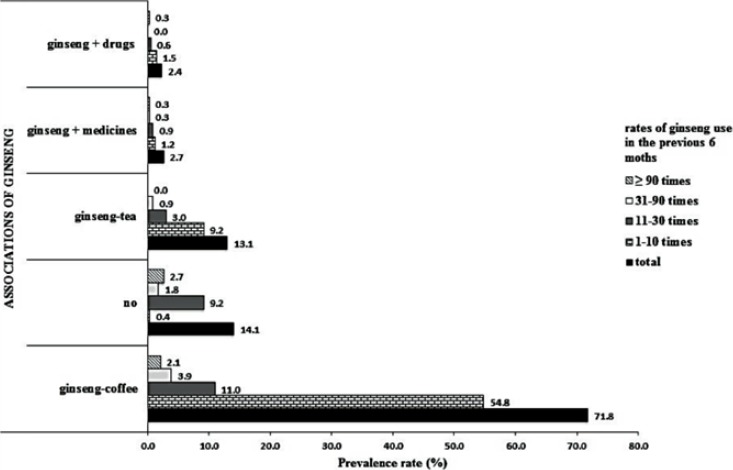
Distribution of ginseng use associated or not with other substances. (Prevalence rate).
Table V shows the socio-demographic characteristics and degree courses of students using ED in order to study longer, and the features of students mixing ED with alcohol or ginseng coffee.
Tab. V.
Socio-demographic features of ED and ginseng users by personal characteristics and university course, reason for usage (to improve alertness and study longer), and association with alcohol or coffee (prevalence rate).
| Variables | ED users (to study longer) (N = 165) | ED+alcohol users (N = 228) | Cinseng+coffee users (N=241) | |||
|---|---|---|---|---|---|---|
| A(%) | B (%) | A(%) | B (%) | A(%) | C (%) | |
| Gender | ||||||
| Female | 15.2* | 46.1 | 19.7° | 59.8 | 29.6^ | 73.5 |
| Male | 26.1* | 50.4 | 38.6° | 74.5 | 20.6^ | 67.5 |
| Non-responders | 00 | 00 | 125 | 50.0 | 25.0 | 100.0 |
| Age (years)** | ||||||
| 18-22 | 80.0 | 80.0 | 80.7 | 80.7 | 74.7 | 74.7 |
| 23-27 | 188 | 188 | 184 | 18.4 | 183 | 183 |
| ≥28 | 06 | 06 | 00 | 00 | 29 | 29 |
| Non-responders | 06 | 06 | 09 | 09 | 41 | 41 |
| Area of residence | ||||||
| Northern Italy | 187 | 48.0 | 25.4 | 65.2 | 27.8 | 73.5 |
| Central-Southern Italy | 191 | 43.9 | 31.9 | 73.2 | 191 | 94.7 |
| Non-responders | 109 | 50.0 | 109 | 50.0 | 26.1 | 70.6 |
| Degree course | ||||||
| Medicine | 152 | 47.8 | 190 | 59.7 | 30.5 | 77.1 |
| Dentistry | 189 | 34.4 | 47.2 | 86.2 | 26.4 | 73.7 |
| Nursing | 193 | 47.4 | 25.4 | 62.4 | 24.7 | 71.4 |
| Biomedical Laboratory Techniques | 25.5 | 50.0 | 34.0 | 66.7 | 27.7 | 59.1 |
| Speech and Language Therapy | 105 | 44.4 | 158 | 66.7 | 39.5 | 75.0 |
| Midwifery | 184 | 70.0 | 184 | 70.0 | 39.5 | 83.3 |
| Imaging and Radiotherapy Techniques | 20.6 | 41.2 | 41.2 | 82.4 | 147 | 45.5 |
| Physiotherapy | 25.9 | 53.8 | 29.6 | 61.5 | 25.9 | 77.8 |
| Cardiovascular Perfusion Techniques | 00 | 00 | 00 | 00 | 00 | 00 |
| Dental Hygiene | 20.0 | 66.7 | 20.0 | 66.7 | 100 | 50.0 |
| Psychiatric | 40.0 | 100.0 | 40.0 | 100.0 | 40.0 | 66.7 |
| Rehabilitation | ||||||
| Techniques | ||||||
A: Prevalence rate calculated on total sample; B = Prevalence rate calculated on ED users; C: Prevalence rate calculated on ginseng users
** age reported as non-recalculated prevalence rate
*; °; ^ = p < 0.05.
The population of students who used ED “to improve alertness and study longer” differed by gender (15.2% of the female sample and 26.1% of the male sample; p < 0.05, Fisher’s exact test), and the majority (80.0%) were 18-22 years old. There was also a statistically significant difference in the proportion of these ED consumers between the younger students 18-22 years old (19.6%) and those aged 23 and over (15.8), (p < 0.05, Fisher’s exact test). Being a Bachelor’s degree student (OR 1.7, p < 0.05, MLRM) was significantly positively associated to EDs use for this reason (Tab. III). On the other hand, they were homogeneous in terms of area of residence (18.7% from Northern, 19.1% from Central-Southern Italy; p = ns, Fisher’s exact test). Finally, this type of ED user was found in similar proportions among the working students (21.8%) and non-working students (17.7%) (p = ns, Fisher’s exact test).
Students mixing ED with alcohol differed significantly by gender (19.7% females vs 38.6% males; p<0.05, Fisher’s exact test), but not by area of residence (25.4% from Northern, 31.9% from Central-Southern Italy; p = ns, Fisher’s exact test). Here again, there was a statistically significant age-related difference, with 80.7% of these ED plus alcohol consumers among the 18- to 22-year-olds, as opposed to 20.8% among the older students (p < 0.05, Fisher’s exact test), but no difference between MSc (24.7%) and BSc students (25.6%), (p = ns, Fisher’s exact test), or between working students (29.2%) and non-working students (25.4%), (p = ns, Fisher’s exact test).
In the population of ginseng-coffee users there were between students aged 18- to 22-year-olds (26.8%) and older students (25.3%), between areas of residence in Northern (27.8%) vs Central-Southern Italy (19.1%), or between students attending MSc (29.7%) vs BSc (25.6%). Ginseng-coffee users did show a statistically significant gender-related difference (29.6% females vs 20.6% males, p < 0.05, Fisher’s exact test). Finally, being a working student (OR 1.5, p < 0.05, MLRM) was significantly positively associated to ginseng-coffee (Tab. III).
Discussion
To our knowledge, this is one of very few studies to have attempted to establish the prevalence of ED and ginseng use by Italian university students. In our sample of 899 students, 38.6% had used ED, and 37.4% had used ginseng in the 6 months prior to answering our questionnaire.
Considering that the age range of our sample of students was 18-28 years (not considering the only two subjects aged 30 and 39 years), the prevalence rate of their ED use is more than twice as high as the figure the EFSA found in Europe for the same age group in 2011 (38.6% vs.15.9%) [5].
Consistently with the findings of a Belgian study [30] conducted on university students aged 19-23, we found no association between families’ educational level and ED or ginseng usage. This would mean that their use is not associated with any specific social patterns, but a broad social phenomenon, particularly among young people [9, 11, 12, 14].
The statistically significant age-related difference emerging in ED use in our sample (with 18- to 22-year-olds using ED far more than older students) is probably because these drinks are readily accessible to children, adolescents, and young adults [31]. The growth in their popularity may be partly attributed to their availability in bars and clubs, where ED have been used as mixers. But nowadays consumers can find pre-mixed alcoholic energy drinks at any local supermarket or grocery store [31]. It would be desirable for the distribution and sale of these products to be regulated.
Our population of ED users confirmed a gender-related trend seen in other studies, with a larger consumption of these drinks by males [14, 16, 30, 32-34]. One possible explanation for this gender disparity comes from Miller’s research [32]: a greater ED consumption among college males would be linked to “jock identity”, conformity to masculine norms, and risk-taking behavior.
Although no statistically significant difference in ED use by area of residence emerged from our analysis, our population was skewed towards Central-Southern Italy (out-of-town students). As seen in another study, this might reflect a tendency to behave differently when far from home and parental control, especially as regards any predisposition towards substance use [32].
On the total sample (n = 899), we found a statistically significant difference between EDs or ginseng or ginseng-coffee use and being a working vs a non-working student, probably due to the higher load of stress experienced by this type of students.
ED consumption was associated with socializing by 29.1% of the users in our sample – a result in line with the findings of another Italian survey, which found a statistically significant association between ED use and going to the disco or other recreational places [17].
Our study confirms that the use of ED mixed with alcohol is becoming increasingly common among youth and young adults [35, 36] (65.7% of the ED users in our sample had mixed ED with alcohol at least once in the previous 6 months). Combining ED with alcoholic beverages would increase the sensation of pleasure, and might reduce the depressant effects and/or increase the excitatory effects of alcohol [37, 18, 38].
The potential risks of associating ED with alcohol include: underestimation of alcoholic drunkenness, excessive diuresis, dehydration, changes in heart rhythm (palpitations, arrhythmias), high blood pressure, neural symptoms (irritability, disturbed sensation, tremors, muscle twitching), gastrointestinal disorders, and worsening depression [39, 40].
Educational campaigns should be conducted on various levels to contrast the massive marketing campaigns of ED manufacturers, which insinuate that ED can improve mental performance without any side effects. It is worth noting that the most often advertised reason for using these drinks “to prolong wakefulness” is reflected in people’s justification for their use, as seen in the literature [11, 41] and in the present study. In actual fact, in stark contrast with this belief, the consequences of using ED include excessive daytime drowsiness and slower reaction times, which nullify the perceived short-term effects [1]. ED generally offer a quick fix for temporary difficulties, but their prolonged use can affect an individual’s quality of life. Their psychological effects may be dose-dependent [1], so heavy consumers should be warned and advised to reduce their frequency of consumption. As the adverse effects of excessive ED use are generally prompted by the high caffeine intake, there should be an evidence-based upper limit for the quantity of caffeine allowable in a single serving of any drink [42]. While the caffeine in ED can have severe implications, adverse effects have also been reported in association with other substances they contain, such as taurine, guarana, and ginseng [39, 40, 43, 44].
An important strength of the present study lies in the large number of participants (899), surveyed by entering university classrooms (an approach that enabled us to provide students with all the information they needed to answer the questionnaire).
The present study also has some aspects that need to be mentioned: there were more women than men, due to the greater female presence at Italian medical schools; most of the respondents were from Northern Italy because of the university’s location, so the results may not be generalizable to all Italian university students; and the data were collected only at a single point in time, whereas a longitudinal study would be more appropriate to support the study’s findings.
Further research is needed, also on the possible adverse effects of ED and ginseng consumption. A multicenter study on a larger sample could also consider even younger people (of school age) and compare them with older groups.
Conclusions
Our study has shown a wide diffusion of EDs and ginseng among the sampled students, in particular among the younger ones and working students. There was a male predominance in the use of ED, and a female one for ginseng. These data point out possible risks both for dependence and acute and chronic health risks related in particular to EDs use/abuse. Therefore, health education programs are suitable: informing peopl – starting from primary school age, also involving children’s parents and general practioners, through the local health services – could raise awareness of EDs health risks.
Aknowledgements
The authors declare that there is no conflicts of interest with manufacturing factories of energy drink and ginseng.
Footnotes
Authors’ contributions
SM: design, organization and supervision of the study. Drafting of the text.
DG: data analysis, participation in the drafting of the article, statistical analysis.
SP: data analysis, participation in the drafting of the article, statistical analysis.
JP: data analysis, participation in the drafting of the article.
AS: preparation and validation of the questionnaire, distribution of the questionnaire, data collection and data entry in the database.
SF: preparation and validation of the questionnaire, distribution of the questionnaire, data collection and data entry in the database.
EC: preparation and validation of the questionnaire.
References
- [1].Ishak WW, Ugochukwu C, Bagot K, Khalili D, Zaky C. Energy drinks: psychological effects and impact on well-being and quality of life - a literature review. Innov Clin Neurosci 2012;9(1):25-34. [PMC free article] [PubMed] [Google Scholar]
- [2].Malik VS, Popkin BM, Bray GA, Després JP, Hu FB. Sugar-sweetened beverages, obesity, type 2 diabetes mellitus, and cardiovascular disease risk. Circulation 2010;121(11):1356-64. doi: 10.1161/CIRCULATIONAHA.109.876185. [DOI] [PMC free article] [PubMed] [Google Scholar]
- [3].McLellan TM, Lieberman HR. Do energy drinks contain active components other than caffeine? Nutr Rev 2012;70(12):730-44. doi: 10.1111/j.1753-4887.2012.00525.x. [DOI] [PubMed] [Google Scholar]
- [4].Reissiga CJ, Straina EC, Griffithsb RR. Caffeinated energy drinks: a growing problem. Available at: http://www.ncbi.nlm.nih.gov/pmc/articles/PMC2735818/pdf/nihms90556.pdf. Accessed in May 2017. [DOI] [PMC free article] [PubMed]
- [5].Zucconi S, Volpato C, Adinolfi F, Gandini E, Gentile E, Loi A, Fioriti L. Gathering consumption data on specific consumer groups of energy drinks. Parma: EFSA; 2013. (External Scientific Report for European Food Safety Authority). Available at: https://www.efsa.europa.eu/en/supporting/pub/en-394. Accessed in May 2017 [Google Scholar]
- [6].Cardinal BJ, Engels HJ. Ginseng does not enhance psychological well-being in healthy, young adults: Results of a double-blind, placebo-controlled, randomized clinical trial. J Am Diet Assoc 2001;101(6):665-70. doi: 10.1016/S0002-8223(01)00165-1. [DOI] [PubMed] [Google Scholar]
- [7].Kitts D, Hu C. Efficacy and safety of ginseng. Public Health Nutr 2000;3(4A):473-85. doi:10.1017/S1368980000000550. [DOI] [PubMed] [Google Scholar]
- [8].Pichini S, Marchei E, Palmi I, Pellegrini M, Pacifici R, Zuccaro P. Smart drugs. Available at: http://www.iss.it/binary/drog/cont/SD_COMPLETO_ridotto.pdf. Accessed in April 2017.
- [9].Attila S, Cakir B. Energy-drink consumption in college students and associated factors. Nutrition 2011;27(3):316-22. doi: 10.1016/j.nut.2010.02.008. [DOI] [PubMed] [Google Scholar]
- [10].Ayranci U, Son N, Son O. Prevalence of nonvitamin, nonmineral supplement usage among students in a Turkish university. BMC Public Health 2005;16;5:47. doi: 10.1186/1471-2458-5-47. [DOI] [PMC free article] [PubMed] [Google Scholar]
- [11].Gallucci AR, Ryan J. Martin, Morgan Grant B. The consumption of energy drinks among a sample of college students and college student athletes. J Community Health 2016;41:109-18. doi: 10.1007/s10900-015-0075-4. [DOI] [PubMed] [Google Scholar]
- [12].Pettit ML, DeBarr KA. Perceived stress, energy drink consumption, and academic performance among college students. J Am Coll Health 2011;59(5):335-41. doi: 10.1080/07448481.2010.510163. [DOI] [PubMed] [Google Scholar]
- [13].Ballistreri MC, Corradi-Webster CM. Consumption of energy drinks among physical education students. Rev Latino-am Enfermagem 2008;16(especial):558-64. doi: 10.1590/S0104-11692008000700009. [DOI] [PubMed] [Google Scholar]
- [14].Reid SD, Ramsarran J, Brathwaite R, Lyman S, Baker A, D’Andra CC, Ganga S, Mohammed Z, Sookdeo AT, Thapelo CK. Energy drink usage among university students in a Caribbean country: patterns of use and adverse effects. J. Epidemiol. Global Health 2014;5(2):103-16. doi: 10.1016/j.jegh.2014.05.004. [DOI] [PMC free article] [PubMed] [Google Scholar]
- [15].Kaufman DW, Kelly JP, Rosenberg L, Anderson TE, Mitchell AA. Recent patterns of medication use in the ambulatory adult population of the United States. JAMA 2002;287(3):337-44. doi: 10.1001/jama.287.3.337. [DOI] [PubMed] [Google Scholar]
- [16].Scalese M, Simi E, Fortunato L, Chiellini P, Doveri C, Trivellini G, Siciliano V, Sbrana C, Gazzetti S, Pardini A, Taccini R, Panini R, Fortunato L, Boni A, Potente R, Luppi C, Pardini S, Bastiani L, Curzio O, Molinaro S. Ricerca sul consumo di alcol e sostanze nella popolazione scolastica. Pisa: Istituto di Fisiologia Clinica del Consiglio Nazionale delle Ricerche;2012. (Rapporto Espad Italia 2012). [Google Scholar]
- [17].Pacifici R, Palmi I, Vian P, Andreotti A, Mortali C, Berretta P, Mastrobattista L, Pichini S. Emerging trends in consuming behaviours for non-controlled substances by Italian urban youth: a cross sectional study. Ann Ist Super Sanità 2016;52(1):104-13. DOI: 10.4415/ANN_16_01. [DOI] [PubMed] [Google Scholar]
- [18].Oteri A, Salvo F, Caputi AP, Calapai G. Intake of energy drinks in association with alcoholic beverages in a cohort of students of the School of Medicine of the University of Messina. Alcohol Clin Exp Res 2007;31(10):1677-80. doi: 10.1111/j.1530-0277.2007.00464.x. [DOI] [PubMed] [Google Scholar]
- [19].Attila S, Cakir B. Energy-drink consumption in college students and associated factors. Nutrition 2011;27(3),316-22. doi: 10.1016/j.nut.2010.02.008. [DOI] [PubMed] [Google Scholar]
- [20].Malinauskas BM, Aeby VG, Overton RF. A survey of energy drink consumption patterns among college students. Nutr J 2007;6:35. doi: 10.1186/1475-2891-6-35. [DOI] [PMC free article] [PubMed] [Google Scholar]
- [21].Hamilton HA, Boak A, Ilie G, Mann RE. Energy drink consumption and associations with demographic characteristics, drug use and injury among adolescents. Can J Public Health 2013;30;104(7):496-501. doi: http://dx.doi.org/10.17269/cjph.104.3998. [DOI] [PMC free article] [PubMed] [Google Scholar]
- [22].Breda JJ, Whiting SH, Encarnação R, Norberg S, Jones R, Reinap M, Jewell J. Energy drink consumption in Europe: a review of the risks, adverse health effects, and policy options to respond. Front Public Health 2014;2(134):1-5. doi: 10.3389/fpubh.2014.00134. [DOI] [PMC free article] [PubMed] [Google Scholar]
- [23].Benowitz NL. Clinical pharmacology of caffeine. Annu Rev Med 1990;41:277-88. doi: 10.1146/annurev.me.41.020190.001425. [DOI] [PubMed] [Google Scholar]
- [24].Nehlig A, Daval JL, Debry G. Caffeine and the central nervous system: mechanisms of action, biochemical, metabolic and psychostimulant effects. Brain Res Rev 1992;17(2):139-70. doi: 10.1016/0165-0173(92)90012-B. [DOI] [PubMed] [Google Scholar]
- [25].Rush E, Schulz S, Obolonkin V, Simmons D, Plank L. Are energy drinks contributing to the obesity epidemic? Asia Pac J Clin Nutr 2006;15(2):242-44. [PubMed] [Google Scholar]
- [26].Bray GA, Nielsen SJ, Popkin BM. Consumption of high-fructose corn syrup in beverages may play a role in the epidemic of obesity. Am J Clin Nutr 2004;79:537-43. [DOI] [PubMed] [Google Scholar]
- [27].Greer F, Hudson R, Ross R. Caffeine ingestion decreases glucose disposal during a hyperinsulinemic-euglycemic clamp in sedentary humans. Diabetes 2001;50(10):2349-54. doi: 10.2337/diabetes.50.10.2349. [DOI] [PubMed] [Google Scholar]
- [28].Siegel RK. Ginseng abuse syndrome: problems with the panacea. JAMA 1979;241(15):1614-5. doi: 10.1001/jama.1979.03290410046024. [PubMed] [Google Scholar]
- [29].Buettner C, Yeh GY, Phillips RS, Mittleman MA, Kaptchuk TJ. Systematic review of the effects of ginseng on cardiovascular risk factors. Ann Pharmacother 2006;40(1):83-95. doi: 10.1345/aph.1G216. [DOI] [PubMed] [Google Scholar]
- [30].Deliens T, Clarys P, De Bourdeaudhuij I, Deforche B. Correlates of university students’ soft and energy drink consumption according to gender and residency. Nutrients 2015;7(8):6550-66. doi: 10.3390/nu7085298. [DOI] [PMC free article] [PubMed] [Google Scholar]
- [31].Goldman RD. Caffeinated energy drinks in children. Can Fam Physician 2013;59(9):947-8. [PMC free article] [PubMed] [Google Scholar]
- [32].Miller KE. Wired: energy drinks, jock identity, masculine norms, and risk taking. J Am Coll Health 2008;56(5):481-9. doi: 10.3200/JACH.56.5.481-490. [DOI] [PMC free article] [PubMed] [Google Scholar]
- [33].Nowak D, Jasionowski A. Analysis of the consumption of caffeinated energy drinks among Polish adolescents. Int J Environ Res Public Health 2015;12(7):7910-21. doi: 10.3390/ijerph120707910. [DOI] [PMC free article] [PubMed] [Google Scholar]
- [34].Heckman MA, Sherry K, Gonzales De Mejia E. Energy drinks: an assessment of their market size, consumer demographics, ingredient profile, functionality, and regulations in the United States. Compr Rev Food Sci Food Saf 2010; 9:303-17. doi: 10.1111/j.1541-4337.2010.00111. [DOI] [PubMed] [Google Scholar]
- [35].O’Brien M, McCoy T, Rhodes S, Wagoner A, Wolfson M. Caffeinated cocktails: energy drink consumption, high-risk drinking, and alcohol-related consequences among college students. Acad Emerg Med 2008;15(5):453-60. doi: 10.1111/j.1553-2712.2008.00085.x. [DOI] [PubMed] [Google Scholar]
- [36].Thombs D, O’Mara R, Tsukamoto M, Rossheim M E, Weiler RM, Merves ML, Goldberger BA. Event-level analyses of energy drink consumption and alcohol intoxication in bar patrons. Addict Behav 2010;35(4):325-30. doi: 10.1016/j.addbeh.2009.11.004. [DOI] [PubMed] [Google Scholar]
- [37].Ferreira SE, Hartmann Quadros IM, Trindade AA, Takahashi S, Koyama RG, Souza-Formigoni ML. Can energy drinks reduce the depressor effect of ethanol? An experimental study in mice. Physiol Behav 2004(82):841-7. doi: 10.1016/j.physbeh.2004.06.017. [DOI] [PubMed] [Google Scholar]
- [38].Ferreira SE, De Mello M, Pompeia S, De Souza-Formigoni M L. Effects of energy drink ingestion on alcohol intoxication. Alcohol Clin Exp Res 2006(30):598-605. doi: 10.1111/j.1530-0277.2006.00070.x. [DOI] [PubMed] [Google Scholar]
- [39].Rahamathulla MP. Prevalence, side effects and awareness about energy drinks among the female university students in Saudi Arabia. Pak J Med Sci (2017);33(2):347-52. doi: 10.12669/pjms.332.12084 [DOI] [PMC free article] [PubMed] [Google Scholar]
- [40].Ministero della Salute. Comitato nazionale per la sicurezza alimentare parere n. 5 del 2012 Energy drinks e bevande alcoliche. Avaliable at: http://www.salute.gov.it/imgs/c_17_pubblicazioni_1790_allegato.pdf. Accessed in February 2017.
- [41].Nordt SP, Claudius I, Rangan C, Armijo E, Milano P, Yanger S, Tomaszsewski C. Reasons for energy drink use and reported adverse effects among adolescent Emergency Department patients. Pediatr Emerg Care 2016. Published Ahead-of-Print, feb 2016- Last Updated: May 23, 2017. doi: 10.1097/PEC.0000000000000644. [DOI] [PubMed] [Google Scholar]
- [42].Arria AM, Caldeira KM, Kasperski SJ, Vincent KB, Griffiths RR, O’Grady KE. Energy drink consumption and increased risk for alcohol dependence. Alcohol Clin Exp Res 2011;35(2):365-75. doi:10.1111/j.1530-0277.2010.01352.x. [DOI] [PMC free article] [PubMed] [Google Scholar]
- [43].Mattioli AV, Pennella S, Farinetti A, Manenti A. Energy drinks and atrial fibrillation in young adults. Clin Nutr 2017:S0261-5614(17):30162-0. doi: 10.1016/j.clnu.2017.05.002. [DOI] [PubMed] [Google Scholar]
- [44].Stacey N, van Walbeek C, Maboshe M, Tugendhaft A, Hofman K. Energy drink consumption and marketing in South Africa. Prev Med 2017:S0091-7435(17):30174-3. doi: 10.1016/j.ypmed.2017.05.011. [DOI] [PubMed] [Google Scholar]