

Abstract
HuR, a protein that binds to target mRNAs and can enhance their stability and translation, is increasingly recognized as a pivotal regulator of gene expression during cell division and tumorigenesis. We sought to identify collections of HuR-regulated mRNAs in colon cancer cells by systematic, cDNA array-based assessment of gene expression in three systems of varying complexity. First, comparison of gene expression profiles among tumors with different HuR abundance revealed highly divergent gene expression patterns, and virtually no changes in previously reported HuR target mRNAs. Assessment of gene expression patterns in a second system of reduced complexity, cultured colon cancer cells expressing different HuR levels, rendered more conserved sets of HuR-regulated mRNAs. However, the definitive identification of direct HuR target mRNAs required a third system of still lower complexity, wherein HuR–RNA complexes immunoprecipitated from colon cancer cells were subject to cDNA array hybridization to elucidate the endogenous HuR-bound mRNAs. Comparison of the transcript sets identified in each system revealed a strikingly limited overlap in HuR-regulated mRNAs. The data derived from this systematic analysis of HuR-regulated genes highlight the value of low-complexity, biochemical characterization of protein–RNA interactions. More importantly, however, the data underscore the broad usefulness of integrated approaches comprising systems of low complexity (protein–nucleic acid) and high complexity (cells, tumors) to comprehensively elucidate the gene regulatory events that underlie biological processes.
Key words: cDNA arrays, RNA–protein complexes, Posttranscriptional regulation, mRNA turnover, Cancer model
THE unique expression pattern of a given gene is regulated by the combined influence of multiple regulatory mechanisms, including transcription, pre-mRNA processing, mRNA export, mRNA turnover, and translation. Many advances have been made in understanding transcriptional mechanisms of gene regulation, while considerably less is known about many posttranscriptional gene regulatory events. Nevertheless, the central role of posttranscriptional gene regulation in many important cellular processes and diseases is becoming increasingly apparent. In this context, the ubiquitous RNA binding protein HuR, a member of the Hu protein family, is emerging as a critical regulator of posttranscriptional gene expression. Hu proteins, also comprising the neuronal-specific proteins HuB, HuC, and HuD, were initially identified as specific tumor antigens, providing the first indication that they could have a growth regulatory function (8,36). Hu proteins were subsequently found to regulate the expression of labile mRNAs bearing AU- and U-rich sequences by enhancing their stability, modulating their translation, or performing both functions (4). Many such target mRNAs encode proteins important for cell growth and proliferation, like cell cycle regulatory factors (cyclin A, p21, cyclin B1), proliferation-associated genes (c-fos, c-myc), as well as other factors that influence tumor cell growth [vascular endothelial growth factor (VEGF), cyclo-oxygenase-2 (COX-2), β-catenin, and many cytokines] (1,9,24–26,33,42,43).
While the precise mechanisms underlying HuR-mediated effects remain poorly understood, its presence in the cytoplasm appears to be intimately linked to its functions in mRNA stabilization and translational regulation. HuR is predominantly (>90%) localized in the nucleus of most unstimulated cells, but, upon cell stimulation, HuR can translocate to the cytoplasm where it prevents the decay and modulates the translation of target mRNAs (2,7,15,16,21,33,42,43). Through its posttranscriptional influence on collections of target mRNAs, HuR is believed to play a central role in regulating a variety of complex physiological and pathological processes. For example, a significant increase in cytoplasmic HuR during the early stages of muscle differentiation was recently linked to the stabilization of critical differentiation-associated genes (17,40). Furthermore, examination of HuR abundance and subcellular localization in different types of tumor tissues revealed higher HuR expression and increased cytoplasmic presence in all malignancies examined (3,13,26). Moreover, HuR-overexpressing colon cancer cells injected into nude mice caused accelerated tumor growth compared with the growth of tumors arising after inoculation of control cells; conversely, decreased expression of HuR, achieved through antisense and small-interfering RNA approaches, inhibited tumor growth (26). These findings revealed a function for HuR in regulating the growth of malignant cells and suggested that HuR’s effects likely relied on its ability to modulate the expression of cancer-associated genes.
Given HuR’s ability to modulate the tumorigenic phenotype of colon cancer cells, we recently undertook efforts to systematically identify the collection of direct, endogenous HuR target mRNAs at a biochemical level by immunoprecipitating HuR–RNA complexes and subsequently identifying the bound transcripts through cDNA array hybridization (27). In the present investigation, we extend this low-complexity analysis of HuR target mRNAs by systematically assessing HuR’s influence on gene expression programs in cultured cells and in tumors expressing varying HuR levels, two systems of increasingly higher complexity. Specifically, we sought to carry out a comparative evaluation of the direct and indirect effects of HuR on gene expression patterns in colon cancer cells. This comprehensive comparison underscores the shortcomings of high-complexity models (tissues, cells), which have been studied much more extensively that those of lower complexity (protein–nucleic acid complexes) to identify collections of genes regulated by specific tumor suppressors, on-cogenes, and other disease-associated factors. Using HuR as a model protein regulating cancer-related genes, we highlight the value of studying protein– nucleic acid interactions to identify direct downstream target transcripts, but we also compare the three levels of analysis (tumor, cultured cell, and protein–RNA complex), discuss their strengths and limitations, and study the usefulness of integrated approaches comprising lower and higher complexity systems.
MATERIALS AND METHODS
Cell Culture and Preparation of Lysates
Human colorectal carcinoma RKO cells were cultured in minimum essential medium (Gibco-BRL, Gaithersburg, MD) supplemented with 10% fetal bovine serum and antibiotics. Cells constitutively overex-pressing HuR (S2) and control cells (Zeo) were established through transfection with either pZeoSV2-HuR or the corresponding empty plasmid pZeoSV2, respectively (25). Stably transfected clonal populations were stored frozen and used within 3 weeks of thawing.
Tumor Development in Nude Mice
RKO cells (Zeo, S2) were trypsinized, resuspended in PBS (106 cells/0.2 ml), and injected subcutaneously into the lumbar regions of male athymic BALB/c nude mice [BALB/cnu/nu, 8 weeks of age (Taconic, German-town, NY)]: control (Zeo) cells in the left flanks and HuR-overexpressing cells (S2) cells in the right flanks. Eight mice were injected with each RKO population (S2, Zeo), as previously described (26); three tumors overexpressing HuR (S2) and three control tumors (Zeo) were compared. The tumors were visualized in mice using magnetic resonance imaging. Images were obtained using a 1.9-T, 31-cm bore Bruker ABX Biospec NMR system (Bruker Medizintechnik GmbH, Ettlingen, Germany). Spin-echo (SE) images were obtained using a repetition time (T R) of 1540 ms and an echo time (T E) of 100 ms, over 12 contiguous axial slices (2 mm thick), covering a region that included the entire tumor. The field of view was 4 × 2.5 cm, over 128 × 128 pixels.
Western Blot
For Western blotting, whole-cell extracts (10 μg) were size-fractionated by SDS-PAGE and transferred onto nitrocellulose membranes (Amersham, Arlington Heights, IL). HuR and P-actin were detected using monoclonal antibodies from Santa Cruz Biotech (Santa Cruz, CA) and Abcam Limited (Cambridge, UK), respectively. Following secondary antibody incubations, signals were visualized by enhanced chemiluminescence (Amersham).
cDNA Array Analyses
The STAT-60 reagent (Tel-Test “B,” Friendswood, TX) was used to prepare total RNA samples from tumors, cells, or material immunoprecipitated as previously described (21). RNA was reverse transcribed in the presence of [α-33P]dCTP and the radiolabeled products used to hybridize cDNA arrays (http://www.grc.nia.nih.gov/branches/rrb/dna/index/dnapubs.htm#2, MGC arrays, 9600 genes), employing previously reported methodologies (41). All of the data were first analyzed using the Array Pro software (Media Cybernetics, Inc., Carlsbad, CA), then normalized by Z score transformation (6). In brief, the log10 of each original spot intensity was adjusted to the mean and divided by the standard deviation of the intensities of all of the spots. Changes in gene expression between different RNA groups were then calculated by subtracting the average of replicate Z scores. This value, referred to us as the Z difference (Z diff, Z average in HuR-overexpressing populations or HuR IP minus Z average in control populations or IgG1 IP), was then divided by the standard deviation of all Z diff values to obtain the Z ratio. Z ratios were considered significant when ≥+1.5 or ≤−1.5; only Z scores from the different comparison groups whose average was >0 were included in the analysis. The data reflect three independent experiments. The complete cDNA array data are available elsewhere (http://www.grc.nia.nih.gov/branches/rrb/dna/index/dnapubs.htm#2).
RESULTS
Strategy to Assess the Influence of HuR on Gene Expression Profiles at Three Levels of Cellular Complexity
The schematic (Fig. 1) outlines an experimental approach devised for the identification of the collection of mRNAs regulated by HuR in colon cancer cells. RNA isolated from either tumors with different HuR levels (system I), cells expressing varying HuR amounts (system II), or HuR-bound material obtained through IP assays (system III) was reverse transcribed and the resulting complementary DNA used to hybridize cDNA arrays. Significant genes were then systematically selected using the criteria described in Materials and Methods.
Figure 1.

Strategy to assess the influence of HuR on gene expression profiles at three levels of cellular complexity. HuR-regulated RNA collections were compared between three systems of different complexity: tumors with different HuR levels (system I), cells expressing varying HuR amounts (system II), or HuR-bound material obtained through IP assays (system III). RNA obtained from triplicate samples of each biological population was reverse transcribed and the resulting complementary DNA molecules used to hybridize cDNA arrays. Significant genes were then systematically selected using the criteria described in Materials and Methods. Black, gray, and gray-dotted mRNAs represent direct HuR targets, downstream indirect targets, and targets influenced by the host–tumor environment, respectively. White arrows symbolize the influence of the host on the tumor environment (dashed circle) and vice versa.
Genes identified in the tumor material, the system of highest complexity investigated here (system I), were deemed to comprise a heterogeneous collection of HuR-regulated mRNAs. In addition to the direct HuR targets (Fig. 1, black mRNAs), identified targets would also include mRNAs whose expression was regulated by HuR targets (e.g., by an HuR target mRNA encoding a transcription factor), and these gene products might, in turn, affect the expression levels of other target mRNAs (Fig. 1, gray mRNAs), and so forth; the highly heterogeneous tumor-host environment would further modulate gene expression (Fig. 1, gray dotted mRNAs). Genes identified in the cell material, a system of lesser complexity than the tumors (system II), were anticipated to represent gene populations similar to those described for the tumor material (i.e., direct HuR target mRNAs and downstream indirect targets), although the in vitro culture conditions would be predicted to introduce less additional variability in gene expression patterns than the animal environment. Finally, genes identified in the IP material (system III), the least complex system assessed in this study, represented bona fide mRNA collections of direct HuR targets.
Comparison of Gene Expression Profiles Between HuR-Overexpressing and Control Tumors
We recently demonstrated that HuR-overexpressing RKO human colorectal cancer cells injected into nude mice exhibited accelerated tumor growth compared with the growth of control cells, while decreased expression of HuR, achieved through antisense and small-interfering RNA approaches, inhibited tumor growth (26). The magnetic resonance image (MRI) shown in Figure 2 illustrates the difference in tumor size seen in a representative mouse inoculated with HuR-overexpresssing cells in one flank (S2, arising from cells stably overexpressing HuR after transfec-tion with pZeoSV2-HuR) compared with the inoculation of control cells in the opposite flank (Zeo, arising from control cells transfected with the insert-less vector pZeoSV2). RNA from tumors developed pairwise (from either S2 or Zeo cells) was analyzed in triplicate, by studying three different mice (#42, #80, and #82) to assess the influence of HuR on gene expression profiles. Following cDNA array hybridization, mRNAs exhibiting significantly different abundance in HuR-overexpressing tumors (S2) compared with control (Zeo) tumors were identified (Table 1). The criteria used to select significant genes were as follows: significant genes had to be at least significant (Z ratio ≥+1.5 or ≤−1.5) in one of the mice, while in the other two, Z ratios should have the same trend as that of the significant gene (Z ratio >0 or <0, respectively). This collection of HuR-regulated genes proved to be quite small, with only six genes found to be significantly upregulated in HuR-overexpresssing tumors (Table 1); the reduced number of genes is likely due to the high variability inherent to this in vivo system. Of note, we recently identified actin-γ1 to be a direct HuR-bound mRNA (27); the remaining five genes did not appear to encode HuR direct target transcripts.
Figure 2.

Magnetic resonance (MR) image illustrating the significantly larger tumor size resulting from inoculation with HuR-over-expressing cells (S2) in one flank compared with control cells (Zeo) in the opposite flank.
TABLE 1.
GENES DIFFERENTIALLY EXPRESSED IN HuR-OVEREXPRESSING TUMORS COMPARED WITH CONTROL TUMORS IN THREE DIFFERENT MICE
| Gene Name | Symbol | Z Ratio | ||
|---|---|---|---|---|
| #42 | #80 | #82 | ||
| Ribosomal protein L4 | RPL4 | 4.55 | 1.75 | 0.354 |
| RAB38, member RAS oncogene family | RAB38 | 2.84 | 0.50 | 0.209 |
| Epithelial cell transforming sequence 2 oncogene | ECT2 | 2.43 | 1.89 | 0.035 |
| Actin, γ1 | ACTG1 | 1.90 | 0.37 | 0.031 |
| CGE-31 protein | CGI-31 | 1.78 | 1.39 | 0.002 |
| Synaptogyrin 2 | SYNGR2 | 1.64 | 0.10 | 0.065 |
Effect of HuR overexpression on tumor growth and gene expression profiles. Significant genes were selected as follows: among those genes displaying a significant signal on the cDNA array membranes (average Z scores ≥0), candidate genes must be either upregulated (Z ratio >0) in the three mice, or dowregulated (Z ratio <0) in the three mice, and they must have a Z ratio ≥1.5 or ≤−1.5 at least in one mouse. A complete list of transcripts in the tumors is available at http://www.grc.nia.nih.gov/branches/rrb/dna/dnapubs.htm.
Differences in the Gene Expression Patterns of HuR-Overexpressing and Parental Cultured Cells
Given the lack of consistent gene expression differences between tumors as well as the notable absence of direct HuR targets, we postulated that factors inherent to the mouse physiology and the tumor environment strongly modulated HuR-driven gene expression programs. To reduce such environment-imposed complexity, we set out to examine gene expression patterns in cultured cells, employing the same RKO colon cancer cells from which the tumors had been derived, analyzed in triplicate: S2, a clonal population stably overexpressing HuR, and Zeo, a control population containing only the insert-less vector. Western blot analysis (Fig. 3) illustrates the difference in HuR levels between HuR-overexpressing and control cells [a three- to fourfold difference, as previously described (26)]. RNA from these cells was extracted, reverse transcribed, and used for hybridization of cDNA array membranes. cDNA array analysis using the significance criteria described in Materials and Methods led to the identification of a collection of genes whose expression was influenced by HuR abundance in cultured colon cancer cells. Of the 14 genes found to be expressed at significantly different levels in HuR-overexpressing cells, 3 were upregulated and 11 downregulated with respect to the parental population (Table 2). One of the genes listed [Capping protein (actin filament) muscle Z-line, a1] had been identified as a direct target of HuR (27). By the significance criteria described for each of these systems, no common HuR-regulated genes were found between tumors and cells.
Figure 3.

Western blot analysis of HuR levels in whole-cell lysates prepared from RKO colon cancer cells stably transfected with plas-mids expressing sense HuR (S2) or lacking an insert (Zeo). β-Actin levels illustrate the similarity in sample loading and transfer on Western blots.
TABLE 2.
GENES DIFFERENTIALLY EXPRESSED IN HuR-OVEREXPRESSING CELLS (S2) COMPARED TO CONTROL CELLS
| Gene Name | Symbol | Z Ratio |
|---|---|---|
| General transcription factor IIIC, polypeptide 2, beta 110 kDa | GTF3C2 | 1.898 |
| Aldo-keto reductase family 7, member A2 (aflatoxin aldehyde reductase) | AKR7A2 | 1.649 |
| Dehydrogenase/reductase (SDR family) member 4 | humNRDR | 1.516 |
| Ceroid-lipofuscinosis, neuronal 2, late infantile | CLN2 | −1.503 |
| Small nuclear ribonucleoprotein polypeptide A | SNRPA | −1.582 |
| Nudix (nucleoside diphosphate linked moiety X)-type motif 5 | NUDT5 | −1.584 |
| Fibrinogen, γ polypeptide | FGG | −1.621 |
| DnaJ (Hsp40) homolog, subfamily B, member 6 | DNAJB6 | −1.655 |
| S100 calcium binding protein A6 (calcyclin) | S100A6 | −1.657 |
| Capping protein (actin filament) muscle Z-line, α1 | CAPZA1 | −1.702 |
| Enolase 3 (β, muscle) | ENO3 | −1.745 |
| Glutaredoxin (thioltransferase) | GLRX | −1.788 |
| Fuse-binding protein-interacting repressor | SIAHBP1 | −2.013 |
| Major histocompatibility complex, class I, E | HLA-E | −2.075 |
Influence of HuR levels on gene expression profiles in cultured colon cells. Z ratios served to assess the significance of a given transcript and were calculated as explained in Materials and Methods. A full list of transcripts in cultured RKO cells is available at http://www.grc.nia.nih.gov/branches/rrb/dna/dnapubs.htm.
Comparison Among Direct HuR Target mRNAs and HuR-Regulated mRNA Sets in Colon Cancer Cells and in Tumors
We recently reported the identification of direct, endogenous HuR target mRNAs at the biochemical level (27). Briefly, we used an antibody recognizing HuR to isolate HuR-bound mRNAs by performing IP assays under conditions that preserved mRNA– protein complexes. HuR-bound mRNAs were subsequently eluted and used to prepare reverse transcribed products that were hybridized to human cDNA arrays. We compared the 88 strongest direct HuR target transcripts identified by this approach (after elimination of hypothetical genes, ESTs, and other poorly defined targets) with the genes modified by HuR in the tumor and cell analyses. In this comparison, we have included all of the target genes identified by the IP analysis and provide side-by-side information on the changes in expression of the same genes in cells and tumors. None of the 88 IP target genes were found to be significantly altered in both tumors and cultured cells according to the strong significance criteria that had been applied separately to the two higher complexity systems. However, some shared genes were found when the stringency of the criteria was reduced to include genes displaying the same trend in cells and tumors: genes whose Z ratios were either >0 in all cases (cells and tumors from three mice) or <0 in all cases. Using these criteria, we found that, out of a total of 1090 genes upregulated in cells and 344 in the tumors, only 12 genes were shared with the 88 endogenous HuR targets (Fig. 4, left side). Regarding downregulated genes, out of a total of 1167 genes differentially expressed in the cells and 182 in the tumors, only 4 genes were common with the 88 identified as endogenous, direct HuR targets (Fig. 4, right side). The complete data sets, including the Z ratios, can be obtained from the authors. Table 3 lists the 88 direct HuR target mRNAs, along with the Z ratios for the same genes in cells and tumors. At the top of Table 3 are the 12 HuR target mRNAs whose expression was jointly upregulated in tumors and cells, followed by the 4 HuR target mRNAs whose expression was reduced across tumors and cells. Below these genes are the remaining 72 target mRNAs that did not display matching trends in cells and tumors.
Figure 4.
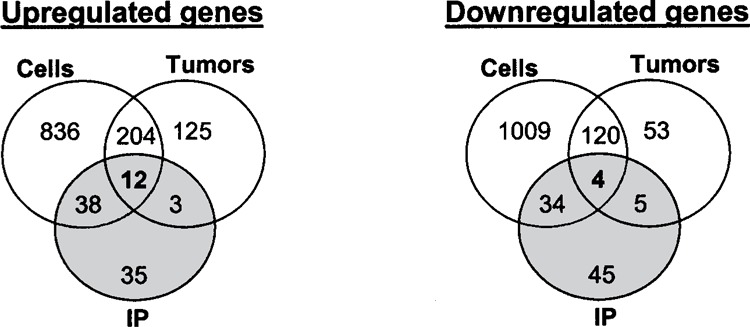
Venn diagrams depict the number of genes upregulated or dowregulated in the three sets of expressed mRNAs. The gray circles represent the 88 direct HuR targets in the IP material, indicating those genes shared with cells, with tumors, and with both cells and tumors. Significant direct HuR targets found in the IP material were selected according to the higher stringency criteria described in Materials and Methods (Z ratio >1.5 and average Z scores >0), while upregulated or dowregulated genes in the cells and tumors were those with Z ratios >0 or <0, respectively (plus average of Z scores >0).
TABLE 3.
INFLUENCE OF HuR ON THE EXPRESSION OF DIRECT HuR TARGETS IN CULTURED CELLS AND TUMORS
| Gene Name | Symbol | IP | Cells | Tumors | ||
|---|---|---|---|---|---|---|
| #42 | #80 | #82 | ||||
| Actin, β | ACTB | 5.73 | 0.229 | 0.078 | 0.292 | 0.018 |
| Actin, γ2, smooth muscle, enteric | ACTG2 | 4.69 | 1.036 | 0.113 | 1.020 | 0.030 |
| Prothymosin, α (gene sequence 28) | PTMA | 3.03 | 0.629 | 0.063 | 0.213 | 0.044 |
| Actin, γ 1 | ACTG1 | 2.95 | 0.324 | 1.904 | 0.369 | 0.031 |
| Profilin 1 | PRN1 | 2.76 | 0.152 | 0.333 | 0.053 | 0.032 |
| Stromatin (EPB72)-like 2 | STOML2 | 2.32 | 0.076 | 0.001 | 0.046 | 0.076 |
| Junctophilin 3 | JPH3 | 1.89 | 0.292 | 0.132 | 0.561 | 0.040 |
| Tubulin, β2 | TUBB2 | 1.54 | 0.129 | 0.260 | 0.552 | 0.017 |
| Serine/threonine kinase 6 | STK6 | 1.53 | 0.227 | 0.282 | 0.486 | 0.003 |
| Annexin A2 | ANXA2 | 1.53 | 0.335 | 0.076 | 0.469 | 0.001 |
| Fuse-binding protein-interacting repressor | SIAHBP1 | 1.52 | 0.277 | 0.036 | 0.070 | 0.044 |
| FERM, RhoGEF and pleckstrin domain protein 2 | KIAA0793 | 1.51 | 0.013 | 0.177 | 0.782 | 0.056 |
| Cell division cycle associated 4 | CDCA4 | 2.61 | −0.362 | −0.04 | −0.33 | −0.001 |
| DKFZP566I1024 protein | DKFZP56611024 | 1.85 | −0.612 | −0.11 | −0.23 | −0.010 |
| Capping protein muscle Z-line, αl | CAPZA1 | 1.67 | −1.702 | −0.04 | −0.21 | −0.567 |
| Calmodulin 2 (phophoorylase kinase, δ) | CALM2 | 1.65 | −0.794 | −0.26 | −0.19 | −0.103 |
| Protein phosphatase 1, catalytic subunit, β | PPP1CB | 6.72 | 0.271 | 0.48 | −2.78 | 0.040 |
| Ubiquitin-conjugating enzyme E2N | UBE2N | 5.20 | −0.461 | −0.05 | 0.15 | −0.051 |
| Mitogen-activated protein kinase kinase 2 | MAP2K2 | 4.68 | 0.202 | 0.80 | 0.46 | −0.028 |
| Neutrophil cytosolic factor 4, 40 kDa | NCF4 | 4.64 | 0.284 | 0.04 | −0.59 | 0.043 |
| Metastasis associated 1 | MTA1 | 4.57 | 0.411 | 0.08 | −0.59 | 0.039 |
| Poly(rc) binding protein 2 | PCBP2 | 4.24 | −0.620 | 0.15 | −0.22 | −0.116 |
| G protein coupled receptor α11 | GNA-11 | 3.79 | −0.157 | 0.35 | −0.09 | 0.125 |
| KIAA1001 protein | KIAA1001 | 3.78 | −0.396 | −0.19 | −0.09 | 0.125 |
| CD9 antigen (p24) | CD9 | 3.56 | −0.609 | 0.11 | 0.08 | 0.032 |
| Retinoblastoma binding protein 9 | RBBP9 | 2.93 | 1.098 | 0.00 | −0.29 | −0.034 |
| Enhancer of rudimentary homolog (Drosophila) | ERH | 2.92 | −0.351 | −0.01 | −0.63 | 0.041 |
| Basic transcription factor 3 | BTF3 | 2.85 | −0.139 | −0.72 | −0.18 | 0.036 |
| Legumain | LGMN | 2.84 | 0.283 | −0.26 | 0.16 | −0.072 |
| CTP synthase | CTPS | 2.84 | 0.374 | 0.07 | −0.99 | −0.013 |
| Casein kinase 1, ε | CSNK1E | 2.67 | −0.514 | −0.01 | −0.38 | 0.064 |
| Mitochondrial ribosomal protein S5 | MRPS5 | 2.65 | −0.185 | 0.13 | 0.29 | 0.092 |
| Protein trosine phosphatase, type 9 | PTPN9 | 2.63 | 0.098 | 0.52 | −0.40 | 0.078 |
| KIAA1882 protein | MGC4737 | 2.56 | −0.076 | 0.10 | −0.13 | −0.006 |
| FK506 binding protein 1A, 12 kDa | FKBP1A | 2.53 | −0.159 | 0.00 | 0.21 | 0.005 |
| RNA helicase | KIAA0801 | 2.49 | 0.024 | 0.00 | −0.33 | −0.062 |
| PTD015 protein | PTD015 | 2.49 | 0.598 | 0.20 | 0.70 | −0.005 |
| Mesenchymal stem cell protein DC\SCD75 | LOC51337 | 2.43 | 0.135 | 0.20 | −0.48 | 0.054 |
| Tumor protein d52-like 2 | TPD52L2 | 2.42 | −0.445 | −0.47 | 0.72 | −0.086 |
| Sphingosine kinase 2 | SPHK2 | 2.37 | 0.154 | 0.07 | −1.02 | 0.009 |
| Ubiquitin-like 1 (sentrin) | UBL1 | 2.37 | −0.338 | −0.19 | −0.41 | 0.044 |
| Thymosin, β4, X chromosome | TMSB4X | 2.30 | −0.299 | −0.28 | −0.66 | 0.043 |
| DKFZP343D1335 protein | DKFZP434D1335 | 2.28 | 0.518 | 0.25 | −0.34 | 0.020 |
| Nucleolin | NCL | 2.18 | −0.167 | −0.02 | 0.20 | −0.028 |
| 2,3-Bisphosphoglycerate mutase | BPGM | 2.12 | −0.255 | 0.11 | −0.39 | −0.076 |
| Phosphatidylserine synthase 1 | PTDSS1 | 2.10 | −0.287 | −0.02 | 0.33 | −0.038 |
| BET1 homolog (S. cerevisiae) | BET1 | 2.07 | 0.336 | 0.23 | −0.81 | −0.016 |
| Protein disulfide isomerase related protein | ERP70 | 2.06 | 0.334 | 0.29 | −0.05 | −0.020 |
| Splicing factor 30, survival of motor neuron-related | SPF30 | 2.06 | −0.931 | 0.24 | −0.11 | 0.012 |
| Coronin, actin binding protein, 1C | COROIC | 2.05 | 0.091 | −0.02 | −0.06 | 0.019 |
| Stromatin (epb72)-like 2 | STOML2 | 2.03 | −0.609 | −0.03 | 0.03 | −0.002 |
| Signal sequence receptor, γ | SSR3 | 2.03 | −1.193 | −0.48 | 0.10 | 0.047 |
| Debranching enzyme homolog 1 (S. cerevisiae) | DBR1 | 2.02 | −0.127 | 0.04 | 0.61 | −0.001 |
| Thioredoxin reductase 1 | TXNRD1 | 1.97 | −0.227 | 0.48 | 0.01 | −0.159 |
| General transcription factor IIH, polypeptide 4 | GTF2H4 | 1.97 | −0.286 | −0.10 | −0.15 | 0.014 |
| Chloride intracellular channel 4 | CLIC4 | 1.95 | 0.237 | −0.48 | 0.09 | 0.008 |
| Ubiquitin carboxyl-terminal esterase L2\3 | UCHL3 | 1.95 | 0.588 | 0.38 | −0.92 | 0.073 |
| GDP dissociation inhibitor 2 | GDI2 | 1.94 | 0.043 | −0.05 | 0.37 | −0.002 |
| Wilms’ tumor 1-associating protein | WTAP | 1.91 | −0.223 | 0.27 | 0.06 | −0.004 |
| Putative membrane protein | LOC54499 | 1.88 | 0.060 | −0.43 | −0.27 | 0.024 |
| Deoxyribonuclease II, lysosomal | DNASE2 | 1.88 | −0.040 | 0.05 | −0.51 | 0.038 |
| Cytochrome coxidase subunit vila polypeptide 2 like | COX7A2L | 1.88 | 0.169 | −0.41 | −0.35 | −0.043 |
| Fascin homolog 1, actin-bundling protein | FSCN1 | 1.85 | −0.003 | −0.06 | 0.40 | 0.057 |
| Bcl2-like 2 | BCL2L2 | 1.83 | 0.821 | −0.36 | 0.56 | 0.000 |
| Small nuclear ribonucleoprotein polypeptide F | SNRPF | 1.82 | 0.001 | −0.07 | 0.38 | 0.026 |
| Interferon-induced transmembrane protein 3 | IFITM3 | 1.81 | 0.220 | −0.04 | −0.92 | 0.016 |
| Dihydrolipoamide branched chain transacylase | DBT | 1.81 | 0.083 | −0.03 | −0.22 | −0.056 |
| GCI-147 protein | CGI-147 | 1.80 | 0.593 | 0.00 | −0.49 | 0.023 |
| FIP1 like 1 (S. cerevisiae) | DKFZP586K0717 | 1.74 | 0.260 | 0.20 | −0.64 | −0.069 |
| High mobility group nucleosomal binding domain 4 | HMGN4 | 1.74 | 0.455 | −0.40 | 0.25 | 0.014 |
| Creatine kinase, brain | CKB | 1.70 | −0.174 | 0.19 | −0.11 | −0.015 |
| SM-11044 binding protein | SMBP | 1.69 | −0.006 | −0.34 | 0.75 | 0.057 |
| RAB interacting factor | RABIF | 1.68 | 0.765 | 0.08 | −0.48 | −0.001 |
| Matrix metalloproteinase 1 | MMP1 | 1.68 | 0.303 | 0.07 | −0.83 | −0.339 |
| Lactate dehydrogenase B | LDHB | 1.68 | −0.080 | −0.35 | −0.08 | 0.083 |
| Neuropilin (NRP) and tolloid (tll)-like 2 | NETO2 | 1.67 | 0.183 | 0.05 | −0.87 | 0.019 |
| Aldehyde dehydrogenase 3 family, member B1 | ALDH3B1 | 1.65 | 0.658 | −0.19 | 0.91 | 0.006 |
| MBD2-interacting zinc finger protein | MIZF | 1.65 | −0.157 | 0.06 | −0.18 | 0.055 |
| Mitochondrial ribosomal protein L30 | MRPL30 | 1.59 | 0.960 | 0.06 | 0.01 | −0.098 |
| RAD1 homolog (S pombe | RAD1 | 1.59 | −0.236 | 0.04 | 0.43 | −0.038 |
| Plasminogen activator, tissue | PLAT | 1.59 | 0.162 | −0.47 | −0.07 | −0.024 |
| KIAA0632 protein | KIAA0632 | 1.58 | 0.308 | −0.14 | −0.16 | 0.009 |
| DKFZP586A0522 protein | DKFZP586A0522 | 1.57 | 0.070 | −0.24 | 0.61 | 0.037 |
| Mortality factor 4 like 1 | MRG15 | 1.57 | −0.353 | −0.01 | −0.21 | 0.028 |
| Heat shock 27 kDa protein 1 | HSPB1 | 1.55 | 0.263 | 0.04 | −0.23 | 0.090 |
| v-Myc myelocytomatosis viral oncogene | MYC | 1.54 | 0.537 | 0.10 | −0.53 | −0.183 |
| HSPC038 protein | LOC51123 | 1.54 | 0.754 | 0.09 | −0.55 | 0.016 |
| Serine proteinase inhibitor, clade B, member 1 | SERPINB1 | 1.52 | −0.284 | 0.51 | 0.33 | 0.026 |
| Myozenin 2 | MYOZ2 | 1.50 | −0.223 | −0.36 | 0.20 | 0.006 |
Comparative analysis of direct HuR target mRNAs with HuR-regulated mRNA sets in colon cancer cells and Complete list of significant endogenous HuR targets and their expression levels in cultured cells and in tumors. Top: direct HuR targets whose expression was jointly upregulated or downregulated across cells and tumors.
In summary, we carried out a systematic analysis of gene expression profiles in tumors and cultured cells with varying HuR expression levels, and compared the resulting HuR-regulated genes with mRNAs that are direct targets of binding by HuR. Our data revealed an unexpectedly low overlap among the HuR target genes identified in each of the three systems.
DISCUSSION
Over the past decade, the development of high-throughput technologies such as microarray analysis has radically changed the study of gene expression programs. This technique has been particularly helpful in the identification of characteristic patterns of gene expression in complex processes such as cancer [for review, see (34)]. In this regard, high-complexity models [tumors and cultured cells (30,34,39,44)] have been used much more extensively than low-complexity models (protein-nucleic acid complexes) to identify collections of genes regulated by specific cancer-associated factors such as oncogenes and tumor-suppressor genes. In this investigation, the potential overlap in gene expression profiles, as well as the relative value of each approach, have been assessed through systematic, cDNA array-based, triplicate comparison of gene expression profiles modulated by the cancer-related, RNA binding protein HuR in three systems of decreasing complexity.
In the first study system, the analysis of gene expression patterns among tumors with varying HuR abundance revealed a very low number of genes significantly regulated by HuR (only 6 out of 6400 unique genes on the array). In the second, less complex, study system, cultured RKO colon cancer cells expressing different HuR levels also rendered a small number of consistently altered mRNAs (a total of 14). Despite the fact that the tumors had been derived from the very same RKO cells injected into nude mice, there was no overlap among significantly altered genes in each case (as selected by the high-stringency criteria explained in the legends of Tables 1 and 2); similarly, minimal overlaps in gene expression patterns have been described between in vivo and in vitro analyses of squamous cell carcinoma and breast cancer (10,44). By contrast, when the original criteria (Z ratio >+1.5 or <–1.5, average of Z scores ≥0) were relaxed to include genes exhibiting moderate differences in expression (Z ratio >0 or <0, average of Z scores ≥0), 60% of the genes upregulated in tumors. . Bottom: the remaining direct HuR targets, which did not display matching trends in cells and tumors. the tumors were also more highly expressed in cultured cells, while 68% of the genes dowregulated in the tumors were also lower in cells (Fig. 4). These findings reveal that the effects of HuR on gene expression profiles may be modest, likely due to internal compensatory mechanisms of the cell, and hence difficult to distinguish from background gene expression changes. The third study system was devised to systematically identify direct HuR target mRNAs in RKO cells. We recently reported studies based on the IP of HuR–RNA complexes followed by cDNA analysis; by using this methodology, we found 88 direct, endogenous targets of HuR (27). When the genes identified by this approach were compared with those in tumors and cells, a group of direct HuR targets emerged (12 HuR target transcripts were upregulated in cells and tumors; 4 HuR target transcripts were downregulated in cells and tumors), but only after the criteria for significance were relaxed. Given that the mRNA targets identified through IP were considered to represent the collection of true direct HuR binding targets (27,37,38), the number of genes common to all three groups is conspicuously small, collectively comprising only 18% of the total HuR direct targets. The extensive discrepancy in mRNA targets identified by the three approaches, despite having used the same cells and cDNA arrays, provides a systematic demonstration of the limitations of higher order study systems (cells, tissues) for the elucidation of direct downstream targets of a gene regulatory factor.
In cells and tumors, several factors likely contribute to the “dilution” of the effects of HuR (i.e., the divergence between the genes identified by IP and the genes differentially expressed in tumors and cells). Beginning with the mechanism of gene regulation by HuR, at least two direct HuR target mRNAs have been reported to be regulated primarily through altered translation: those encoding p53 and p27 (22,29,31). Accordingly, while most HuR mRNA targets 2 5h Aa vper b2e0e1n8re0p6o:r4te8d:5t9o become more stable and hence accumulate upon HuR binding, it is likely that some bona fide HuR targets identified by IP are not subject to stabilization, but are instead subject to translational regulation, and therefore cannot be identified by measuring differences in mRNA levels in tumors or cells. The specific factors that dictate whether HuR will stabilize or alter the translation of a given target mRNA remain to be elucidated. Next, an obvious source of additional heterogeneity is the cascade of gene regulatory events that HuR can set in motion. For example, several HuR target mRNAs encode transcription factors [c-fos, c-myc, and p53 (28,29), as well as the basic transcription factor 3 (BTF3) and general transcription factor IIH, polypeptide 4 (GTF2H4) identified in this study (Table 3)], capable of transcriptionally regulating the expression of specific subsets of genes, which in turn can modulate the expression of other downstream genes, etc. In this category of effectors are also many HuR-regulated growth factors like GM-CSF and VEGF (14,25), whose mechanisms of action include the triggering of signaling cascades and other downstream gene regulatory events on target cells. An even more complex source of heterogeneity in the pools of expressed mRNAs is provided by the “environmental noise” inherent to both cultured cells, which are growing on a specific substrate, in a given medium, at a certain density, etc., and to tumors, also subject to the effects of cell–cell, cell–extracellular matrix, and cell–host effectors like circulating growth factors and hormones, the organism’s immune system, local oxygen supply, and other factors.
Our study systematically illustrates the existence of multiple levels of complexity in the mechanisms regulating cancer-related gene expression and further reveals that an integrated analysis of low- and high-complexity systems will provide a comprehensive understanding of gene regulation in disease. Undoubtedly, cancer cell lines and animal models will remain an important resource for investigating the molecular events underlying oncogenesis, given that they provide access to adequate amounts of DNA, RNA, and protein for study, as well as opportunities for genetic manipulation in many in vitro and in vivo xenograft studies. However, we propose that greater efforts should be placed on the identification of the direct molecular targets of such proteins. In the case of RNA binding proteins, AUF1 has also been postulated to favor carcinogenic processes (19), while tristetraprolin has been proposed to function as a tumor suppressor (35). A systematic identification of specific target mRNAs using IP assays followed by array hybridization will likely yield valuable information complementing the cell and tumor models assayed to date (19,35). In the case of DNA binding proteins, many transcription factors, such as p53, c-fos, c-jun, NF-κB, c-myc, WT1, E2F (5,11,12,18,20,32), have been linked directly or indirectly to the tumorigenic process. For these proteins, chromatin immunoprecipitation (ChIP) assays (23) represent an approach equivalent to the RNA IP assays described here. However, in the case of DNA binding proteins coupled with ChIP analysis, systematic and wide-ranging assessment of target genes awaits the development of comprehensive DNA arrays encompassing large sets of promoter and gene regulatory sequences.
In summary, the study presented here provides a valuable framework for microarray-based analysis of gene expression profiles implemented by cancer-related factors. The assessment of gene expression patterns in tumors and cells provides a broad picture of gene regulatory frameworks, but renders limited information on the direct molecular targets of the factor in question. By contrast, the elucidation of direct molecular targets yields a restricted view of the complex gene regulatory events ensuing downstream, but does point to specific early effectors of gene regulation cascades; such immediate effectors potentially constitute valuable targets of therapeutic intervention.
ACKNOWLEDGMENTS
We thank M. B. Kastan for the RKO cells, and K. Mazan-Mamczarz and C. Cheadle for providing guidance in the analysis of cDNA arrays. We are grateful to our colleagues J. L. Martindale and P. J. Morin for critical reading of the manuscript, and we appreciate the contribution of N. Olmo to the illustrations.
REFERENCES
- 1. Antic D.; Keene J. D. Embryonic lethal abnormal visual RNA-binding proteins involved in growth, differentiation and posttranscriptional gene expression. Am. J. Hum. Genet. 61:273–278; 1997. [DOI] [PMC free article] [PubMed] [Google Scholar]
- 2. Atasoy U.; Watson J.; Patel D.; Keene J. D. ELAV protein HuA (HuR) can redistribute between nucleus and cytoplasm and is upregulated during serum stimulation and T cell activation. J. Cell Sci. 111:3145–3156; 1998. [DOI] [PubMed] [Google Scholar]
- 3. Blaxall B. C.; Dwyer-Nield L. D.; Bauer A. K.; Bohlmeyer T. J.; Malkinson A. M.; Port J. D. Differential expression and localization of the mRNA binding proteins, AU-rich element mRNA binding protein (AUF1) and Hu antigen R (HuR), in neoplastic lung tissue. Mol. Carcinog. 28:76–83; 2000. [PubMed] [Google Scholar]
- 4. Brennan C. M.; Steitz J. A. HuR and mRNA stability. Cell. Mol. Life Sci. 58:266–277; 2001. [DOI] [PMC free article] [PubMed] [Google Scholar]
- 5. Cam H.; Dynlacht B. D. Emerging roles for E2F: Beyond the G1/S transition and DNA replication. Cancer Cell 3:311–316; 2003. [DOI] [PubMed] [Google Scholar]
- 6. Cheadle C.; Vawter M. P.; Freed W. J.; Becker K. G. Analysis of microarray data using Z score transformation. J. Mol. Diagn. 5:73–81; 2003. [DOI] [PMC free article] [PubMed] [Google Scholar]
- 7. Chen C. Y.; Xu N.; Shyu A.-B. Highly selective actions of HuR in antagonizing AU-rich element-mediated mRNA destabilization. Mol. Cell. Biol. 22:7268–7278; 2002. [DOI] [PMC free article] [PubMed] [Google Scholar]
- 8. Dalmau J.; Furneaux H. M.; Gralla R. J.; Kris M. G.; Posner J. B. Detection of the anti-Hu antibody in the serum of patients with small cell lung cancer—a quantitative Western blot analysis. Ann. Neurol. 27: 544–552; 1990. [DOI] [PubMed] [Google Scholar]
- 9. Dixon D. A.; Tolley N. D.; King P. H.; Nabors L. B.; McIntyre T. M.; Zimmerman G. A.; Prescott S. M. Altered expression of the mRNA stability factor HuR promotes cyclooxygenase-2 expression in colon cancer cells. J. Clin. Invest. 108:1657–1665; 2001. [DOI] [PMC free article] [PubMed] [Google Scholar]
- 10. Dooley T. P.; Reddy S. P.; Wilborn T. W.; Davis R. L. Biomarkers of human cutaneous squamous cell carcinoma from tissues and cell lines identified by DNA microarrays and qRT-PCR. Biochem. Biophys. Res. Commun. 306:1026–1036; 2003. [DOI] [PubMed] [Google Scholar]
- 11. Eferl R.; Wagner E. F. AP-1: A double-edged sword in tumorigenesis. Nat. Rev. Cancer 3:859–868; 2003. [DOI] [PubMed] [Google Scholar]
- 12. Ellisen L. W. Regulation of gene expression by WT1 in development and tumorigenesis. Int. J. Hematol. 76: 110–116; 2002. [DOI] [PubMed] [Google Scholar]
- 13. Erkinheimo T. L.; Lassus H.; Sivula A.; Sengupta S.; Furneaux H.; Hla T.; Haglund C.; Butzow R.; Ristimaki A. Cytoplasmic HuR expression correlates with poor outcome and with cyclooxygenase 2 expression in serous ovarian carcinoma. Cancer Res. 63:7591–7594; 2003. [PubMed] [Google Scholar]
- 14. Esnault S.; Malter J. S. Hyaluronic acid or TNF-alpha plus fibronectin triggers granulocyte macrophage-colony-stimulating factor mRNA stabilization in eosinophils yet engages differential intracellular pathways and mRNA binding proteins. J. Immunol. 171:6780–6787; 2003. [DOI] [PubMed] [Google Scholar]
- 15. Fan X. C.; Steitz J. A. HNS, a nuclear-cytoplasmic shuttling sequence in HuR. Proc. Natl. Acad. Sci. USA 95:15293–15298; 1998. [DOI] [PMC free article] [PubMed] [Google Scholar]
- 16. Fan X. C.; Steitz J. A. Overexpression of HuR, a nuclear-cytoplasmic shuttling protein, increases the in vivo stability of ARE-containing mRNAs. EMBO J. 17: 3448–3460; 1998. [DOI] [PMC free article] [PubMed] [Google Scholar]
- 17. Figueroa A.; Cuadrado A.; Fan J.; Atasoy U.; Muscat G. E.; Gorospe M.; Muñoz A. Role of the RNA-binding protein HuR in C2C12 muscle cell differentiation. Mol. Cell. Biol. 23:4991–5004; 2003. [DOI] [PMC free article] [PubMed] [Google Scholar]
- 18. Fridman J. S.; Lowe S. W. Control of apoptosis by p53. Oncogene 22:9030–9040; 2003. [DOI] [PubMed] [Google Scholar]
- 19. Gouble A.; Grazide S.; Meggetto F.; Mercier P.; Delsol G.; Morello D. A new player in oncogenesis: AUF1/hnRNPD overexpression leads to tumorigenesis in transgenic mice. Cancer Res. 62:1489–1495; 2002. [PubMed] [Google Scholar]
- 20. Karin M.; Lin A. NF-κB at the crossroads of life and death. Nat. Immunol. 3:221–227; 2002. [DOI] [PubMed] [Google Scholar]
- 21. Keene J. D. Why is Hu where? Shuttling of early-response-gene messenger RNA subsets. Proc. Natl. Acad. Sci. USA 96:5–7; 1999. [DOI] [PMC free article] [PubMed] [Google Scholar]
- 22. Kullmann M.; Gopfert U.; Siewe B.; Hengst L. ELAV/Hu proteins inhibit p27 translation via an IRES element in the p27 5′UTR. Genes Dev. 16:3087–3099; 2002. [DOI] [PMC free article] [PubMed] [Google Scholar]
- 23. Kurdistani S. K.; Grunstein M. In vivo protein–protein and protein–DNA crosslinking for genomewide binding microarray. Methods 31:90–95; 2003. [DOI] [PubMed] [Google Scholar]
- 24. Levine T. D.; Gao F.; King P. H.; Andrews L. G.; Keene J. D. Hel-N1: An autoimmune RNA-binding protein with specificity for 3′ uridylate-rich untranslated regions of growth factor mRNAs. Mol. Cell. Biol. 13:3494–3504; 1993. [DOI] [PMC free article] [PubMed] [Google Scholar]
- 25. Levy N. S.; Chung S.; Furneaux H.; Levy A. P. Hypoxic stabilization of vascular endothelial growth factor mRNA by the RNA-binding protein HuR. J. Biol. Chem. 273:6417–6423; 1998. [DOI] [PubMed] [Google Scholar]
- 26. López de Silanes I, Fan J.; Yang X.; Zonderman A. B.; Potapova O.; Pizer E. S.; Gorospe M. Role of the RNA-binding protein HuR in colon carcinogenesis. Oncogene 22:7146–7154; 2003. [DOI] [PubMed] [Google Scholar]
- 27. López de Silanes I.; Zhan M.; Lal A.; Yang X.; Gorospe M. Identification of a target RNA motif for RNA-binding protein HuR. Proc. Natl. Acad. Sci. USA 101:2987–2992; 2004. [DOI] [PMC free article] [PubMed] [Google Scholar]
- 28. Ma W. J.; Cheng S.; Campbell C.; Wright A.; Furneaux H. Cloning and characterization of HuR, a ubiquitously expressed Elav-like protein. J. Biol. Chem. 271:8144–8151; 1996. [DOI] [PubMed] [Google Scholar]
- 29. Mazan-Mamczarz K.; Galbán S.; López de Silanes I.; Martindale J. L.; Atasoy U.; Keene J. D.; Gorospe M. RNA-binding HuR enhances p53 translation in response to ultraviolet light irradiation. Proc. Natl. Acad. Sci. USA 100:8354–8359; 2003. [DOI] [PMC free article] [PubMed] [Google Scholar]
- 30. Mellick A. S.; Day C. J.; Weinstein S. R.; Griffiths L. R.; Morrison N. A. Differential gene expression in breast cancer cell lines and stroma-tumor differences in microdissected breast cancer biopsies revealed by display array analysis. Int. J. Cancer 100:172–180; 2002. [DOI] [PubMed] [Google Scholar]
- 31. Millard S. S.; Vidal A.; Markus M.; Koff A. A U-rich element in the 5′ untranslated region is necessary for the translation of p27 mRNA. Mol. Cell. Biol. 20:5947–5959; 2000. [DOI] [PMC free article] [PubMed] [Google Scholar]
- 32. Oster S. K.; Ho C. S.; Soucie E. L.; Penn L. Z. The myc oncogene: Marvelously complex. Adv. Cancer Res. 84:81–154; 2002. [DOI] [PubMed] [Google Scholar]
- 33. Peng S. S.; Chen C. Y.; Xu N.; Shyu A.-B. RNA stabilization by the AU-rich element binding protein HuR, an ELAV protein. EMBO J. 17:3461–3470; 1998. [DOI] [PMC free article] [PubMed] [Google Scholar]
- 34. Russo G.; Zegar C.; Giordano A. Advantages and limitations of microarray technology in human cancer. Oncogene 22:6497–6507; 2003. [DOI] [PubMed] [Google Scholar]
- 35. Stoecklin G.; Gross B.; Ming X. F.; Moroni C. A novel mechanism of tumor suppression by destabilizing AU-rich growth factor mRNA. Oncogene 22: 3554–3561; 2003. [DOI] [PubMed] [Google Scholar]
- 36. Szabo A.; Dalmau J.; Manley G.; Rosenfeld M.; Wong E.; Henson J.; Posner J. B.; Furneaux H. M. HuD, a paraneoplastic encephalomyelitis antigen, contains RNA-binding domains and is homologous to Elav and Sex-lethal. Cell 67:325–333; 1991. [DOI] [PubMed] [Google Scholar]
- 37. Tenenbaum S. A.; Carson C. C.; Lager P. J.; Keene J. D. Identifying mRNA subsets in messenger ribonucleoprotein complexes by using cDNA arrays. Proc. Natl. Acad. Sci. USA 97:14085–14090; 2000. [DOI] [PMC free article] [PubMed] [Google Scholar]
- 38. Tenenbaum S. A.; Lager P. J.; Carson C. C.; Keene J. D. Ribonomics: Identifying mRNA subsets in mRNP complexes using antibodies to RNA-binding proteins and genomic arrays. Methods 26:191–198; 2002. [DOI] [PubMed] [Google Scholar]
- 39. Tonin P. N.; Hudson T. J.; Rodier F.; Bossolasco M.; Lee P. D.; Novak J.; Manderson E. N.; Provencher D.; Mes-Masson A. M. Microarray analysis of gene expression mirrors the biology of an ovarian cancer model. Oncogene 20:6617–6626; 2001. [DOI] [PubMed] [Google Scholar]
- 40. van der Giessen K.; Di-Marco S.; Clair E.; Gallouzi I. E. RNAi-mediated HuR depletion leads to the inhibition of muscle cell differentiation. J. Biol. Chem. 278: 47119–47128; 2003. [DOI] [PubMed] [Google Scholar]
- 41. Vawter M. P.; Barrett T.; Cheadle C.; Sokolov B. P.; Wood W. H. 3rd; Donovan D. M.; Webster M.; Freed W. J.; Becker K. G. Application of cDNA microarrays to examine gene expression differences in schizophrenia. Brain Res. Bull. 55:641–650; 2001. [DOI] [PubMed] [Google Scholar]
- 42. Wang W.; Caldwell M. C.; Lin S.; Furneaux H.; Gorospe M. HuR regulates cyclin A and cyclin B1 mRNA stability during the cell division cycle. EMBO J. 19:2340–2350; 2000. [DOI] [PMC free article] [PubMed] [Google Scholar]
- 43. Wang W.; Furneaux H.; Cheng H.; Caldwell M. C.; Hutter D.; Liu Y.; Holbrook N. J.; Gorospe M. HuR regulates p21 mRNA stabilization by ultraviolet light. Mol. Cell. Biol. 20:760–769; 2000. [DOI] [PMC free article] [PubMed] [Google Scholar]
- 44. Wilson K. S.; Roberts H.; Leek R.; Harris A. L.; Geradts J. Differential gene expression patterns in HER2/neu-positive and -negative breast cancer cell lines and tissues. Am. J. Pathol. 161:1171–1185; 2002. [DOI] [PMC free article] [PubMed] [Google Scholar]