

Abstract
The G protein Gαs is derived from four alternatively spliced transcripts, two long variants (GαsL+CAG and GαsL−CAG), which include an extra 45-bp segment, and two short variants (GαsS+CAG and GαsS−CAG). The long and short forms differ in each case by splicing in or out of a serine residue encoded at the 3′ end of the variable exon 3. The relative expression of all four variants in human tissues is poorly investigated due to experimental limitations. We therefore established a method for reliable relative mRNA quantification of these splice variants based on the Pyrosequencing technology, and determined Gαs transcript ratios in various human tissues and cells. GαsS/Gαs ratio was highest in blood mononuclear cells (0.84 ± 0.02, n = 16) and lowest in the brain (0.51 ± 0.14, n = 3). The different ranges resulted from differences in GαsS+CAG ratios, which ranged from a total Gαs ratio of 0.32 ± 0.07 (n = 12) in heart tissue to 0.57 ± 0.03 (n = 16) in blood mononuclear cells (p < 0.0001), whereas the GαsS−CAG ratio was rather constant and ranged from 0.22 ± 0.04 (n = 7) in retinoblastoma cells to 0.27 ± 0.04 in lymphocytes (p = 0.19). The GαsL+CAG ratio ranged from 0.02 ± 0.02 in heart tissue to 0.05 ± 0.01 in retinoblastoma cells, with a varying proportion of GαsL−CAG, which ranged from 0.14 ± 0.02 in blood mononuclear cells to 0.41 ± 0.08 in heart tissue. Stimulation of immortalized B lymphoblasts with isoproterenol resulted in significant changes of splice variant ratios. Our data indicate that changes of long and short ratios of Gαs in different tissues affected GαsL−CAG and GαsS+CAG rather than GαsL+CAG and GαsS−CAG. Furthermore, stimulation of cells seemed to affect splice variant ratios. These results are, therefore, suggestive of different biological functions of these variants.
Key words: G proteins, Splice variants, Pyrosequencing, Signal transduction, Quantification
THE G proteins are a family of guanine-nucleotide binding proteins that are involved in various transmembrane signaling pathways. The stimulatory G protein, Gαs, mediates stimulation of adenylyl cyclase and the production of the second messenger cyclic AMP (cAMP) via a number of receptor types (e.g., β1- and β2-adrenoreceptors). cAMP subsequently activates protein kinase A (PKA), which catalyzes the phosphorylation of various proteins important for cellular signaling. Two ubiquitously expressed forms of Gαs have been identified via ADP-ribosylation with cholera toxin or by Western blotting. Depending on experimental conditions, they migrate in SDS-PAGE with apparent molecular masses of 52 and 45 kDa, and have been referred to as GαsL and GαsS, respectively (15,22,27). Both isoforms of Gαs are generated by alternative splicing of a single precursor mRNA transcript. In humans, a single copy of the Gαs gene (GNAS) is found on chromosome 20, which is composed of 13 exons separated by 12 introns, altogether spanning a 20-kb region of genomic DNA (15). Cloning of the human GNAS and Gαs complementary DNAs showed that GαsS differs from GαsL by the exclusion of the 45-bp exon 3, which encodes 15 amino acids. Furthermore, it was predicted that these two variants consist of two isoforms that differ by splicing in or out a serine residue encoded at the 3′ end of the variable 45-bp segment of exon 3. Incorporation of this additional CAG triplet results from the use of a noncanonical TG 3′ splice site preceding exon 4 (2,24) (Fig. 1). It has been suggested that inclusion of this extra serine residue into Gαs proteins confers additional consensus sequence sites for phosphorylation by protein kinases C and A (25,26). Tissue-dependent alternative splicing of the Gαs precursor transcript may, therefore, result in the expression of two long and two short forms of Gαs proteins, depending upon the presence or absence of this extra serine residue.
Figure 1.
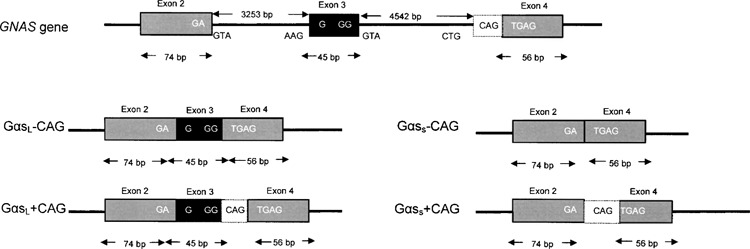
Exon/intron organization map of exons 2–4 of human GNAS. Constitutively spliced exons (2 and 4) are represented by gray boxes and the alternatively spliced exon 3 by a black box. In addition to the consensus 3′ splice motif “AG” preceding exon 4, GNAS also has a noncanonical 3′ splice site (TG). Use of the TG 3′ splice site incorporates an additional CAG triplet into the spliced mRNA, resulting in an extra serine residue (white box). The four different mRNA species generated from alternative splicing are shown.
Many investigators determined potentially different regulatory functions of the Gαs splice variants ((32,35,37,42); however, the discussion about different functions is still ongoing [see (12) for review]. Furthermore, there is substantial evidence that the expression of alternatively spliced isoforms of Gαs differ in various tissues. As an example, GαsL was shown to predominate in cerebellum, cortex, kidney, adrenal medulla, and placenta (7,8,22), whereas GαsS is predominant in platelets, liver, neostriatum, and heart (4,14,22). Significant changes in steady-state mRNA and protein levels of Gαs isoforms have also been observed during ontogenetic development, aging, cellular differentiation, and in pathophysiological states such as obesity, hypertension, diabetes, and alcoholism (23). Further evidence for variable isoform expression was obtained in the human myometrium, where GαsS and GαsL were found to be significantly increased during gestation and subsequently downregulated during labor, this effect being accompanied by a concomitant increase and decrease, respectively, of adenylyl cyclase activity (6). These observations support the hypothesis that the expression of alternatively spliced isoforms of Gαs is regulated in a tissue-specific manner, depending on the activity requirements of the individual tissue. Quantification of the relative proportions of the four splice variants appears essential to better understand the potentially different molecular and signaling properties of these variants.
Many techniques have been developed for determining relative proportions of splice variants on mRNA level including Northern blotting (30), ribonuclease protection assay (13,29,30), and real-time PCR (39). All these methods have their intrinsic limitations. Northern blotting requires relatively large amounts of RNA, and is only suitable for determining relative concentrations of mRNA transcripts that occur in moderate to high abundance. RNase protection analysis is more sensitive than Northern blotting, with the possibility of detection of small sequence variations. However, low abundance transcripts are difficult to detect using this technique. Recently, realtime quantitative PCR was developed, which overcame the limitations inherent to conventional quantification methods. However, reliable standard curves for two different PCR reactions have to be carried out, which is critical for this kind of analysis. Furthermore, when using exon boundary probes or primers, specificity may be impaired due to sequence homologies (39). Finally, complex splice variants like the Gαs transcript with four different sequences at the exon boundary are difficult to quantify using this technique as well as with other techniques (10,21,24).
We developed a technique for accurate quantification of splice variants even for complex spliced genes like GNAS, taking advantage of the Pyrosequencing technology. Pyrosequencing was originally developed for single nucleotide polymorphism (SNP) analysis. Using a four-enzyme mixture, this sequencing-by-synthesis method relies on the luminometric detection of pyrophosphate released upon nucleotide incorporation (1,28). Each light signal is proportional to the number of incorporated nucleotides, which was confirmed by assessing SNP allelic frequencies in pooled DNA samples (11,41). We therefore postulated that the relative amount of splice variants in cDNA samples can be detected by choosing appropriate sequencing primers and dispensation orders of the nucleotides and by calculating splice variant ratios from the corresponding peak heights. To test this hypothesis, we first constructed plasmids with all possible Gαs splice variant cDNAs and carried out calibration plots with mixtures of all possible splice variant plasmids and dilution series to prove that the peak heights calculated from the measured light by luminometry is proportional to incorporated nucleotides. We then determined ratios of Gαs splice variant transcripts in various cell lines and tissues. Finally, we compared our results with those obtained through real-time PCR.
MATERIALS AND METHODS
Cells and Tissue Samples
Blood Mononuclear Cells
Peripheral blood mononuclear cells (PBMCs) from 16 patients with CLL were isolated by Ficoll-Hypaque (Pharmacia, Erlangen, Germany) density centrifugation and washed in Iscove modified Dulbecco medium (Gibco BRL, Karlsruhe, Germany). One to 2 × 10⁸ PBMCs were used for RNA preparation.
Urothelial Tumor Tissue
Urothelial tumor tissue was obtained from 12 patients undergoing transurethral resection or cystectomy due to bladder cancer and tissue was snap-frozen in liquid nitrogen directly after dissection.
B Lymphoblast Cell Lines
Human Epstein-Barr virus immortalized lymphoblasts from 17 individuals were grown in RPMI-1640 medium supplemented with 2 mM l-glutamine, 10% fetal bovine serum, 100 U/ml penicillin, and 100 μg/ml streptomycin (PAA, Pasching, Austria) at 37°C in a humidified atmosphere of 5% CO2 in air, as previously described (33). One day before RNA preparation, lymphoblasts were subcultured at a density of 5–10 × 105/ml into fresh medium and a total of 5–10 × 106 cells were used for RNA preparation. For stimulation, cells from four different individuals were subcultured at the same time into fresh medium and stimulated with 100 nM isoproterenol in the log phase of growth (2 × 10⁶ cells/ml).
Human Retinoblastoma Cell Lines
Cell lines from seven different human retinoblastomas were provided by the Institute of Cell Biology, University Hospital, Essen. Cells were grown in DMEM D7777 medium (Sigma) supplemented with 4 mM l-glutamine, 15% fetal bovine serum (PAA), 100 U/ml penicillin, 100 μg/ml streptomycin (PAA), 10 μg/ml insulin (Sigma, Deisenhofen, Germany), and 50 μM β-mercapthoethanol (Sigma) at 37°C in a humidified atmosphere of 5% CO2 in air, as previously described. A total of 4 × 10⁶ cells were used for RNA preparation.
Heart Tissue
Adult human right atrial specimens were obtained from 15 patients undergoing cardiac surgery as described previously (5).
Brain
Brain specimens were obtained during neurosurgery in patients with glioma. All brain tissue samples were immediately snap frozen in liquid nitrogen during the surgical procedure.
Adipose Tissue
Mammary adipose tissue was obtained from 16 women undergoing elective mammary reduction surgery (12). All adipose tissue samples were immediately snap frozen in liquid nitrogen during the surgical procedure. RNA was prepared using the RNeasy Kit obtained from Qiagen (Hilden, Germany) according to the manufacturer’s instructions. RNA from adipose tissue was prepared using a modified protocol. Briefly, up to 500 mg adipose tissue was mixed with 600 μl RLT lysis buffer (Qiagen) and mechanically homogenized for 1 min followed by centrifugation at 13,000 rpm for 1 min. The supernatant was saved followed by addition of 70% ethanol. The pellet was resuspended in 300 μl RLT buffer and centrifuged for 1 min at 13,000 rpm. The supernatants from both centrifugation steps were combined, loaded onto a RNeasy column, and processed following the manufacturer’s instructions.
Plasmid Construction
cDNA from human immortalized lymphoblasts was used for amplifying and cloning the full length Gαs cDNA. Primer sequences were 5′-catgggctgcctcgggaa-3′ and 5′-ttagagcagctcgtactgac-3′. PCR conditions were as follows: 95°C for 30 s, 52°C for 30 s, and 72°C for 2 min for 40 cycles. The resulting 1253-bp PCR product was cloned into the pGEM-T easy vector (Promega, Madison, WI). Plasmid DNA from six positive clones containing the inserts was extracted and sequenced (GATC, Konstanz, Germany). Four clones were identified representing GαsS+CAG and two clones representing GαsL−CAG. Site-directed mutagenesis was used to construct GαsS−CAG and GαsL+CAG. Briefly, 100 ng of pGEM-GαsS+CAG and pGEM-GαsL−CAG were methylated with 4u HpaII DNA methylase (Invitrogen, Karlsruhe, Germany) for 1 h at 37°C followed by amplification of the plasmid in a mutagenesis reaction with two overlapping primers, one of which contains the target mutation resulting in a linear, double-stranded DNA containing the mutation. For pGEM-GαsS+CAG primers were 5′-gttaatgggtttaatggagatgagaaggcaa-3′ and 5′-tctccattaaacccattaacatgcaggatcct-3′, resulting in pGEM-GαsS−CAG For pGEM-GαsL+CAG primers were 5′-gcaaggagcaacagcgatggcagtgagaaggcaa-3′ and 5′-ggcgtccgacgttcctcgttgtcgctacc-3′, resulting in pGEM-GαsL+CAG. Transformation of DH5α-T1 competent cells (Invitrogen) led to circularization of the linear mutated DNA followed by digestion of the methylated template by McrBC endonuclease in the host cell leaving only unmethylated, mutated product.
RT-PCR
First-strand cDNA was synthesized from ∼1 μg of total cellular RNA with oligo-dT primers (Roche, Mannheim, Germany) by using M-MLV reverse transcriptase as recommended by the manufacturer (Invitrogen). The resulting cDNA was diluted 1:10, and 3 μl of the dilution was used for PCR. Discrimination of GαsS and GαsL was carried out by using Gαs-specific primers GNAS_RT_Se2 5′-gcaccattgtgaagcagatg-3′ and GNAS_RT_AS2 5′-tcaatcgcctctttcaggtt-3′, resulting in a 150-bp product for GαsL and 108 bp for GαsS (Fig. 2). Amplification of the housekeeping gene human glyceraldehydes-3-phosphate dehydrogenase (GAPDH) was performed in all samples to verify the integrity of the ribonucleic acid. Primers for human GAPDH were 5′-GAAGGTGAAGGTCGGAG-3′ and 5′-GAAGATGGTGATGGGATT-3′, resulting in a 225-bp fragment. PCR conditions for GAPDH were as follows: 95°C for 30 s, 56°C for 30 s, and 72°C for 40 s for 35 cycles. Amplification of the GAPDH pseudogene was excluded by DNAse treatment of RNA prior to the RT reaction and was tested by PCR using RNA as template.
Figure 2.
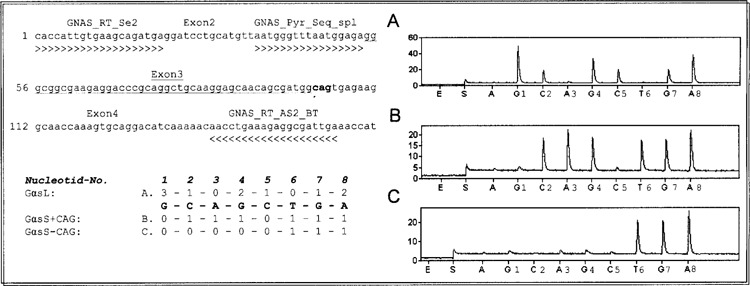
Discrimination of GαsL, GαsS+CAG, and GαsS−CAG variants. PCR primers were designed to span the alternatively spliced exon 3. The sequencing primer binds directly 5′ of exon 3 and detects exon 3 for GαsL as well as the additional CAG for GαsS+CAG and GαsS−CAG (upper left). The order in which each nucleotide was added into the Pyrosequencing reaction was chosen to yield single peaks in the pyrogram for certain splice variants. The numbers represent the quantity of nucleotides given by the sequence for the different variants (lower left). Plasmids pGEM-GαsL−CAG, pGEM-GαsS+CAG, and pGEM-GαsS−CAG were used to test if peak heights were comparable. The right side shows typical pyrograms resulting after sequencing of PCR products from plasmids. (A) pGEM-GαsL−CAG. (B) pGEM-GαsS+CAG. (C) pGEM-GαsS−CAG. GαsL−CAG can clearly be distinguished from the GαsS forms by producing a cytosine peak at position 5 while lacking a thymidine peak at position 6 (A). GαsS+CAG ratios can be calculated by subtracting cytosine at position 5 from cytosine at position 2 and comparing to thymidine at position 6, while GαsS−CAG ratios are calculated by subtracting the cytosine peak at position 2 from the guanosine peak at position 7 and comparing to thymidine at position 6 (B + C). All PCR reactions were carried out under the same conditions. GNAS_RT_Se2 and GNAS_RT_AS2_BT: PCR primers; GNAS_Pyr_Seq_spl: sequencing primer.
Quantification of Splice Variants
Ratios of splice variants were determined using Pyrosequencing, which is a “sequencing by synthesis” method. A sequencing primer is hybridized to a single-stranded, PCR-amplified DNA template, and incubated with the enzymes DNA polymerase, ATP sulfurylase, luciferase, and apyrase, and the substrates adenosine 5′ phosphosulfate and luciferin. DNA polymerase catalyzes the incorporation of the deoxynucleotide triphosphate into the DNA strand. Each incorporation event is accompanied by the release of pyrophosphate at a quantity equimolar to the amount of incorporated nucleotide followed by an enzymatic conversion into visible light, which is detected by a charge-coupled device camera and seen as a peak in a pyrogram™. Ratios of GαsL and GαsS as well as GαsS+CAG and GαsS−CAG were determined by PCR and Pyrosequencing using the primers GNAS_RT_Se2 and biotinylated GNAS_RT_AS2 as described above. Pyrosequencing was carried out using the sequencing primer GNAS_Pyr_Seq_sp1 5′-aatgggtttaatggaga-3′ (Fig. 2). Deoxyadenosine α-thio triphosphate (dATPαS) was used as a substitute for the natural deoxyadenosine triphosphate (dATP) because it is efficiently used by the DNA polymerase, but is not recognized by the luciferase. Because the light signal resulting from dATPαS was not exactly proportional to the number of nucleotides added, peak heights produced by dATPαS were excluded from further calculations. Ratios of GαsL and GαsS were calculated as follows. First, to test for background signals, the C5 peak, which represents the long variant, was added to the T6 peak, which represents the short variant, and compared with G7, which represents both variants (Fig. 5A). Only those samples were analyzed in which the difference between C5 + T6 and G7 was less than 0.5. GαsS/Gαs ratio was calculated as T6 divided by G7. GαsL/Gαs ratio was C5 divided by G7. GαsS+CAG/GαsS ratio was determined by calculating (C2 − C5)/T6 and GαsS-−AG/GαsS was calculated by (G7 − C2)/T6 (Fig. 2). Ratios of GαsL+CAG and GαsL−CAG were determined using the primer GNAS_RT_Se3 5′-aagaggacccgcaggct-3′, which binds to exon 3 and, therefore, can amplify GαsL only and biotinylated GNAS_RT_AS2. Pyrosequencing was carried out using sequencing primer GNAS_Pcr_Seq_spl2 5′-aaggagcaacagcga-3′ (Fig. 3). Ratios of GαsL+CAG and GαsL−CAG were calculated as follows: GαsL+CAG/GαsL = C12/G15 and GαsL−CAG/GαsL = G13/G15 (Fig. 3). Only those samples were analyzed in which the difference between C12 + G13 and G15 was less than 0.5.
Figure 5.
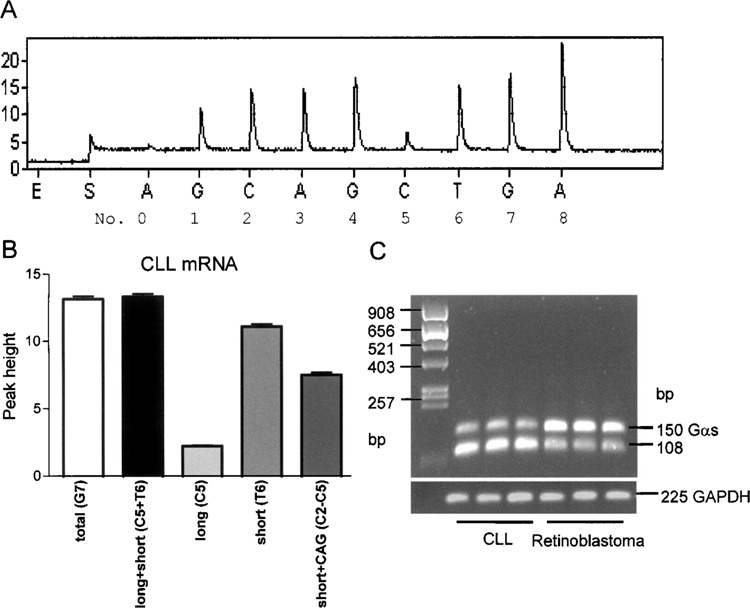
Determination of GαsS/GαsL ratios from blood mononuclear cells and retinoblastoma cells. (A) Representative pyrogram of a CLL sample. PCR from cDNA from blood mononuclear cells was performed using primers GNAS_RT_SE2 and GNAS_RT_AS2_BT. Peak heights were determined using Pyrosequencing software. (B) Peak heights and calculations derived from CLL samples. Accuracy of the method was confirmed by comparing G7 (mean peak height 13.14 ± 0.90), which represents both isoforms and C5 + T6 (13.34 ± 0.85; p = 0.53 t-test), which represent the long and the short variants. (C) Agarose gel from three CLL and three retinoblastoma samples displaying different splicing patterns. Data are means ± SEM.
Figure 3.
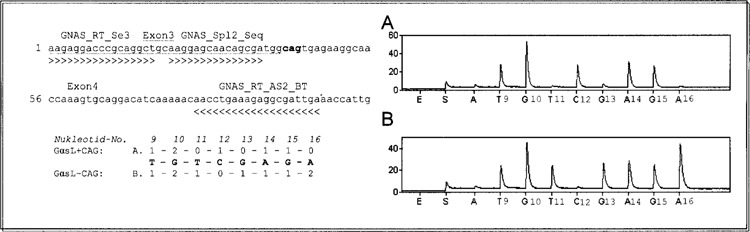
Discrimination of GαsL+CAG and GαsL−CAG. PCR sense primer was designed to align in exon 3, resulting in amplification of GαsL only (upper left). The order in which each nucleotide was added into the Pyrosequencing reaction was chosen to achieve unique peaks in the pyrogram for the different splice forms. The numbers represent the quantity of nucleotides given by the sequence for the different variants (lower left). Plasmids pGEM-GαsL+CAG and pGEM-GαsL−CAG were used to test if peak heights were comparable. The right side shows typical pyrograms resulting after sequencing of PCR products from plasmids. (A) pGEM-GαsL+CAG. (B) pGEM-GαsL−CAG. GαsL+CAG can clearly be distinguished from GαsL−CAG by producing a unique peak at cytosine 12 (A) while lacking a peak at guanine 13 (B). All PCR reactions were carried out under the same conditions. GNAS_RT_Se3 and GNAS_RT_AS2_BT: PCR primers; GNAS_Spl2_seq: sequencing primer.
Real-Time Quantitative PCR
The following primers were used for real-time PCR. Gαs: GNAS_RT_Se2 and GNAS_RT_AS2, GαsL: GNAS_RT_Se3 and GNAS_RT_AS2. PCR conditions were as described above. DNA amplification was excluded by DNAse treatment of all RNA samples and confirmed by PCR using RNA as template. The PCR reaction mix was prepared using the Quantitect SYBR Green Kit (Qiagen) following the manufacturer’s instructions. The PCR reaction was performed in the ABI Prism 7700 Sequence Detection System (Applied Biosystems, Foster City, CA). All samples were analyzed in duplicate in the same run to yield comparable results. Relative RNA expression was quantified using the comparative Ct method as described previously (9,19) where Ct is the number of cycles at which the fluorescence signal reaches a predefined threshold. Briefly, fold change of Gαs compared with GαsL was estimated using the following formula: 2−ΔCt, where ΔCt = [Ct Gαs − Ct GαsL]. Each Ct represents the mean Ct value of every sample duplicate. A cDNA dilution series for Gαs and GαsL proved that the rate of Ct change versus the rate of target cDNA copy change was identical for both the Gαs and GαsL, and also that PCR efficiency was >95%.
Statistical Methods
All data are expressed as means ± SEM. Continuous variables were compared using Student’s t-test or analysis of variance (ANOVA). Data were regarded significantly different if the affiliated value p < 0.05.
RESULTS
Establishment of the Method for Splice Variant Quantification
For discrimination of GαsL, GαsS+CAG, and GαsS−CAG, PCR primers were designed to span the alternatively spliced exon 3 of GNAS. The sequencing primer was designed to align in exon 2 at the exon 2/3 boundary to detect exon 3 for GαsL as well as the additional CAG for GαsS+CAG and to discriminate between GαsS+CAG and GαsS−CAG (Fig. 2). The order in which each nucleotide was added into the Pyrosequencing reaction was chosen to yield single peaks in the pyrogram for GαsS+CAG and GαsL. To test whether peaks heights were comparable for all PCR reactions, plasmids with cDNA encoding all four different possible splice variants were constructed as described in Materials and Methods. PCR from pGEM-GαsS+CAG, pGEM-GαsS−CAG, and pGEM-GαsL−CAG were conducted under identical conditions and representative pyrograms are shown in Figures 2 and 3. Peak heights did not differ significantly between the three isoforms. But all three isoforms could clearly be distinguished by analyzing those peaks that were solely produced by the respective variants: whereas GαsL exhibited a single peak at C5 (Fig. 2A), GαsS showed a single peak at T6 (Fig. 2B, C). For discrimination of GαsL+CAG and GαsL−CAG, the PCR sense primer was designed to bind to exon 3, resulting in amplification of GαsL only (Fig. 3). Again, the variants could clearly be differentiated by analyzing those peaks that were solely produced by each variant: a peak at position C12 for GαsL+CAG (Fig. 3A) and a peak at T11 and G13 for GαsL−CAG (Fig. 3B).
To test whether the peak heights in the pyrogram were proportional to the number of nucleotides added and, therefore, reflected the ratios of splice variants, plasmid DNA with a concentration of 1 μg/μl containing GαsL−CAG and GαsS+CAG was mixed at different proportions and PCR was carried out on the mixtures with primers as shown in Figure 2. Figure 4A shows a representative agarose gel with different proportions of the long and short variant. Different ratios of Gαs splice variants could clearly be differentiated using a semiquantitative approach, although staining of the agarose gel with ethidium bromide resulted in brighter upper bands due to increased ethidium bromide intercalation into longer PCR products (30). Subsequently we subjected known ratios of GαsL/GαsS to analysis by Pyrosequencing and we calculated the ratios by dividing C5/T6. Linear regression analysis clearly confirmed a linear relationship between the measured and expected ratios over the whole range tested (Fig. 4B). Similar calibration plots were established for the discrimination of GαsL−CAG and GαsL+CAG, which also showed a linear relationship over the whole range of dilutions investigated (Fig. 4C). These experiments prove that the Pyrosequencing method is indeed appropriate for determining ratios of splice variant mRNAs.
Figure 4.
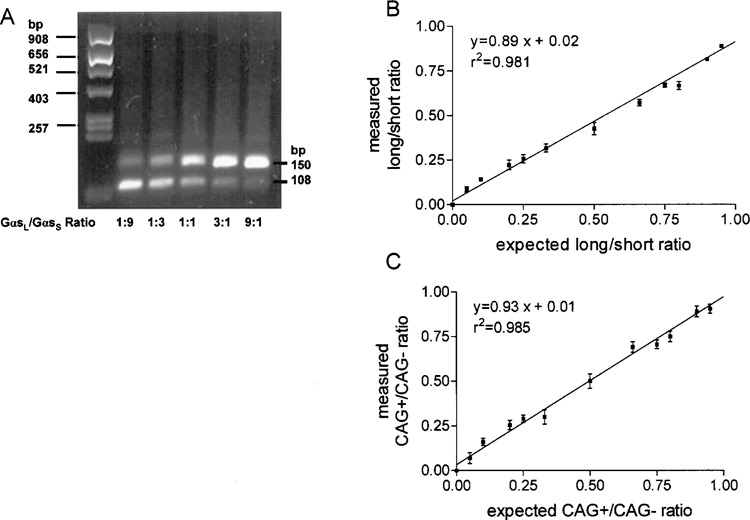
Calibration plot for determination of ratios of Gαs using the Pyrosequencing method. (A) Plasmids containing full-length cDNA of GαsL−CAG and GαsS+CAG were mixed at different ratios in which C5 represents the long form and T6 the short form (Fig. 2). Plasmids were mixed as indicated and PCR was carried out with primers GNAS_RT_Se2 and GNAS_RT_AS2_BT. Products were visualized on a 2.5% agarose gel. Staining of the agarose gel with ethidium bromide resulted in brighter upper bands due to enhanced ethidium bromide intercalation into longer PCR products. (B) Sequencing was carried out using sequencing primer GNAS_Pyr_Seq_spl and peak heights were determined using Pyrosequencing software. Ratios were measured as (C5/G7) + (1 − T6/G7)]/2, with G7 representing peak height for both forms and plotted versus the expected ratios. (C) Plasmids containing full-length cDNA of GαsL−CAG and GαsL+CAG were mixed at different ratios in which C12 represents the +CAG form and G13 the −CAG form (Fig. 3). PCR was carried out with primers GNAS_RT_Se3 and GNAS_RT_AS2_BT. Ratios were measured as [(C12/G15) + (1 − G13/G15)]/2 with G15 representing peak height for both forms and plotted versus the expected ratios. For each data point two independent determinations were performed. A linear relationship between measured and calculated ratios over the whole range of tested ratios could be confirmed. Data are means ± SEM. r 2 = goodness of fit (values can range from 0.0 to 1.0; prediction of x values from y values is possible with a value close to 1.0).
Determination of Gαs Splice Variants in Different Tissues and Cell Lines
Figure 5 shows a representative example of the quantification of GαsS/GαsL ratios. PCR on cDNA from blood mononuclear cells from CLL patients was performed using primers as shown in Figure 2 and analyzed by Pyrosequencing, resulting in a pyrogram as shown in Figure 5A. Peak heights were calculated by the software (Fig. 5B) and ratios were calculated as described in Materials and Methods. Figure 5C shows a representative agarose gel of separated PCR products from three CLL and three retinoblastoma samples, which obviously display different splicing patterns.
Using Pyrosequencing we quantified the exact ratios of all four Gαs transcript variants in different human tissues and cell lines. GαsS was the predominant form in all investigated tissue and cells except of brain tissue. The highest GαsS/Gαs ratio was found in blood mononuclear cells from patients with B-CLL (0.84 ± 0.02, n = 16) and the lowest ratio in brain tissue (0.51 ± 0.14, n = 3) followed by retinoblastoma (RB) cells (0.57 ± 0.06, n = 7; p < 0.0001 (Fig. 6, Table 1). The different proportions almost exclusively resulted from differences in GαsS+CAG ratios, which ranged from total Gαs ratio of 0.32 ± 0.07 (n = 12) in heart tissue to 0.57 ± 0.03 (n = 16) in mononuclear cells from patients with B-CLL (p < 0.0001 ANOVA), whereas the GαsS−CAG ratio was rather constant and ranged from 0.22 ± 0.04 in retinoblastoma cells to 0.27 ± 0.04 in CLL samples (p = 0.19 ANOVA) (Fig. 6, Table 1). Similar observations were made for GαsL ratios. Only a small amount of GαsL+CAG was detected, which ranged from 0.02 ± 0.02 in heart tissue to 0.08 ± 0.08 in brain tissue (Fig. 6, Table 1). In contrast, the ratios of GαsL−CAG ranged from 0.14 ± 0.02 in CLL samples to 0.45 ± 0.06 in brain tissue, followed by 0.41 ± 0.08 in heart.
Figure 6.
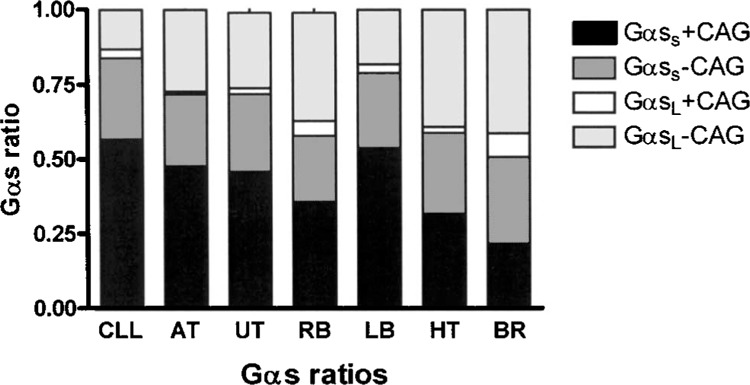
Absolute ratios of Gαs variants in different human tissues and cell lines. Ratios were calculated as follows with respect to Figures 2 and 3: GαsS+CAG: (C2 − C5)/G7; GαsS−CAG: (G7 − C2)/G7; GαsL+CAG: (C12/T9) × (C5/G7); GαsL−CAG: (T11/T9) × (C5/G7). CLL: blood mononuclear cells from patients with chronic lymphatic leukemia (n = 16), AT: adipose tissue (n = 26), UT, urothelial tumor tissue (n = 12), RB: human retinoblastoma cell lines (n = 7), LB: B lymphoblast cell lines (n = 17), HT: heart muscle tissue (n = 12), BR: brain tissue (n = 3).
TABLE 1.
ABSOLUTE RATIOS OF Gαs SPLICE VARIANTS IN DIFFERENT CELLS AND TISSUES
| n | GαsS | GαsL | |||||
|---|---|---|---|---|---|---|---|
| GαsS | GαsS+CAG | GαsS−CAG | GαsL | GαsL+CAG | GαsL−CAG | ||
| CLL | 16 | 0.84 ± 0.02 | 0.57 ± 0.03 | 0.27 ± 0.04 | 0.17 ± 0.02 | 0.03 ± 0.01 | 0.14 ± 0.02 |
| AT | 26 | 0.71 ± 0.06 | 0.48 ± 0.05 | 0.24 ± 0.05 | 0.29 ± 0.06 | 0.04 ± 0.01 | 0.27 ± 0.04 |
| UT | 12 | 0.78 ± 0.12 | 0.46 ± 0.06 | 0.26 ± 0.06 | 0.28 ± 0.06 | 0.02 ± 0.01 | 0.25 ± 0.04 |
| RB | 7 | 0.57 ± 0.06 | 0.36 ± 0.04 | 0.22 ± 0.04 | 0.44 ± 0.05 | 0.05 ± 0.01 | 0.36 ± 0.04 |
| LB | 17 | 0.79 ± 0.04 | 0.54 ± 0.05 | 0.25 ± 0.04 | 0.23 ± 0.03 | 0.03 ± 0.01 | 0.19 ± 0.06 |
| HT | 12 | 0.59 ± 0.05 | 0.32 ± 0.07 | 0.27 ± 0.05 | 0.45 ± 0.07 | 0.02 ± 0.02 | 0.41 ± 0.08 |
| BR | 3 | 0.51 ± 0.14 | 0.22 ± 0.11 | 0.29 ± 0.03 | 0.54 ± 0.11 | 0.08 ± 0.01 | 0.45 ± 0.06 |
Data are means ± SEM. Ratios were calculated as follows (see also Figs. 2 and 3): GαsS+CAG: (C2 − C5)/G7; GαsS−CAG: (G7 − C2)/G7; GαsL+CAG: (C12/T9) × (C5/G7); GαsL−CAG: (T11/T9) × (C5/G7). CLL: blood mononuclear cells from patients with chronic lymphatic leukemia, AT: adipose tissue, UT, urothelial tumor tissue, RB: human retinoblastoma cell lines, LB: B lymphoblast cell lines, HT: heart muscle tissue, BR: brain tissue.
Change of Splice Variant Ratios After Stimulation of Cells With Isoproterenol
To investigate whether Gαs splice variant ratios are subject to changes upon stimulation of cells, we determined the effect of isoproteronol on splice variant ratios in EBV-immortalized lymphoblast from four different individuals. Gαs mRNA expression decreased slightly but not significantly by 10% after 8 h of treatment and returned to the initial level after 24 h (Fig. 7). Isoproterenol stimulation resulted in a slight decrease in GαsS/Gαs ratio with a maximum after 8 h (Fig. 8A) and a corresponding increase in GαsL/Gαs ratio (Fig. 8B). Interestingly, within the short and long variants, the ratios of +/−CAG variants changed significantly after 4 h of isoproterenol treatment, with an increase of +CAG variants and a decrease of −CAG variants. The GαsS+CAG/GαsS ratio increased from 0.55 ± 0.02 at baseline to a maximum of 0.64 ± 0.02 after 4 h (p < 0.05) (Fig. 8C). The GαsL+CAG/GαsL ratio increased from 0.08 ± 0.01 at baseline to a maximum of 0.17 ± 0.01 after 4 h (p < 0.05) (Fig. 8D). After 24 h of treatment, initial splice variant ratios were reestablished (Fig. 8).
Figure 7.
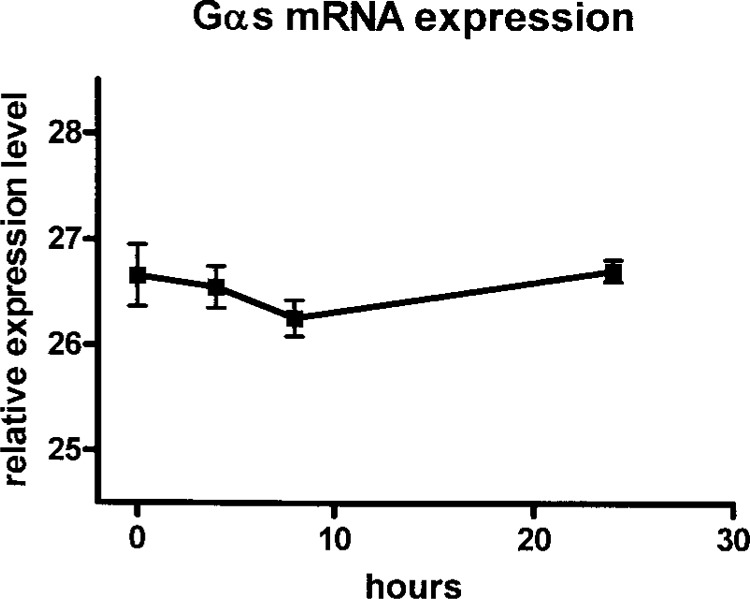
Relative Gαs expression in isoproterenol-stimulated EBV-transformed B lymphoblasts. Lymphoblasts (5 × 10⁶) from four different individuals were stimulated with isoproterenol (100 nM) and relative mRNA expression was determined at indicated time points using real-time PCR analysis. RNA (1 μg) was used for the RT reaction and all expression levels were measured in duplicate in the same assay. Relative expression levels are given as Ct values of the maximum of cycles (45) minus measured Ct values. No significant changes in Gαs expression were detectable. Fold change of expression at 8 and 24 h compared with baseline (0 h) using the 2−ΔCt formula was 0.9 and 1.04. Data are expressed as means ± SEM.
Figure 8.
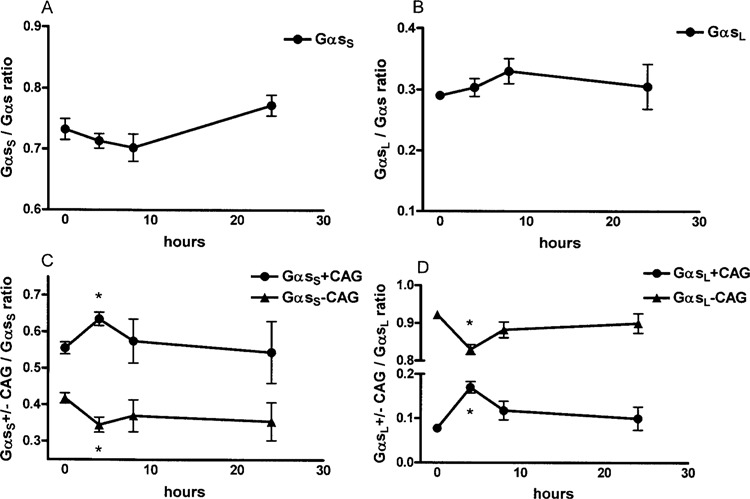
Isoproterenol-induced changes of Gαs splice variant ratios. Lymphoblasts (5 × 10⁶) from four different individuals were stimulated with isoproterenol (100 nM) and splice variant ratios were determined at indicated time points as described in Materials and Methods. Isoproterenol stimulation resulted in a slight decrease in GαsS/Gαs ratio with a maximum after 8 h (A) and a corresponding increase in GαsL/Gαs ratio (B). Within the short variant, the ratios of +/−CAG variants changed significantly after 4 h of isoproterenol treatment with an increase of +CAG variants and a decrease of −CAG variants. The GαsS+CAG/GαsS ratio increased from 0.55 ± 0.02 at baseline to a maximum of 0.64 ± 0.02 after 4 h (p < 0.05). After 24 h, baseline values were reached again (C). The same effect was observed for +/−CAG variants within the long variant. The GαsL+CAG/GαsL ratio increased from 0.08 ± 0.01 at baseline to a maximum of 0.17 ± 0.01 after 4 h (p < 0.05) and returned to baseline values after 24 h (D). All experiments were repeated at least twice at different time points with similar results. Data are expressed as means ± SEM.
Comparison of Pyrosequencing and Real-Time PCR
The accuracy of quantifiying splice variants by Pyrosequencing was tested by comparison of the Py-rosequencing method with real-time PCR. Real-time PCR can be used for relative quantification of Gαs/GαsL by determining relative expression of Gαs and GαsL with two different PCRs (39) and determination of fold changes as described in Materials and Methods. Three independent retinoblastoma and three CLL cDNAs were analyzed for Gαs/GαsL ratios. The same cDNAs were used for comparison of Pyrosequencing and real-time PCR results. Pyrosequencing resulted in 5.36 ± 0.093 Gαs/GαsL ratio for CLL and 2.49 ± 0.158 for retinoblastoma (p < 0.0001), whereas realtime PCR using SYBR green yielded ratios of 4.79 ± 0.382 and 2.51 ± 0.326, respectively (p < 0.05) (Fig. 9). Thus, Pyrosequencing results could be reproduced by an independent method (real-time PCR), suggesting that Pyrosequencing actually provides a reliable means for splice variant quantification.
Figure 9.
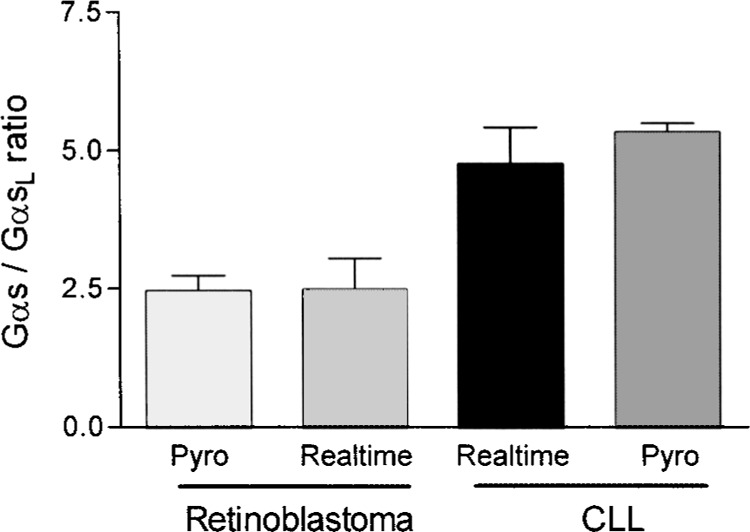
Comparison of Pyrosequencing and real-time PCR method for quantifying Gαs splice variants. Three retinoblastoma and three CLL cDNAs were analyzed for Gαs total to Gαs long ratios. The same cDNAs were used for comparing Pyrosequencing and real-time PCR results. Pyrosequencing results in 5.36 ± 0.093 ratio for CLL and 2.49 ± 0.158 for retinoblastoma (p < 0.0001), whereas real-time PCR using SYBR green leads to 4.79 ± 0.382 and 2.51 ± 0.326 (p < 0.05), indicating Pyrosequencing to be the more precise method for quantification of splice variants.
DISCUSSION
Quantification of the relative expression of splice variants of certain genes appears essential for the ultimate understanding of their biological roles and functional differences in different tissues and cells (34). Various methods have been applied for quantification of Gαs splice variants on mRNA and protein level, which yielded only rough estimates because of the complex splicing of the gene resulting in the generation of four alternatively spliced variants (4,6,8,10,14,21,24). Pyrosequencing allows accurate and reproducible quantification of relative splice variant expression on the mRNA level over a broad range of ratios (Fig. 2) and, therefore, appears suitable for determination of as little amounts as those seen for GαsL+CAG (2–5%, Table 1). Moreover, specific splice variants like the one characterized by the extra +CAG at 5′ of exon 4, which was difficult to determine by other methods (10,21,24), can be quantified exactly using this method. Finally, we were able to exactly quantify three different splice variants using one primer pair in one single sample preparation for each tissue or cell type (Fig. 2). While real-time PCR used to be the gold standard for RNA quantification, its application for quantification of splice variants is limited, especially if PCR products have similar sizes. PCRs with two different primer sets have to be carried out with the potential risk of carrying out PCR reactions with different efficiencies due to variable primer binding properties, which potentially results in shifted ratios (9,19). To overcome this problem, reproducible standard curves must be established, which can be achieved only after extensive setup procedures. Furthermore, quantification of splice variants with almost identical or very similar sizes (e.g. Gαs+CAG and Gαs−CAG, which differ by just three nucleotides) is only possible with SYBR green when using exon boundary primers with the problem of unspecific binding (39). Nevertheless, real-time PCR was used here to confirm the results obtained with Pyrosequencing for the long and short ratio of Gαs independently of the CAG status as well as for comparison of the sensitivity of the two different methods.
The discussion about the function and properties of Gαs splice variants is still ongoing. Available data in the literature show that the steady-state mRNA and protein levels of the long and short variants of Gαs change drastically during ontogenetic development, aging, cellular differentiation, gestation, cold acclimation, and in pathophysiological states such as obesity, hypertension, diabetes, and alcoholism [see (23) for review]. This supports the idea that the expression of Gαs variants is regulated according to the actual functional requirement of a given cell or tissue.
Furthermore, there is evidence for altered GTP binding as well as receptor coupling of the different Gαs splice variants. Kuhn et al. (16) have shown a higher basal GTPγS binding to the long variant than to the short variant. However, upon isoproterenol stimulation, GTPγS binding was higher in cells expressing GαsS than in those expressing GαsL (16). Investigations in SF9 cells using fusion proteins of Gαs splice variants to β-adrenoreceptors have demonstrated that GαsL possesses a lower GDP affinity than GαsS (32).
Similarly, there is no consistent evidence about different regulation of effector activity. Changes in GαsL/GαsS ratios were found to be associated both with an increase (3,10,38) as well as a decrease (17,36) in adenylyl cyclase activity. Seifert et al. have shown that maximal adenylyl cyclase activity induced by the GαsL-coupled β2-adrenoreceptor is lower than the maximal adenylyl cyclase activity induced by the GαsS-coupled β2-adrenoreceptor (31,32).
Many studies examined the distribution of Gαs splice variants in various tissues. Ratios were calculated using different techniques on mRNA as well as on protein levels. Not surprisingly, there exist conflicting results concerning the distribution of Gαs variants and, especially for human cells and tissues, the data about the distribution of Gαs variants is limited. For example, investigations in different animals and humans have shown that GαsL is the predominant variant in kidney, placenta, adrenal medulla, cortex, and cerebellum (7,8,22), whereas GαsS is predominant in platelets, liver, neostriatum, and heart (4,14,22). In addition, the expression of GαsS and GαsL changes during erythroid differentiation (18), during multiple passages of HIT insulinoma cells (40), and in uterine smooth muscle during pregnancy (20). These findings could point at different roles of GαsS and GαsL in cell functions. The expression of Gαs splice variants also changes in pathological situations. Specifically, in preterm labor, only GαsS is expressed in the uterus, whereas in the normal pregnant uterus, both Gαs isoforms are present (6). It remains to be investigated whether the lack of GαsL expression in preterm labor is the basis for the poor therapeutic efficiency of partial β2-adrenoreceptor agonists as tocolytic drugs (20).
In this study we investigated the distribution of all four possible Gαs splice variants in human tissues and we showed that all four Gαs splice variants are expressed on the mRNA level. We could also show that GαsS is the predominant form in all investigated samples except for the brain. Although mRNA ratios do not necessarily exactly reflect protein ratios, the data presented here are consistent with a previous study which showed that GαsL predominates in brain and GαsS is the major form in heart, although these data were obtained from bovine tissue (22). Interestingly, the largest ratio variations were seen for GαsL−CAG and GαsS+CAG in different tissues, whereas the expression of GαsL+CAG and GαsS−CAG was rather constant (Table 1). These data, therefore, indicate that changes of long and short ratios of Gαs, which are extensively described in the literature, affect GαsL−CAG and GαsS+CAG more than GαsL+CAG and GαsS−CAG. Moreover, we showed that stimulation of EBV-immortalized lymphoblasts with isoproterenol results in significant changes in the mRNA expression especially of +/−CAG ratios of the long and short variants (Fig. 8). As a caveat, we could not determine whether these changes also translate into changes on the protein level. Moreover, we have not investigated whether these changes occur due to transcriptional regulation or due to differential mRNA degradation. Nevertheless, previous investigations only described functional differences between long and short Gαs splice variants without investigating the +/−CAG variants. Our results now point at an altered distribution of +/−CAG variants after stimulation with isoproterenol. Future studies should clarify whether these variants display different biological properties with regard to receptor and effector regulation. This will provide more insights into the biological impact of the hitherto poorly understood complex splicing behavior of the GNAS gene.
REFERENCES
- 1. Ahmadian A.; Gharizadeh B.; Gustafsson A. C.; Sterky F.; Nyren P.; Uhlen M.; Lundeberg J. Single-nucleotide polymorphism analysis by pyrosequencing. Anal. Biochem. 280(1):103–110; 2000. [DOI] [PubMed] [Google Scholar]
- 2. Bray P.; Carter A.; Simons C.; Guo V.; Puckett C.; Kamholz J.; Spiegel A.; Nirenberg M. Human cDNA clones for four species of G alpha s signal transduction protein. Proc. Natl. Acad. Sci. USA 83(23):8893–8897; 1986. [DOI] [PMC free article] [PubMed] [Google Scholar]
- 3. Chaudhry A.; Granneman J. G. Developmental changes in adenylyl cyclase and GTP binding proteins in brown fat. Am. J. Physiol. 261(2 Pt. 2):R403–R411; 1991. [DOI] [PubMed] [Google Scholar]
- 4. Cooper D. M.; Boyajian C. L.; Goldsmith P. K.; Unson C. G.; Spiegel A. Differential expression of low molecular weight form of Gs-alpha in neostriatum and cerebellum: Correlation with expression of calmodulin-independent adenylyl cyclase. Brain Res. 523(1):143–146; 1990. [DOI] [PubMed] [Google Scholar]
- 5. Dobrev D.; Wettwer E.; Himmel H. M.; Kortner A.; Kuhlisch E.; Schuler S.; Siffert W.; Ravens U. G-Protein beta(3)-subunit 825T allele is associated with enhanced human atrial inward rectifier potassium currents. Circulation 102(6):692–697; 2000. [DOI] [PubMed] [Google Scholar]
- 6. Europe-Finner G. N.; Phaneuf S.; Mardon H. J.; Lopez B. A. Human myometrial G alpha s-small (with serine) and Gs-large (with serine) messenger ribonucleic acid splice variants promote the increased expression of 46- and 54-kilodalton G alpha s protein isoforms in pregnancy and their down-regulation during labor. J. Clin. Endocrinol. Metab. 81(3):1069–1075; 1996. [DOI] [PubMed] [Google Scholar]
- 7. Evans T.; Brown M. L.; Fraser E. D.; Northup J. K. Purification of the major GTP-binding proteins from human placental membranes. J. Biol. Chem. 261(15):7052–7059; 1986. [PubMed] [Google Scholar]
- 8. Feinstein D. L.; Mumby S. M.; Milner R. J. Characterization of Gs alpha mRNA transcripts in primary cultures of rat brain astrocytes. Glia 5(2):139–145; 1992. [DOI] [PubMed] [Google Scholar]
- 9. Giulietti A.; Overbergh L.; Valckx D.; Decallonne B.; Bouillon R.; Mathieu C. An overview of real-time quantitative PCR: Applications to quantify cytokine gene expression. Methods 25(4):386–401; 2001. [DOI] [PubMed] [Google Scholar]
- 10. Granneman J. G.; Bannon M. J. Splicing pattern of Gs alpha mRNA in human and rat brain. J. Neurochem. 57(3):1019–1023; 1991. [DOI] [PubMed] [Google Scholar]
- 11. Gruber J. D.; Colligan P. B.; Wolford J. K. Estimation of single nucleotide polymorphism allele frequency in DNA pools by using Pyrosequencing. Hum. Genet. 110(5):395–401; 2002. [DOI] [PubMed] [Google Scholar]
- 12. Hauner H.; Rohrig K.; Siffert W. Effects of the G-protein beta3 subunit 825T allele on adipogenesis and lipolysis in cultured human preadipocytes and adipocytes. Horm. Metab. Res. 34(9):475–480; 2002. [DOI] [PubMed] [Google Scholar]
- 13. Hod Y. A simplified ribonuclease protection assay. Biotechniques 13(6):852–854; 1992. [PubMed] [Google Scholar]
- 14. Kawai Y.; Arinze I. J. Differential localization and development-dependent expression of G-protein sub-units, Go alpha and G beta, in rabbit heart. J. Mol. Cell. Cardiol. 28(7):1555–1564; 1996. [DOI] [PubMed] [Google Scholar]
- 15. Kozasa T.; Itoh H.; Tsukamoto T.; Kaziro Y. Isolation and characterization of the human Gs alpha gene. Proc. Natl. Acad. Sci. USA 85(7):2081–2085; 1988. [DOI] [PMC free article] [PubMed] [Google Scholar]
- 16. Kuhn B.; Christel C.; Wieland T.; Schultz G.; Gudermann T. G-protein betagamma-subunits contribute to the coupling specificity of the beta2-adrenergic receptor to G(s). Naunyn Schmiedebergs Arch. Pharmacol. 365(3):231–241; 2002. [DOI] [PubMed] [Google Scholar]
- 17. Kvapil P.; Novotny J.; Ransnas L. A. Prolonged exposure of hamsters to cold changes the levels of G proteins in brown adipose tissue plasma membranes. Life Sci. 57(4):311–318; 1995. [DOI] [PubMed] [Google Scholar]
- 18. Larner A. C.; Ross E. M. Alteration in the protein components of catecholamine-sensitive adenylate cyclase during maturation of rat reticulocytes. J. Biol. Chem. 256(18):9551–9557; 1981. [PubMed] [Google Scholar]
- 19. Livak K. J.; Schmittgen T. D. Analysis of relative gene expression data using real-time quantitative PCR and the 2(-Delta Delta C(T)) method. Methods 25(4):402–408; 2001. [DOI] [PubMed] [Google Scholar]
- 20. Lopez B. A.; Europe-Finner G. N.; Phaneuf S.; Watson S. P. Preterm labour: A pharmacological challenge. Trends Pharmacol. Sci. 16(4):129–133; 1995. [DOI] [PubMed] [Google Scholar]
- 21. Monteith M. S.; Wang T.; Brown M. J. Differences in transcription and translation of long and short Gs alpha, the stimulatory G-protein, in human atrium. Clin. Sci.(Lond.) 89(5):487–495; 1995. [DOI] [PubMed] [Google Scholar]
- 22. Mumby S. M.; Kahn R. A.; Manning D. R.; Gilman A. G. Antisera of designed specificity for subunits of guanine nucleotide-binding regulatory proteins. Proc. Natl. Acad. Sci. USA 83(2):265–269; 1986. [DOI] [PMC free article] [PubMed] [Google Scholar]
- 23. Novotny J.; Svoboda P. The long (Gs(alpha)-L) and short (Gs(alpha)-S) variants of the stimulatory guanine nucleotide-binding protein. Do they behave in an identical way? J. Mol. Endocrinol. 20(2):163–173; 1998. [DOI] [PubMed] [Google Scholar]
- 24. Pollard A. J.; Krainer A. R.; Robson S. C.; Europe-Finner G. N. Alternative splicing of the adenylyl cyclase stimulatory G-protein Galpha s is regulated by SF2/ASF and heterogeneous nuclear ribonucleoprotein A1 (hnRNPA1) and involves the use of an unusual TG 3′-splice site. J. Biol. Chem. 277(18):15241–15251; 2002. [DOI] [PubMed] [Google Scholar]
- 25. Pyne N. J.; Freissmuth M.; Palmer S. Phosphorylation of the spliced variant forms of the recombinant stimulatory guanine-nucleotide-binding regulatory protein (Gs alpha) by protein kinase C. Biochem. J. 285(Pt. 1):333–338; 1992. [DOI] [PMC free article] [PubMed] [Google Scholar]
- 26. Pyne N. J.; Freissmuth M.; Pyne S. Phosphorylation of the recombinant spliced variants of the alpha-sub-unit of the stimulatory guanine-nucleotide binding regulatory protein (Gs) by the catalytic sub-unit of protein kinase A. Biochem. Biophys. Res. Commun. 186(2):1081–1086; 1992. [DOI] [PubMed] [Google Scholar]
- 27. Robishaw J. D.; Smigel M. D.; Gilman A. G. Molecular basis for two forms of the G protein that stimulates adenylate cyclase. J. Biol. Chem. 261(21):9587–9590; 1986. [PubMed] [Google Scholar]
- 28. Ronaghi M.; Uhlen M.; Nyren P. A sequencing method based on real-time pyrophosphate. Science 281(5375):363, 365; 1998. [DOI] [PubMed] [Google Scholar]
- 29. Saccomanno C. F.; Bordonaro M.; Chen J. S.; Nordstrom J. L. A faster ribonuclease protection assay. Biotechniques 13(6):846–850; 1992. [PubMed] [Google Scholar]
- 30. Sambrook J.; Russel D. Molecular cloning: A laboratory manual. New York: Cold Spring Harbor Laboratory Press; 2000. [Google Scholar]
- 31. Seifert R. Monovalent anions differentially modulate coupling of the beta2-adrenoceptor to G(s)alpha splice variants. J. Pharmacol. Exp. Ther. 298(2):840–847; 2001. [PubMed] [Google Scholar]
- 32. Seifert R.; Wenzel-Seifert K.; Lee T. W.; Gether U.; Sanders-Bush E.; Kobilka B. K. Different effects of Gs alpha splice variants on beta2-adrenoreceptor-mediated signaling. The beta2-adrenoreceptor coupled to the long splice variant of Gs alpha has properties of a constitutively active receptor. J. Biol. Chem. 273(18):5109–5016; 1998. [PubMed] [Google Scholar]
- 33. Siffert W.; Rosskopf D.; Moritz A.; Wieland T.; Kaldenberg-Stasch S.; Kettler N.; Hartung K.; Beckmann S.; Jakobs K. H. Enhanced G protein activation in immortalized lymphoblasts from patients with essential hypertension. J. Clin. Invest. 96(2):759–766; 1995. [DOI] [PMC free article] [PubMed] [Google Scholar]
- 34. Smith C. W.; Valcarcel J. Alternative pre-mRNA splicing: The logic of combinatorial control. Trends Biochem. Sci. 25(8):381–388; 2000. [DOI] [PubMed] [Google Scholar]
- 35. Sternweis P. C.; Northup J. K.; Smigel M. D.; Gilman A. G. The regulatory component of adenylate cyclase. Purification and properties. J. Biol. Chem. 256(22):11517–11526; 1981. [PubMed] [Google Scholar]
- 36. Svoboda P.; Unelius L.; Cannon B.; Nedergaard J. Attenuation of Gs alpha coupling efficiency in brown-adipose-tissue plasma membranes from cold-acclimated hamsters. Biochem. J. 295(Pt. 3):655–661; 1993. [DOI] [PMC free article] [PubMed] [Google Scholar]
- 37. Unson C. G.; Wu C. R.; Sakmar T. P.; Merrifield R. B. Selective stabilization of the high affinity binding conformation of glucagon receptor by the long splice variant of Galpha(s). J. Biol. Chem. 275(28):21631–21638; 2000. [DOI] [PubMed] [Google Scholar]
- 38. Urasawa K.; Murakami T.; Yasuda H. Age-related alterations in adenylyl cyclase system of rat hearts. Jpn. Circ. J. 55(7):676–684; 1991. [DOI] [PubMed] [Google Scholar]
- 39. Vandenbroucke I. I.; Vandesompele J.; Paepe A. D.; Messiaen L. Quantification of splice variants using real-time PCR. Nucleic Acids Res. 29(13):E68; 2001. [DOI] [PMC free article] [PubMed] [Google Scholar]
- 40. Walseth T. F.; Zhang H. J.; Olson L. K.; Schroeder W. A.; Robertson R. P. Increase in Gs and cyclic AMP generation in HIT cells. Evidence that the 45-kDa alpha-subunit of Gs has greater functional activity than the 52-kDa alpha-subunit. J. Biol. Chem. 264(35):21106–21111; 1989. [PubMed] [Google Scholar]
- 41. Wasson J.; Skolnick G.; Love-Gregory L.; Permutt M. A. Assessing allele frequencies of single nucleotide polymorphisms in DNA pools by pyrosequencing technology. Biotechniques 32(5):1144–1146, 1148, 1150; 2002. [DOI] [PubMed] [Google Scholar]
- 42. Yagami T. Differential coupling of glucagon and beta-adrenergic receptors with the small and large forms of the stimulatory G protein. Mol. Pharmacol. 48(5):849–854; 1995. [PubMed] [Google Scholar]