

Abstract
The completion of a microarray experiment represents just a starting point toward understanding the biology of interest. A follow-up strategy is needed to fully elucidate the functional significance of microarray-derived measurements of differential expression. Given the fact that no single approach can fully unravel the fundamental biology that is typically quite complex, the follow-up strategy must be integrated at multiple levels encompassing bioinformatics, genomics, and proteomics. In this review, we discuss an integrative approach, which can be used to prioritize microarray-derived candidate genes, define their functions, and place them in the context of the biological system being studied.
Key words: Data analysis, Microarray, siRNA, QTL mapping, Genome database
THE first glance at the results of a microarray study can be very exciting. However, upon further reflection, confusion can set in because the differential expression of some genes is contradictory to existing knowledge, while other candidate genes have no obvious biological relevance or function. Consequently, many investigators subjectively choose a few genes for further experimentation, while the majority of data, which can contain a wealth of information, is bypassed for lack of a clear analytical strategy. This review was motivated by such a scenario and offers a step-by-step guide to help investigators follow up on their microarray data. We do not intend to supplant the fundamental approach of microarray data analysis for which an ever-growing toolbox is available. The interested reader is referred to several recent reviews (1,22,31).
SELECTION OF CANDIDATE GENES FOR INDEPENDENT CONFIRMATION
After completion of a microarray experiment and gene expression analysis, the first step is to confirm the differential expression using an alternative platform, such as real-time quantitative (q) PCR. The selection of which representative genes to independently confirm should be determined by the experimental aims. For the microarray experiments that are designed to test a specific hypothesis, it may be possible to simply confirm the genes that are felt to be biologically relevant. For the “fishing” type of microarray experiments, one may need to select a group of genes to confirm the experimental system as a whole. In the selection of such genes, one should consider both the signal intensity of individual measurements and the change between experimental groups. This is necessary because experimental noise is a function of signal intensity, with higher signal intensities having greater reliability (37). Selected genes should be representative of different signal intensities and fold changes (23). For example, one may select a group of genes with high signal intensities that are differentially expressed by ∼50% (1.5-fold change), a group with medium signal intensities differentially expressed by ∼100% (2.0-fold change), and a group with low signal intensities with that have on average a 3.5-fold change between experimental groups. By considering both signal intensity and differential expression when confirming data, one can get a general guideline as to how reliably data perform within specified ranges of signal intensities.
IDENTIFICATION OF SIGNIFICANT BIOLOGICAL THEMES CONTAINED IN THE DIFFERENTIALLY EXPRESSED GENE LIST
After independent confirmation of differential expression, the next step is to identify significant biological themes in which differentially expressed genes are contained. This analysis will provide groupings of genes based on function (rather than by expression pattern, such as revealed by cluster analysis when data are initially examined) and can permit a more focused analysis in the subsequent steps.
Investigators traditionally annotate differentially expressed genes using Internet-based databases or manual literature searches. In addition to being time consuming, such an approach cannot systematically identify the most significant biological themes with statistical backing. To overcome these problems, several software packages have been developed to uncover significant biological themes from microarray data, including EASE (18), MAPPFinder (11), GoMiner (38), and homogeneity analysis (10). Among these software programs, EASE is particularly user friendly and functionally versatile. It can automate the process of biological theme determination for lists of genes and also serve as a customizable gateway to online analysis tools. Such analyses also can provide a guide to objectively select a few genes, if necessary, from the most significant biological themes for follow-up studies. However, it should be emphasized that gene annotation has not been completed and using such an approach to eliminate genes that are differentially expressed should be made cautiously at this point.
INTEGRATING GENE EXPRESSION DATA FROM OTHER SOURCES
There is an increasing emphasis on the use of diverse sets of data that, while being derived from different platforms, species, tissues, time points, environment, etc., address a similar biological question (Fig. 1). This integration may identify: 1) common changes that are fundamental to the biology in question; 2) unique changes that are specific to the system of interest; 3) novel changes that are not identifiable with single microarray analysis, including small (such as 1.2- to 1.5-fold), but consistent changes that rely on the power of data pooled from multiple microarray experiments. This integration can start by searching relevant published material contained within the comprehensive NCBI Entrez site (http://www.ncbi.nlm.nih.gov/entrez) in conjunction with gene expression data browsing, query, and retrieval through the NCBI Gene Expression Omnibus (http://www.ncbi.nlm.nih.gov/geo), the EBI ArrayExpress (http://www.ebi.ac.uk/arrayexpress), and/or the Human and Mouse Gene Expression Database BODYMAP (http://bodymap.ims.u-tokyo.ac.jp).
Figure 1.
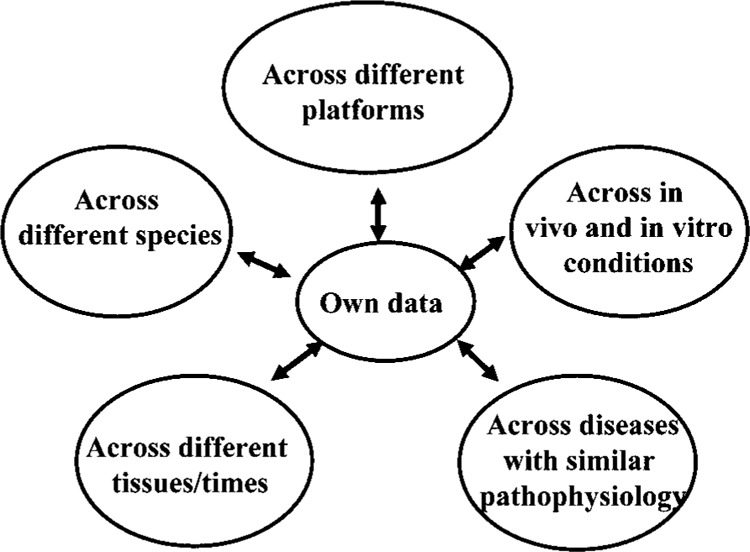
Integrating gene expression data from different sources.
The merits of considering one’s data in the context of other publicly available data have been demonstrated in several recent examples. By integrating gene expression data from cancer cell lines and human tumors, Lamb et al. (21) uncovered a cyclin-dependent kinase-independent mechanism of cyclin D1 function. In another experiment, tumor gene expression data combined from in vitro and in vivo experiments revealed differential gene expression patterns (9). Genes upregulated in lung adenocarcinoma and glioblastoma cell lines grown in vitro were associated with increased cell division and metabolism; in contrast, those upregulated in the same cells lines grown in vivo were predominantly involved in extracellular matrix formation, cell adhesion, and neovascularization. This indicates that gene expression patterns can be modulated by extrinsic factors and extrapolation of in vitro data to reveal what occurs in vivo must be made with caution.
It is important to point out that microarray data generated using different experimental procedures, platforms, and image processing parameters may show considerable variations (6,32). This poses a technical problem for integrating microarray data from different sources. To facilitate data integration while at the same time taking into account this confounding issue, the statistical method of meta-analysis has been developed to identify the intersection of multiple gene expression signatures from a diverse collection of microarray data set (28). Choi et al. (5) have recently reported a novel concept of combining effect size (a term given to a family of indices that measure the magnitude of treatment effect in a study) to obtain an overall estimate of the average effect size. The authors applied this method to liver cancer gene expression profiles from nine independent data sets that involved cDNA and oligonucleotide arrays on various platforms. By assimilating data from these various sources, the authors identified altered transcripts for growth hormone receptor, erythropoietin receptor, and tissue factor pathway inhibitor-2 that had not been reported in individual gene expression studies (6). In another study using a similar approach, Rhodes et al. (29) uncovered a common transcription profile that was universally activated in most cancer types relative to normal tissues.
INTEGRATING EXPRESSED SEQUENCE TAGS/TRANSCRIBED SEQUENCES INTO GENOME DATABASES
A microarray-derived candidate gene list can contain a substantial number of expressed sequence tags/transcribed sequences (to be referred to collectively as ESTs for simplicity); this is true even when the latest generation of arrays is used (e.g., Affymetrix Human Genome 133 Plus 2.0, Mouse Genome 430 2.0 and Rat Genome 230 2.0 oligonucleotide arrays). Unlike fully annotated genes, there can be little to no functional information for these ESTs. However, the availability of new sequence data and analytical tools derived from the various genome databases has opened new opportunities to explore the potential identity and/or function of ESTs in the following sequential manner. First, ESTs can be BLAST searched against all entries in the last available release of the nonredundant database containing GenBank, EMBL, DDBJ, and PDB sequences using the blastn program accessed through NCBI’s BLAST services on the Internet (http://www.ncbi.nlm.nih.gov/blast/Blast.cgi). Identification of high homology with a known gene may shed light onto the potential function of the EST. Secondly, ESTs can be mapped by their accession number onto a specific chromosomal position using the NCBI or Ensembl (http://www.ensembl.org/) genome databases (3,20). As example, consider the mouse EST identified by its accession number, BM200602. By inputting this number into Ensembl and searching “all species for EST with this accession number,” there is one match in the mouse EST index. By clicking on Contigview, this EST is then localized to chromosome 3 between 90409457 and 90449921 bps, flanked by microsatellite markers D3Mit341 and D3Mit232. The use of the NCBI syntenic map can find sequence homology between genomes. The presence of a syntenically confirmed homologue in another genome indicates that these might be orthologous genes. Finally, other structural and functional information can be predicted using the Ensembl database, including the full-length genomic and cDNA sequences, structural and functional domains of the gene, and its protein family. By integrating all this available information through genome databases, traditional ESTs can be functionally characterized. Another useful resource is Affymetrix NetAffx (https://www.affymetrix.com/analysis/netaffx/index.affx), which can be used to accomplish many of the functions described above when examining Affymetrix probe sets based upon ESTs.
An example of genome database-mediated characterization of differentially expressed ESTs is illustrated in a study of the human ciliary body (12). The authors used NCBI BLAST search and sequence mapping techniques to successfully classify 284 differentially expressed ESTs into 17 functional groups. By analyzing their relationships, they were able to define the expression of five major groups of known genes, from which novel physiological functions of the ciliary body in normal and in disease states were uncovered, as well as the identification of novel candidate genes in ocular diseases. More recently, Vitt et al. (33) successfully used EST alignments, synteny, gene expression, and verification of Ensembl genes to identify candidate disease genes on rat chromosome 1q43-54.
INTEGRATING GENE EXPRESSION DATA WITH QUANTITATIVE TRAIT LOCI INFORMATION
Quantitative trait loci (QTL) mapping is a genetic technique to identify chromosomal regions that harbor the gene(s) regulating the trait of interest. Up until now, finding candidate genes from QTL regions has been difficult because of the rather large genomic regions that define a QTL, which harbored genes of unknown number (ranging from tens to hundreds) and composition. As genome projects have become complete, QTL data have become increasingly informative. Now, the genes/ESTs within a given QTL can be retrieved simply by knowing the flanking markers or starting and ending base pair positions of that QTL using the tool EnsMart (http://www.ensembl.org/Multi/martview). EnsMart is a batch data/sequence retrieval tool that allows users to generate lists of biological objects (e.g., genes, SNPs) by specifying genomic regions from data held in the Ensembl database. If one is working with rat QTLs, genes can be directly exported by clicking “Limit to QTL region” box and selecting the QTL name from the EnsMart site. Subsequently, overlapping genes between those differentially expressed genes in a microarray experiment and those residing in the QTL(s) accounting for the trait in question can be identified (Fig. 2). Those genes contained within the QTL that are differentially expressed represent genes highly relevant for further study. It is important to note that such analyses require knowledge of QTLs derived from existing research. However, several QTL databases are available for retrieving relevant QTL information, including human, mouse, and rat QTL resources (http://qtl.pzr.uni-rostock.de/) and the Gramene QTL Database for plants (http://www.gramene.org/qtl/). The Expressionview software tool (http://ensembl.pzr.uni-rostock.de/*/expressionview, where * is Homo_sapiens, Mus_musculus or Rattus_norvegius for human, mouse, and rat data, respectively) has been developed for combined visualization of gene expression and QTL data (13). This software displays these data globally on the karyotype, assisting the researcher with an overview of the distribution of the differentially expressed genes and their particular occurrence within QTLs associated with the desired trait.
Figure 2.
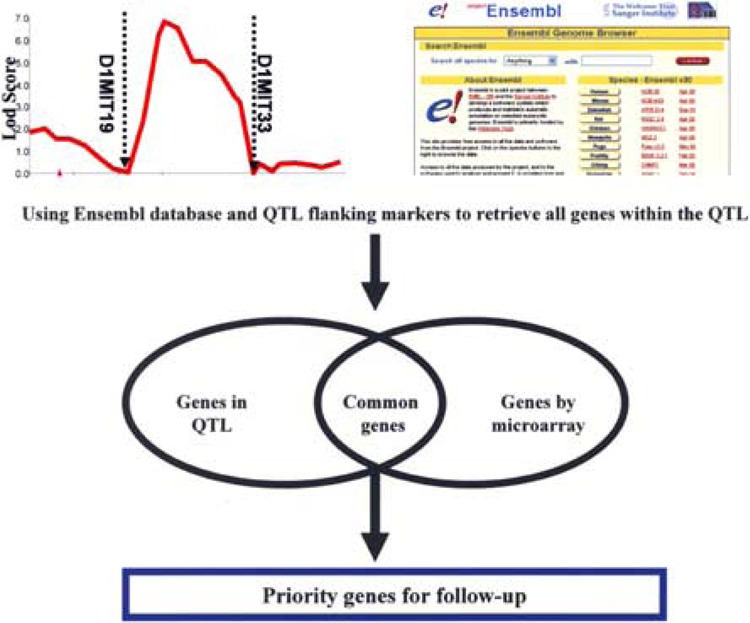
Integrating QTL data with gene expression data. Using the flanking markers of the QTL, all genes localized in the QTL can be retrieved through the Ensembl database. Genes in common between those identified as differentially expressed in a microarray experiment and those within the QTL region can be identified. These are the most likely to be relevant to the biological system in study.
The application of this integration has been attempted in a Marek’s disease resistance model (8,24) and has also recently been illustrated in an alcohol preference experiment in rat (34). In the latter study, the authors chose an alcohol preference QTL from the literature, with a lod score of 9.2 and a peak marker D4Rat34. Forty-two genes/transcribed sequences are localized within this QTL region. Several transcripts are relatively enriched in the nucleus accumbens, the region in the brain that is felt to control ethanol preference. One of those near D4Rat34 is corticotropin releasing factor (CRF) receptor 2. Previous studies have shown that CRF plays a role in ethanol intake; rats preferring ethanol had differing responses to CRF than those that did not prefer ethanol. Taken together, these data suggested that CRF receptor 2 is a strong candidate gene for ethanol preference, thereby demonstrating the value of combining gene expression data and QTL information.
INTEGRATING GENE EXPRESSION DATA WITH OTHER GENOMIC AND PROTEOMIC DATA
In and of themselves, changes in gene expression are not wholly sufficient to understand gene function (15). To fully understand the cause and functional significance of the observed change, genomic and proteomic datasets should be integrated.
Most chromosomal alterations, including chromosomal gains, losses, deletions, or insertions, ultimately affect gene expression. Thus, combining microarray and genomic data can facilitate the identification of the candidate genes within the region and also reveal when the alterations affect phenotype. The benefits of this integration has been stressed in a recent review (14) and illustrated in several studies (19,36). Pollack et al. (26) performed parallel microarray profiling and genome-wide comparative genomic hybridization (CGH) analysis in a series of primary human breast tumors and revealed that DNA copy number influenced gene expression across a wide range of DNA copy number alterations (deletion, low-, mid-, and high-level amplification); on average, a 2.0-fold change in DNA copy number was associated with a corresponding 1.5-fold change in mRNA levels. The SKY/M-FISH and CGH is a comprehensive database from NCBI (http://www.ncbi.nlm.nih.gov/sky/skyweb.cgi) for chromosomal aberrations and DNA copy number changes in tumor genomes, which is an excellent resource to place gene expression data in such a context.
The rationale for integrating proteomic data is based on several facts. 1) Alteration of transcript quantities is not always linked to alteration of protein quantities in a linear fashion; at best, only half of those transcriptionally changed genes will have their proteins altered in the same direction (30). In general, the correlation is good between structural proteins and their corresponding RNAs, but not as good between nonstructural proteins and their RNAs (25). 2) Numerous protein activity alterations are not reflected by changes of their RNA levels, such as post-translational modifications and the mutations that do not affect RNA expression but change protein expression/function (16). 3) Translational control is an important cellular process that is regulated by a specific group of genes (17). For example, the differential expression of polypeptide chain initiation factor eIF2 could change the rate of translation of many mRNAs into proteins, which may be important in the regulation of cell growth or death (7). Given the distinct regulation of RNA and protein levels, integrating data of the transcriptome and proteome will provide more complete pictures of gene function. A successful example of such integration was a study of lung tumors in which mRNA and protein profiles of tumors were obtained from 86 newly diagnosed patients, including 67 with early stage and 19 with advanced stage lung adenocarcinoma. The combined analyses of protein and mRNA data revealed that 11 components of the glycolysis pathway were associated with poor survival. Among these candidates, overexpression of both phosphoglycerate kinase 1 mRNA and protein was associated with reduced patient survival; this finding was confirmed by independent immunohistochemical studies with tissue microarrays (2,4). Thus, this example demonstrates the value of integrating data of both RNA and protein expression; in this particular case, its utility was in the identification of more reliable biomarkers to predict the outcome of patients with early stage lung cancer.
INTEGRATING RNAi TECHNOLOGY FOR HIGH-THROUGHPUT FUNCTIONAL VALIDATION
After integrating other transcriptomic, genomic, and proteomic data, the number of candidate genes has been substantially reduced and a priority has been assigned to the remaining genes. The next step is to functionally characterize this latter group of genes such as through the use of RNA interference (RNAi). RNAi is a contemporary approach to silence specific genes by way of posttranscriptional gene targeting. Despite its being a relatively new approach, RNAi already has been widely used for studying gene function as well as for identifying and validating new drug targets. Following-up microarray studies with RNAi experiments can be ideal to perform large-scale functional screening.
The power of such an approach has been demonstrated in the identification and validation of genes involved in the pathogenesis of colorectal cancer (35). In this study, cDNA microarray analysis identified 574 upregulated genes in colon tumors compared to normal tissue. After qRT-PCR confirmation, RNAi was used to disrupt expression of a selected number of these genes in a colon tumor cell line, HCT116, which had comparable gene expression patterns to many of the patient tumors. Disruption of the expression of one of these genes, surviving, which is a potent inhibitor of apoptosis, significantly reduced tumor growth both in in vitro and in vivo models.
The combination of microarray and RNAi technologies can also facilitate the dissection of causative relationships among upregulated genes, often referred as a systems biology approach. This application has been illustrated in a mesothelioma study (27). Affymetrix oligonucleotide microarray analyses of crocidolite asbestos-exposed rat pleural mesothelial (RPM) cells, as well as human mesotheliomas, identified the early response proto-oncogene, fra-1, as highly upregulated in both instances. In subsequent experiments, silencing of fra-1 translation reduced cd44 and c-met expression, thereby connecting fra-1 with genes governing cell motility and invasion in mesothelioma and supporting the blockade of fra-1 signaling pathways as therapy for malignant mesothelioma.
IN VIVO CONFIRMATION
For the most part, microarray studies are designed to uncover transcriptional events occurring in a particular organism even if performed in in vitro or ex vivo settings. As such, to definitely assign function to a candidate gene, in vivo confirmation is a final step. Depending on the nature of the experiments, gene knock-out-mediated loss-of-function, gene knock-in-mediated gain-of-function, virus-mediated gene delivery, or topical application approaches can be applied. These approaches are traditional and many examples of successful applications are available in the literature.
SUMMARY
No single approach that originates from a microarray experiment can reveal all there is to know about the function of a given set of genes. Here we have presented an eight-step strategy to prioritize microarray-derived candidate genes and functionally evaluate these in vitro and in vivo. Such a strategy can be performed in parallel and experimentally validated (Fig. 3). It starts with independent confirmation of microarray results, emphasizes bioinformatic, genomic, and proteomic data integration, and finishes with functional validation.
Figure 3.
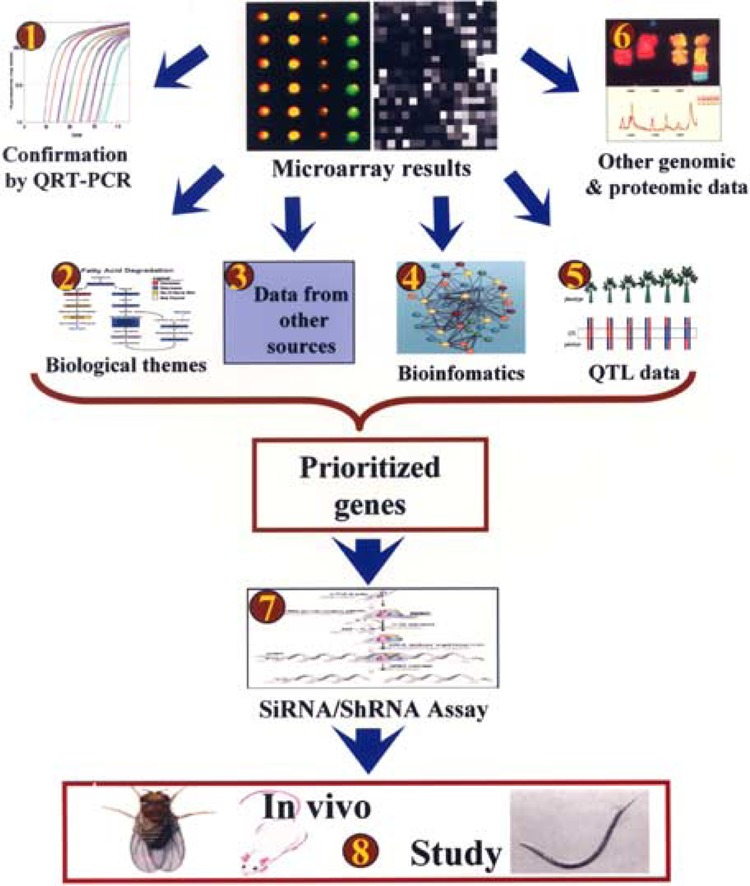
Outline of the eight-step integrated strategy to follow-up on data from a microarray study.
REFERENCES
- 1. Aittokallio T.; Kurki M.; Nevalainen O.; Nikula T.; West A.; Lahesmaa R. Computational strategies for analyzing data in gene expression microarray experiments. J. Bioinform. Comput. Biol. 1:541–586; 2003. [DOI] [PubMed] [Google Scholar]
- 2. Beer D. G.; Kardia S. L.; Huang C. C.; Giordano T. J.; Levin A. M.; Misek D. E.; Lin L.; Chen G.; Gharib T. G.; Thomas D. G.; Lizyness M. L.; Kuick R.; Hayasaka S.; Taylor J. M.; Iannettoni M. D.; Orringer M. B.; Hanash S. Gene-expression profiles predict survival of patients with lung adenocarcinoma. Nat. Med. 8:816–824; 2002. [DOI] [PubMed] [Google Scholar]
- 3. Birney E. Ensembl: A genome infrastructure. Cold Spring Harb. Symp. Quant. Biol. 68:213–215; 2002. [DOI] [PubMed] [Google Scholar]
- 4. Chen G.; Gharib T. G.; Wang H.; Huang C. C.; Kuick R.; Thomas D. G.; Shedden K. A.; Misek D. E.; Taylor J. M.; Giordano T. J.; Kardia S. L.; Iannettoni M. D.; Yee J.; Hogg P. J.; Orringer M. B.; Hanash S. M.; Beer D. G. Protein profiles associated with survival in lung adenocarcinoma. Proc. Natl. Acad. Sci. USA 100:13537–13542; 2003. [DOI] [PMC free article] [PubMed] [Google Scholar]
- 5. Choi J. K.; Yu U.; Kim S.; Yoo O. J. Combining multiple microarray studies and modeling interstudy variation. Bioinformatics 19(Suppl. 1):i84–90; 2003. [DOI] [PubMed] [Google Scholar]
- 6. Choi J. K.; Choi J. Y.; Kim D. G.; Choi D. W.; Kim B. Y.; Lee K. H.; Yeom Y. I.; Yoo H. S.; Yoo O. J.; Kim S. Integrative analysis of multiple gene expression profiles applied to liver cancer study. FEBS Lett. 565:93–100; 2004. [DOI] [PubMed] [Google Scholar]
- 7. Clemens M. J. Targets and mechanisms for the regulation of translation in malignant transformation. Oncogene 23:3180–3188; 2004. [DOI] [PubMed] [Google Scholar]
- 8. Cox L. A.; Birnbaum S.; VandeBerg J. L. Identification of candidate genes regulating HDL cholesterol using a chromosomal region expression array. Genome Res. 12:1693–702; 2002. [DOI] [PMC free article] [PubMed] [Google Scholar]
- 9. Creighton C.; Kuick R.; Misek D. E.; Rickman D. S.; Brichory F. M.; Rouillard J. M.; Omenn G. S.; Hanash S. Profiling of pathway-specific changes in gene expression following growth of human cancer cell lines transplanted into mice. Genome Biol. 4:R46; 2003. [DOI] [PMC free article] [PubMed] [Google Scholar]
- 10. Cui Y.; Zhou M.; Wong W. H. Integrated analysis of microarray data and gene function information. OMICS 8:106–117; 2004. [DOI] [PubMed] [Google Scholar]
- 11. Doniger S. W.; Salomonis N.; Dahlquist K. D.; Vranizan K.; Lawlor S. C.; Conklin B. R. MAPP Finder: Using Gene Ontology and Gen-MAPP to create a global gene-expression profile from microarray data. Genome Biol. 4:R7; 2003. [DOI] [PMC free article] [PubMed] [Google Scholar]
- 12. Escribano J.; Coca-Prados M. Bioinformatics and re-analysis of subtracted expressed sequence tags from the human ciliary body: Identification of novel biological functions. Mol. Vis. 8:315–332; 2002. [PubMed] [Google Scholar]
- 13. Fischer G.; Ibrahim S. M.; Brockmann G. A.; Pahnke J.; Bartocci E.; Thiesen H. J.; Serrano-Fernandez P.; Moller S. Expressionview: Visualization of quantitative trait loci and gene-expression data in Ensembl. Genome Biol. 4:R77; 2003. [DOI] [PMC free article] [PubMed] [Google Scholar]
- 14. Garnis C.; Buys T. P.; Lam W. L. Genetic alteration and gene expression modulation during cancer progression. Mol. Cancer 3:9–32; 2004. [DOI] [PMC free article] [PubMed] [Google Scholar]
- 15. Ge H.; Walhout A. J.; Vidal M. Integrating ‘omic’ information: A bridge between genomics and systems biology. Trends Genet. 19:551–560; 2003. [DOI] [PubMed] [Google Scholar]
- 16. Hanash S. Disease proteomics. Nature 422:226–232; 2003. [DOI] [PubMed] [Google Scholar]
- 17. Hanash S. Integrated global profiling of cancer. Nat. Rev. Cancer 4:638–644; 2004. [DOI] [PubMed] [Google Scholar]
- 18. Hosack D. A.; Dennis G. Jr.; Sherman B. T.; Lane H. C.; Lempicki R. A. Identifying biological themes within lists of genes with EASE. Genome Biol. 4:R70; 2003. [DOI] [PMC free article] [PubMed] [Google Scholar]
- 19. Hyman E.; Kauraniemi P.; Hautaniemi S.; Wolf M.; Mousses S.; Rozenblum E.; Ringner M.; Sauter G.; Monni O.; Elkahloun A.; Kallioniemi O. P.; Kallioniemi A. Impact of DNA amplification on gene expression patterns in breast cancer. Cancer Res. 62:6240–6245; 2002. [PubMed] [Google Scholar]
- 20. Kasprzyk A.; Keefe D.; Smedley D.; London D.; Spooner W.; Melsopp C.; Hammond M.; Rocca-Serra P.; Cox T.; Birney E. EnsMart: A generic system for fast and flexible access to biological data. Genome Res. 14:160–169; 2004. [DOI] [PMC free article] [PubMed] [Google Scholar]
- 21. Lamb J.; Ramaswamy S.; Ford H. L.; Contreras B.; Martinez R. V.; Kittrell F. S.; Zahnow C. A.; Patterson N.; Golub T. R.; Ewen M. E. A mechanism of cyclin D1 action encoded in the patterns of gene expression in human cancer. Cell 114:323–334; 2003. [DOI] [PubMed] [Google Scholar]
- 22. Leach M. Gene expression informatics. Methods Mol. Biol. 258:153–165; 2004. [DOI] [PubMed] [Google Scholar]
- 23. Li X.; Kim J.; Zhou J.; Gu W.; Quigg R. J. Use of signal-dependent thresholds to determine significant changes in microarray data analyses. Genet. Mol. Biol. (in press). [Google Scholar]
- 24. Liu H. C.; Cheng H. H.; Tirunagaru V.; Sofer L.; Burnside J. A strategy to identify positional candidate genes conferring Marek’s disease resistance by integrating DNA microarrays and genetic mapping. Anim. Genet. 32:351–359; 2001. [DOI] [PubMed] [Google Scholar]
- 25. Nishizuka S.; Charboneau L.; Young L.; Major S.; Reinhold W. C.; Waltham M.; Kouros-Mehr H.; Bussey K. J.; Lee J. K.; Espina V.; Munson P. J.; Petricoin E. 3rd.; Liotta L. A.; Weinstein J. N. Proteomic profiling of the NCI-60 cancer cell lines using new high-density reverse-phase lysate microarrays. Proc. Natl. Acad. Sci. USA 100:14229–14234; 2003. [DOI] [PMC free article] [PubMed] [Google Scholar]
- 26. Pollack J. R.; Sorlie T.; Perou C. M.; Rees C. A.; Jeffrey S. S.; Lonning P. E.; Tibshirani R.; Botstein D.; Borresen-Dale A. L.; Brown P. O. Microarray analysis reveals a major direct role of DNA copy number alteration in the transcriptional program of human breast tumors. Proc. Natl. Acad. Sci. USA 99:12963–12968; 2002. [DOI] [PMC free article] [PubMed] [Google Scholar]
- 27. Ramos-Nino M. E.; Scapoli L.; Martinelli M.; Land S.; Mossman B. T. Microarray analysis and RNA silencing link fra-1 to cd44 and c-met expression in mesothelioma. Cancer Res. 63:3539–3545; 2003. [PubMed] [Google Scholar]
- 28. Rhodes D. R.; Barrette T. R.; Rubin M. A.; Ghosh D.; Chinnaiyan A. M. Meta-analysis of microarrays: Interstudy validation of gene expression profiles reveals pathway dysregulation in prostate cancer. Cancer Res. 62:4427–4433; 2002. [PubMed] [Google Scholar]
- 29. Rhodes D. R.; Yu J.; Shanker K.; Deshpande N.; Varambally R.; Ghosh D.; Barrette T.; Pandey A.; Chinnaiyan A. M. Large-scale meta-analysis of cancer microarray data identifies common transcriptional profiles of neoplastic transformation and progression. Proc. Natl. Acad. Sci. USA 101:9309–9314; 2004. [DOI] [PMC free article] [PubMed] [Google Scholar]
- 30. Shoemaker D. D.; Linsley P. S. Recent developments in DNA microarrays. Curr. Opin. Microbiol. 5:334–337; 2002. [DOI] [PubMed] [Google Scholar]
- 31. Slonim D. K. From patterns to pathways: gene expression data analysis comes of age. Nat. Genet. 32(Suppl.):502–508; 2002. [DOI] [PubMed] [Google Scholar]
- 32. Tan P. K.; Downey T. J.; Spitznagel E. L. Jr.; Xu P.; Fu D.; Dimitrov D. S.; Lempicki R. A.; Raaka B. M.; Cam M. C. Evaluation of gene expression measurements from commercial microarray platforms. Nucleic Acids Res. 31:5676–5684; 2003. [DOI] [PMC free article] [PubMed] [Google Scholar]
- 33. Vitt U.; Gietzen D.; Stevens K.; Wingrove J.; Becha S.; Bulloch S.; Burrill J.; Chawla N.; Chien J.; Crawford M.; Ison C.; Kearney L.; Kwong M.; Park J.; Policky J.; Weiler M.; White R.; Xu Y.; Daniels S.; Jacob H.; Jensen-Seaman M. I.; Lazar J.; Stuve L.; Schmidt J. Identification of candidate disease genes by EST alignments, synteny, and expression and verification of Ensembl genes on rat chromosome 1q43-54. Genome Res. 14:640–650; 2004. [DOI] [PMC free article] [PubMed] [Google Scholar]
- 34. Walker J. R.; Su A. I.; Self D. W.; Hogenesch J. B.; Lapp H.; Maier R.; Hoyer D.; Bilbe G. Applications of a rat multiple tissue gene expression data set. Genome Res. 14:742–749; 2004. [DOI] [PMC free article] [PubMed] [Google Scholar]
- 35. Williams N. S.; Gaynor R. B.; Scoggin S.; Verma U.; Gokaslan T.; Simmang C.; Fleming J.; Tavana D.; Frenkel E.; Becerra C. Identification and validation of genes involved in the pathogenesis of colorectal cancer using cDNA microarrays and RNA interference. Clin. Cancer Res. 9:931–946; 2003. [PubMed] [Google Scholar]
- 36. Wolf M.; Mousses S.; Hautaniemi S.; Karhu R.; Huusko P.; Allinen M.; Elkahloun A.; Monni O.; Chen Y.; Kallioniemi A.; Kallioniemi O. P. High-resolution analysis of gene copy number alterations in human prostate cancer using CGH on cDNA microarrays: impact of copy number on gene expression. Neoplasia 6:240–247; 2004. [DOI] [PMC free article] [PubMed] [Google Scholar]
- 37. Yang I. V.; Chen E.; Hasseman J. P.; Liang W.; Frank B. C.; Wang S.; Sharov V.; Saeed A. I.; White J.; Li J.; Lee N. H.; Yeatman T. J.; Quackenbush J. Within the fold: Assessing differential expression measures and reproducibility in microarray assays. Genome Biol. 3:research0062; 2003. [DOI] [PMC free article] [PubMed] [Google Scholar]
- 38. Zeeberg B. R.; Feng W.; Wang G.; Wang M. D.; Fojo A. T.; Sunshine M.; Narasimhan S.; Kane D. W.; Reinhold W. C.; Lababidi S.; Bussey K. J.; Riss J.; Barrett J. C.; Weinstein J. N. GoMiner: A resource for biological interpretation of genomic and proteomic data. Genome Biol. 4:R28; 2003. [DOI] [PMC free article] [PubMed] [Google Scholar]