

Abstract
Introduction
As trend studies have shown, health inequalities by income and occupation have widened or remained stable. However, research on time trends in educational inequalities in health in Germany is scarce. The aim of this study is to analyse how educational inequalities in health evolved over a period of 21 years in the middle-aged population in Germany, and whether the trends differ by gender.
Methods
Data were obtained from the German Socio-Economic Panel covering the period from 1994 to 2014. In total, n=16 339 participants (106 221 person years) aged 30–49 years were included in the study sample. Educational level was measured based on the ‘Comparative Analysis of Social Mobility in Industrial Nations’ (CASMIN) classification. Health outcomes were self-rated health (SRH) as well as (mental and physical) health-related quality of life (HRQOL, SF-12v2). Absolute Index of Inequality (Slope Index of Inequality (SII)) and Relative Index of Inequality (RII) were calculated using linear and logarithmic regression analyses with robust SEs.
Results
Significant educational inequalities in SRH and physical HRQOL were found for almost every survey year from 1994 to 2014. Relative inequalities in SRH ranged from 1.50 to 2.10 in men and 1.25 to 1.87 in women (RII). Regarding physical HRQOL, the lowest educational group yielded 4.5 to 6.6 points (men) and 3.3 to 6.1 points (women) lower scores (SII). Although educational level increased over time, absolute and relative health inequalities remained largely stable over the last 21 years. For mental HRQOL, only few educational inequalities were found.
Discussion
This study found persistent educational inequalities in SRH and physical HRQOL among adults in Germany from 1994 to 2014. Our findings highlight the need to intensify efforts in social and health policies to tackle these persistent inequalities.
Keywords: health inequalities, socioeconomic status, self-rated health, SF 12, SOEP
Strengths and limitations of this study.
This is among the first study examining trends in educational inequalities in SRH and mental and physical health-related quality of life in Germany.
We used a large sample size representing the German population and offering the opportunity for a trend analysis covering 21 years (1994–2014) regarding different measures of health.
No clear trend is evident in our results which might be explained by outlier values in some years.
Introduction
The existence of socioeconomic inequalities in health in Europe is well established1 2 for a variety of health indicators, such as premature mortality,3 4 morbidity2 and self-rated health (SRH).5–7 Most studies have revealed that these inequalities are stable or have increased over the last few decades.2 5 8–13 This applies for adults’ and adolescents’ health.14 15 However, the extent of inequalities depends eg, on gender, health measures, indicators of socioeconomic status as well as on relative or absolute measures of inequalities. For example, educational inequalities in SRH increased in Swedish women between 2000 and 2008, but remained stable in Swedish men.5 Another study showed that in many European countries relative inequalities in mortality increased, while absolute inequalities in mortality decreased.3 Furthermore, Dalstra et al,16 analysing trends from the 1980s to the 1990s in the Netherlands, found that inequalities in SRH were more pronounced for income than for educational level. Additionally, different results were observed for different health outcomes. While social inequalities in SRH increased over time, other outcomes (eg, short-term and long-term health problems and chronic diseases) remained stable.
In the last few decades, several large societal changes have occurred in Germany. After the reunification of West and East Germany in 1990, the government faced slow economic growth, rising unemployment and debt.17 18 Current research shows that income inequality increased in Germany from 1994 to 2013.19 Until now, only a few studies have analysed trends in health inequalities in Germany, reporting stable20 or increasing inequalities.18 21 For example, inequalities in SRH by employment status increased between 1994 and 2008 in women in general and in men aged 30–59 years.18 Another study revealed that income-related inequalities in SRH roughly doubled from 1994 to 2011.21
The majority of studies on this topic have focused on occupational or income-related inequalities in SRH in Germany. Less attention has been paid to educational inequalities. However, educational level is strongly related to social background22 and can be considered as the foundation determining the opportunities for occupational status and income level and therefore also for standard of living and quality of life.23 Since the 1950s, there has been an increasing participation in higher education which has resulted in an educational expansion in Germany. While the lowest educational track (lower secondary school) is now less pronounced, the participation in the highest educational track rose during that time.24 A declining share of low educated people in a population has been suggested to increase negative selection into this group which may contribute to widening educational inequalities in health.25–27 Besides the general increase in the number of higher educational degrees, a gender-specific development was also visible. While men showed higher educational attainment for a long period of time, women started catching up with them beginning in the late 1950s, with degrees of education being almost equal now. Therefore, gender needs to be taken into account when studying trends in education.24
A higher educational level is often associated with better health and health behaviour. However, the link between education and health is complex. Studies have found that different mechanisms mediate this relationship. Education is associated with different material, psychosocial and behavioural factors which in turn affect SRH.23 28 29 Well-educated people have more advantages regarding these factors, for example, a healthier lifestyle which results in better health (mediation). However, moderating effects were also found, implying that the effects of lifestyle factors on health are at least partially dependent on educational level.30 In addition, cognitive ability was found to be important for educational attainment and to enhance personal care of one’s own health and well-being, for example, regarding a better understanding of educations messages and prevention. Education also increases a person’s sense of control over his/her life, including better analytical and communication skills. A lack of personal control can be perceived as a stressor with negative physiological consequences.22 31
Analysing trends in health inequalities is essential for investigations into whether differences in health have changed and whether policy strategies have been successful in tackling inequalities affecting health.12 13 To date, existing trend analyses have either focused on adolescents14 15 or have taken a wide age range into account.17 21 The present study pays special attention to the middle-aged group of men and women (aged 30–49 years). This age group represents a highly important life period where work (eg, consolidation in the labour market) and private responsibilities (eg, having children) are very demanding. However, only limited information is available for this specific age group. The aim of this study is therefore (1) to analyse whether educational inequalities exist in three measures of subjective health (SRH, mental and physical health-related quality of life (HRQOL)) among early middle-aged adults in Germany between 1994 and 2014, (2) whether they have changed over 21 years and (3) whether the observed trends are consistent for both genders regarding SRH and HRQOL. We hypothesise (a) that educational inequalities will be found in all three health outcomes, (b) that these health inequalities either widened or remained stable and (c) that trends of educational inequalities in health will differ by gender.
Methods
The paper follows the Strengthening the Reporting of Observational Studies in Epidemiology guidelines for reporting observational studies.32
Data
The German Socio-Economic Panel (GSOEP) is the largest and longest-running household panel in Germany, having been established in 1984. The GSOEP surveys about 20 000 individuals yearly from more than 10 000 households and represents the residential population of Germany. Each participating household member aged 18 years and older is invited to fill out a personal questionnaire every year that includes a wide range of socioeconomic questions relevant to health. The longitudinal design and annual follow-up of the GSOEP survey offer the possibility to analyse social trends and dynamics.33 Detailed information about the GSOEP can be found elsewhere.34
The analyses were based on 21 waves of the study covering the years 1994 through 2014. A weighting variable was used to facilitate the comparability over time with respect to age, gender, state of residence and refreshments of the survey participants over time.18 For our analyses, we focused on the age group between 30 and 49 years (npaticipants=16 339), because most people complete their educational training in the middle of their 20s, and it can be assumed that their occupational status stabilises by the age of 30. To avoid bias from the educational effects of including two generations (cohort effect), we limited our age group to 30–49. Cases with missing values on the outcome (203 observations) and/or educational level (27 355 observations) as well as the further independent variables (2484 observations) at annual level were excluded. In total, our analyses on SRH are based on the data from 16 339 individuals and 106 221 observations of these individuals, respectively, resulting from repeated participation over the whole time period. As physical and mental HRQOL was surveyed only between 2002 and 2014, and only every 2 years, fewer participants (nparticipants=13 099/nobservations=39 541) were included than for SRH. For the purposes of this study, ‘participants’ refers to individuals and ‘observations’ refers to the number of person years we used.
Patient and public involvement
No patients were involved in setting the research question or the outcome measures, nor were they involved in developing plans for design or implementation of the study. No patients were asked to advise on interpretation or writing up of results. There are no plans to disseminate the results of the research to study participants or the relevant patient community.
Measures
Educational level
Educational level was based on the ‘Comparative Analysis of Social Mobility in Industrial Nations’ (CASMIN) educational classification system and was recoded into ‘low’, ‘medium’ and ‘high’ educational levels.20 35 The CASMIN classification distinguishes between hierarchically structured educational qualifications and provides international comparability. The high education group is defined as all persons with low or high tertiary degrees, the medium education group consists of those with a vocational degree (intermediate general qualification, intermediate vocational, general maturity certificate, vocational maturity certificate) and the lowest education group includes all respondents with inadequately completed general education, general elementary education or basic vocational qualification.
Self-rated health
SRH was assessed using the question ‘How would you describe your current health?’ The response options were ‘very good’, ‘good’, ‘satisfactory’, ‘poor’ and ‘bad’ and were dichotomised as ‘rather good’ (first two categories) and ‘rather poor’ (last three categories).36 SRH has been shown to be a robust indicator for different health outcomes and a reliable predictor for mortality.37–39 Data on SRH have been collected annually in the GSOEP since 1994.
HRQOL (SF-12v2) in mental and physical health
The Short Form 12 Health Survey (SF-12) was developed to measure health status based on 12 health-related questions. It is a subset of the SF-36v2 and is considered a reliable measure of overall health status covering two superordinate dimensions of physical and mental health.40 Both scales have been included in the GSOEP since 2002, and related data were collected every 2 years until 2014. The Mental Component Summary Scale (MCS) measures episodes of emotional problems, melancholy and social limitations due to mental health problems within the last 4 weeks of the interview. The Physical Component Summary Scale (PCS) summarises different aspects of physical health (eg, physical functioning, bodily pain, general health). The MCS and PCS range from 0 to 100, with higher values indicating better health. The mean value of the GSOEP 2004 population is set to 50 with an SD of 10.40 41 We used the raw data of the subscales and transformed them using the algorithm from Andersen et al 40 separately for all years.
Confounder
All presented models were adjusted for family structure (no partner, married, living with partner), migration background (with or without migration background) and residence (East or West Germany). These sociodemographic determinants were known to be associated with socioeconomic status and/or with SRH. For example, residence in Germany is important, as there are higher rates of unemployment and poverty in East Germany compared to West Germany. Furthermore, migration background is associated with educational attainment, often resulting in lower educational degrees for men and women with migration background.42 Additionally, family structure correlates with SRH, as well as physical and mental health problems.43
Statistical analysis
Analyses were stratified by gender. Bivariate analyses were used to describe trends in SRH, MCS and PCS, as well as in educational level from 1994 to 2014 (figures 1–4). For the analysis of educational inequalities in SRH, we used generalised linear regression models for binomial data with a logarithmic link function to calculate the Relative Index of Inequality (RII) and with an identity link function to compute the Slope Index of Inequality (SII).44–46 The RII (SII) can be interpreted as the estimated relative rate ratio (absolute rate difference) for poor SRH between people with the lowest and highest levels of education. These two measures take into account the entire distribution of educational groups and are frequently used when comparing socioeconomic inequalities in health over time or between countries.1 8 15 20 47 48 To calculate RII and SII, the educational groups were transformed into cumulative rank probabilities (ridit score) ranging from 0 (highest) to 1 (lowest).15 49 The weighted ridits were generated for each year separately via the Stata wridit function.49 50 The educational groups were sorted from highest to lowest, as high education was used as reference category, and each group was assigned a so-called ridit score.
Figure 1.

Trends in educational level in men, German Socio-Economic Panel, nobservations=106 221.
Figure 2.

Trends in educational level in women, German Socio-Economic Panel, nobservations=106 221.
Figure 3.

Trends in rather poor self-rated health in men and women, German Socio-Economic Panel, nobservations=106 221.
Figure 4.

Trends in MCS and PCS in men and women, German Socio-Economic Panel, nobservations=39 541. MCS, Mental Component Summary Scale; PCS, Physical Component Summary Scale.
Linear regression models were calculated for the association of MCS and PCS and educational level. In the analysis of educational inequalities in MCS and PCS, generalised linear regression models were used with logarithmic link functions to compute the RII and an identity link function to compute SII, respectively. In both cases, a Gaussian distribution family of MCS and PCS was set. Trend analyses were derived using multivariate models that tested the main effects and interactions of dummy variables for education (ridit scores) and a continuous time trend variable. This trend variable was generated by recoding the calendar year in values from 0=1994 to 1=2014 implying, for example, 0.95 for 2013.18 49 As the study did not focus on intraindividual changes and within difference in the outcome and the variables of control, all trend analyses were based on pooled data of the considered panel waves. The year-specific coefficients refer to cross-sectional data. Sensitivity analyses were also performed with different cut-off points for SRH. All analyses were carried out using STATA V.14 MP.
Ethics
Ethical approval for this study was not required as the data were extracted from the GSOEP set which did not contain any personally identifiable information.
Results
Study characteristics and trends in SRH and educational level
Table 1 presents the study population by age, gender, educational level, SRH, and mental and physical HRQOL. In total, 43.4% of participants reported rather poor health. Regarding educational level, 22% of the participants had a high and about one-third had a low level of education, whereas 45.4% of the participants were part of the medium educational group.
Table 1.
Sample characteristics, GSOEP 1994–2014, nobs=106 221
| % | n | |
| Years | ||
| 1994–2014 (persons) | 3782–7376 | |
| Total participants | 16 339 | |
| Total observations | 1 06 221 | |
| Sex | ||
| Women | 49.6 | 52 657 |
| Men | 50.4 | 53 564 |
| Educational level | ||
| High | 22.0 | 23 411 |
| Medium | 45.4 | 48 207 |
| Low | 32.6 | 34 603 |
| SRH | ||
| Rather good | 56.6 | 60 114 |
| Rather poor | 43.4 | 46 107 |
| MCS* | ||
| Mean | 48.8 | 39 541 |
| SD | 9.9 | |
| PCS* | ||
| Mean | 52.2 | 39 541 |
| SD | 8.3 | |
*The MCS and PCS range from 0 to 100, with higher values indicating better health. 50 represents the mean value, values above 50 indicate better health.
GSOEP, German Socio-Economic Panel; MCS, Mental Component Summary Scale; obs, observations, men and women aged 30–49 years; PCS, Physical Component Summary Scale; SRH, self-rated health.
There were noticeable changes in educational level for the educational groups (figures 1 and 2). In the mid-1990s, 40% of men were classified as low educated, whereas 30% of men belonged to that group starting from 2010. From 1994 to 2014, more study participants fell in the high and medium educational groups. For women, the trend was similar, although with greater changes in the medium and high educational levels. The percentage of poor SRH remained stable between 1994 and 2014 (figure 3). In contrast, MCS slightly increased and PCS decreased to a small degree (figure 4).
Educational inequalities in SRH
Figures 5 and 6 present educational inequalities in poor SRH for men and women. Between 1994 and 2014, significant absolute (SII) and relative (RII) educational inequalities in SRH were observed. Relative inequalities ranged from 1.50 to 2.10 in men and 1.25 to 1.87 in women (RII) (table 2). Trend analyses showed no significant increase or decrease over time for either gender. However, educational inequalities in men were slightly higher than in women.
Figure 5.
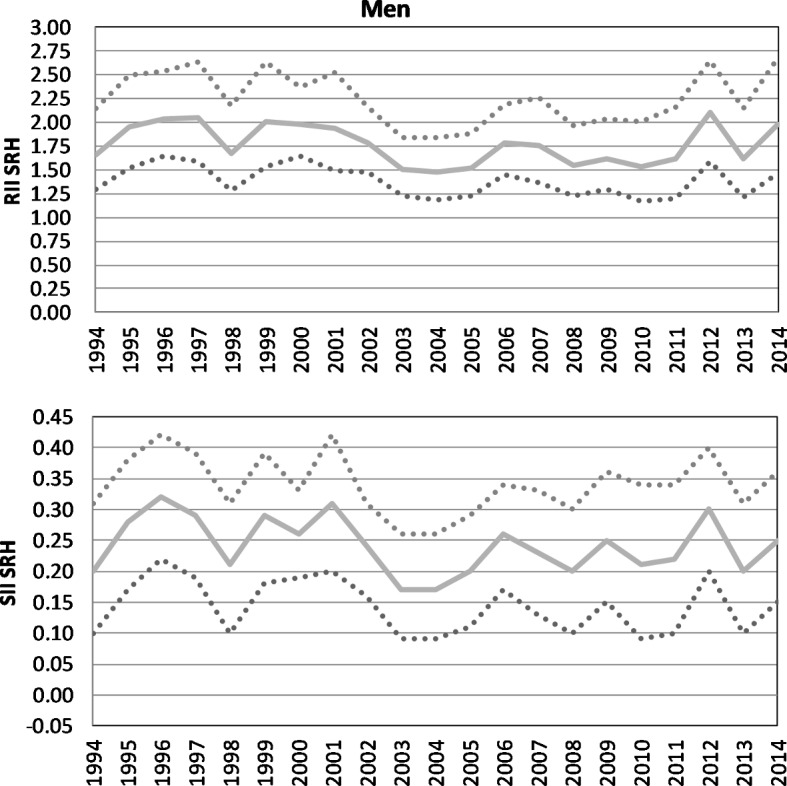
Absolute and relative educational inequalities in SRH in men, German Socio-Economic Panel, 1994–2014, nobservations=106 221. RII, Relative Index of Inequality; SII, Slope Index of Inequality; SRH, self-rated health.
Figure 6.
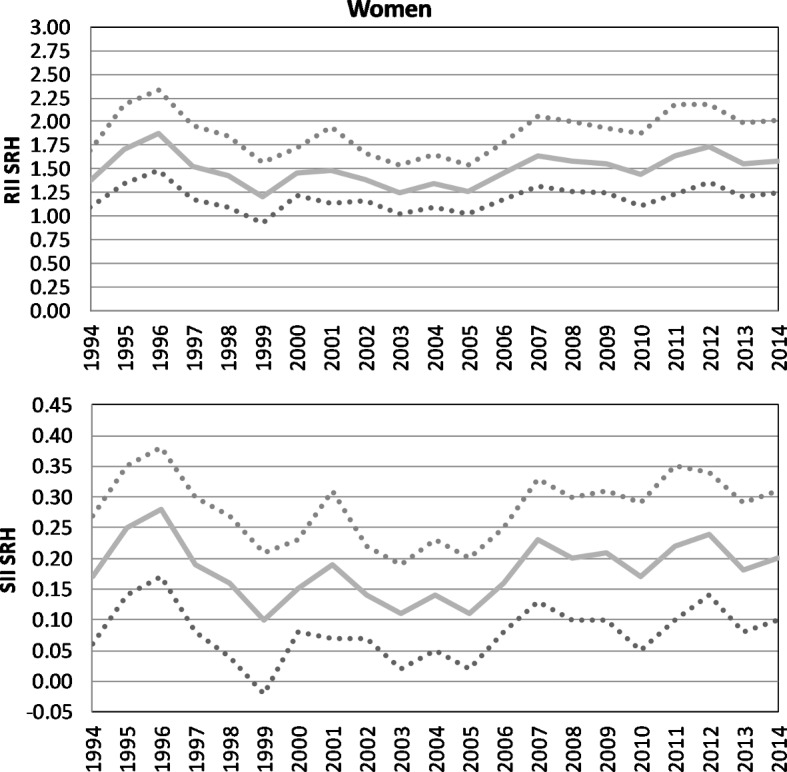
Absolute and relative educational inequalities in SRH in women, German Socio-Economic Panel, 1994–2014, nobservations=106 221. RII, Relative Index of Inequality; SII, Slope Index of Inequality; SRH, self-rated health.
Table 2.
Relative and absolute inequalities in SRH, RII and SII, GSOEP, nobs=106 221
| Men | Women | |||||||
| RII | CI | SII | CI | RII | CI | SII | CI | |
| 1994 | 1.66*** | 1.29 to 2.14 | 0.20*** | 0.10 to 0.31 | 1.37** | 1.10 to 1.70 | 0.17** | 0.06 to 0.27 |
| 1995 | 1.95*** | 1.52 to 2.49 | 0.28*** | 0.17 to 0.38 | 1.71*** | 1.35 to 2.18 | 0.25*** | 0.14 to 0.35 |
| 1996 | 2.04*** | 1.64 to 2.54 | 0.32*** | 0.22 to 0.42 | 1.87*** | 1.49 to 2.34 | 0.28*** | 0.17 to 0.38 |
| 1997 | 2.05*** | 1.59 to 2.64 | 0.29*** | 0.19 to 0.39 | 1.52** | 1.18 to 1.96 | 0.19*** | 0.08 to 0.30 |
| 1998 | 1.67*** | 1.28 to 2.18 | 0.21*** | 0.10 to 0.31 | 1.43** | 1.10 to 1.84 | 0.16** | 0.04 to 0.27 |
| 1999 | 2.01*** | 1.53 to 2.63 | 0.29*** | 0.18 to 0.39 | 1.21 | 0.93 to 1.57 | 0.10 | −0.02 to 0.21 |
| 2000 | 1.98*** | 1.65 to 2.37 | 0.26*** | 0.19 to 0.33 | 1.45*** | 1.22 to 1.72 | 0.15*** | 0.08 to 0.23 |
| 2001 | 1.94*** | 1.49 to 2.52 | 0.31*** | 0.20 to 0.42 | 1.48** | 1.13 to 1.95 | 0.19** | 0.07 to 0.31 |
| 2002 | 1.79*** | 1.48 to 2.16 | 0.24*** | 0.16 to 0.31 | 1.39*** | 1.16 to 1.66 | 0.14*** | 0.07 to 0.22 |
| 2003 | 1.50*** | 1.23 to 1.84 | 0.17*** | 0.09 to 0.26 | 1.25* | 1.02 to 1.54 | 0.11* | 0.02 to 0.19 |
| 2004 | 1.48*** | 1.19 to 1.84 | 0.17*** | 0.09 to 0.26 | 1.34** | 1.10 to 1.65 | 0.14** | 0.05 to 0.23 |
| 2005 | 1.52*** | 1.23 to 1.88 | 0.20*** | 0.11 to 0.29 | 1.26* | 1.02 to 1.54 | 0.11* | 0.02 to 0.20 |
| 2006 | 1.78*** | 1.45 to 2.19 | 0.26*** | 0.17 to 0.34 | 1.45*** | 1.18 to 1.78 | 0.16*** | 0.08 to 0.25 |
| 2007 | 1.76*** | 1.37 to 2.26 | 0.23*** | 0.13 to 0.33 | 1.64*** | 1.31 to 2.05 | 0.23*** | 0.13 to 0.33 |
| 2008 | 1.55*** | 1.22 to 1.97 | 0.20*** | 0.10 to 0.30 | 1.58*** | 1.26 to 2.00 | 0.20*** | 0.10 to 0.30 |
| 2009 | 1.62*** | 1.29 to 2.04 | 0.25*** | 0.15 to 0.36 | 1.55*** | 1.25 to 1.93 | 0.21*** | 0.10 to 0.31 |
| 2010 | 1.53** | 1.17 to 2.00 | 0.21*** | 0.09 to 0.34 | 1.44** | 1.11 to 1.88 | 0.17** | 0.05 to 0.29 |
| 2011 | 1.61** | 1.20 to 2.16 | 0.22*** | 0.10 to 0.34 | 1.64*** | 1.23 to 2.18 | 0.22*** | 0.10 to 0.35 |
| 2012 | 2.10*** | 1.59 to 2.65 | 0.30*** | 0.20 to 0.40 | 1.73*** | 1.36 to 2.18 | 0.24*** | 0.14 to 0.34 |
| 2013 | 1.61** | 1.21 to 2.14 | 0.20*** | 0.10 to 0.31 | 1.55*** | 1.21 to 1.99 | 0.18*** | 0.08 to 0.29 |
| 2014 | 1.98*** | 1.46 to 2.68 | 0.25 | 0.15 to 0.36 | 1.58*** | 1.24 to 2.01 | 0.20*** | 0.10 to 0.31 |
| Trend | 0.88 | 0.65 to 1.18 | −0.03 | −0.16 to 0.09 | 1.07 | 0.82 to 1.40 | 0.02 | −0.01 to 0.14 |
Adjusted for age, migration, family structure and residence.
*P<0.05; **P<0.01; ***P<0.001.
GSOEP, German Socio-Economic Panel; obs, observations, men and women aged 30–49 years; RII, Relative Index of Inequality; SII, Slope Index of Inequality; SRH, self-rated health.
Educational inequalities in mental and physical HRQOL
Regarding the mental component scale of HRQOL, the results do not show significant inequalities by education in contrast to the physical component scale (figures 7 and 8). Men with the lowest educational level rated their physical health between 4.5 and 6.6 points lower than those with the highest educational level (SII, absolute difference) (figure 9). A difference of 3.3–6.1 points in physical health between the lowest and the highest educational groups was also observed in women, to the disadvantage of the lowest educational group (figure 10). For women, educational inequalities in physical health increased over time (p<0.10), whereas men showed stable inequalities (table 3) that failed to reach significance level.
Figure 7.

Absolute and relative educational inequalities in mental health-related quality of life in men, German Socio-Economic Panel, 2002–2014, nobservations=39 541. MCS, Mental Component Summary Scale; RII, Relative Index of Inequality; SII, Slope Index of Inequality.
Figure 8.
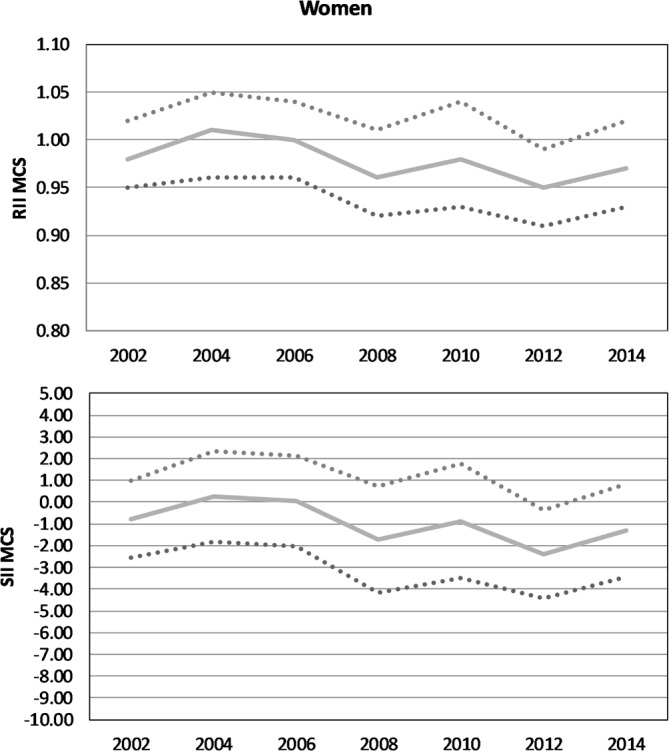
Absolute and relative educational inequalities in mental health-related quality of life in women, German Socio-Economic Panel, 2002–2014, nobservations=39 541. MCS, Mental Component Summary Scale; RII, Relative Index of Inequality; SII, Slope Index of Inequality.
Figure 9.

Absolute and relative educational inequalities in physical health-related quality of life in men, German Socio-Economic Panel, 2002–2014, nobservations=39 541. PCS, Physical Component Summary Scale; RII, Relative Index of Inequality; SII, Slope Index of Inequality.
Figure 10.

Absolute and relative educational inequalities in physical health-related quality of life in women, German Socio-Economic Panel, 2002–2014, nobservations=39 541. PCS, Physical Component Summary Scale; RII, Relative Index of Inequality; SII, Slope Index of Inequality.
Table 3.
Relative and absolute educational inequalities in health related quality of life in MCS and PCS health and educational level, RII and SII, GSOEP, nobs=39 541
| Men | Women | |||||||
| RII | CI | SII | CI | RII | CI | SII | CI | |
| MCS | ||||||||
| 2002 | 0.99 | 0.96 to 1.02 | −0.53 | −2.15 to 1.08 | 0.98 | 0.95 to 1.02 | −0.81 | −2.57 to 0.96 |
| 2004 | 0.99 | 0.95 to 1.02 | −0.64 | −2.48 to 1.19 | 1.01 | 0.96 to 1.05 | 0.28 | −1.80 to 2.36 |
| 2006 | 1.00 | 0.97 to 1.04 | 0.24 | −1.65 to 2.12 | 1.00 | 0.96 to 1.04 | 0.05 | −2.05 to 2.15 |
| 2008 | 1.00 | 0.96 to 1.04 | 0.13 | −1.89 to 2.14 | 0.96 | 0.92 to 1.01 | −1.73 | −4.16 to 0.70 |
| 2010 | 0.98 | 0.94 to 1.03 | −0.99 | −3.23 to 1.24 | 0.98 | 0.93 to 1.04 | −0.87 | −3.51 to 1.76 |
| 2012 | 0.97 | 0.93 to 1.01 | −1.64 | −3.81 to 0.54 | 0.95* | 0.91 to 0.99 | −2.39* | −4.43 to −0.35 |
| 2014 | 0.96 | 0.92 to 1.00 | −2.00 | −4.12 to 0.12 | 0.97 | 0.93 to 1.02 | −1.30 | −3.42 to 0.81 |
| Trend | 0.97 | 0.92 to 1.02 | −1.40 | −3.86 to 1.05 | 0.96 | 0.92 to 1.01 | −1.75 | −4.18 to 0.67 |
| PCS | ||||||||
| 2002 | 0.90*** | 0.88 to 0.92 | −5.70*** | −6.85 to −4.55 | 0.94*** | 0.92 to 0.97 | −3.26*** | −4.68 to −1.84 |
| 2004 | 0.92*** | 0.89 to 0.94 | −4.50*** | −5.93 to −3.07 | 0.91*** | 0.88 to 0.94 | −4.77*** | −6.47 to −3.06 |
| 2006 | 0.89*** | 0.87 to 0.91 | −6.09*** | −7.42 to −4.76 | 0.92*** | 0.89 to 0.94 | −4.68*** | −6.22 to −3.14 |
| 2008 | 0.89*** | 0.87 to 0.92 | −5.91*** | −7.51 to −4.30 | 0.90*** | 0.87 to 0.93 | −5.33*** | −7.05 to −3.61 |
| 2010 | 0.89*** | 0.86 to 0.93 | −5.91*** | −7.93 to −3.90 | 0.91*** | 0.87 to 0.95 | −5.06*** | −7.29 to −2.83 |
| 2012 | 0.89*** | 0.86 to 0.91 | −6.39*** | −8.03 to −4.74 | 0.90*** | 0.87 to 0.94 | −5.29*** | −7.09 to −3.49 |
| 2014 | 0.88*** | 0.85 to 0.92 | −6.63*** | −8.59 to −4.67 | 0.89*** | 0.86 to 0.92 | −6.12*** | −7.95 to −4.28 |
| Trend | 0.98 | 0.94 to 1.01 | −1.19 | −3.18 to 0.81 | 0.96† | 0.92 to 1.00 | −2.08† | −4.22 to 0.07 |
Adjusted for age, migration, family structure and residence.
*P<0.05; **P<0.01; ***P<0.001.
†P<0.10.
GSOEP, German Socio-Economic Panel; MCS, Mental Component Summary Scale; obs=observations, men and women aged 30–49 years; PCS, Physical Component Summary Scale; RII, Relative Index of Inequality; SII, Slope Index of Inequality.
Discussion
Summary of the results
This study is among the first to analyse time trends in educational inequalities in SRH and mental and physical HRQOL in the middle-aged population over a time period of up to 21 years in Germany. Our results indicate that our first hypothesis can be largely confirmed. A significant social gradient for SRH and HRQOL in physical health among men and women aged 30–49 years was observed to the disadvantage of lower educated people in almost every survey year. However, no educational inequalities were found in HRQOL regarding mental health for men and women. The second hypothesis can also be confirmed as the existing inequalities in health remained stable over time. Exceptions were educational inequalities with respect to the physical components of HRQOL in women which increased significantly from 2002 to 2014. Therefore, our third hypothesis is partially true as there are gender differences, for example, in educational level or in the extent of educational inequalities in health. We found a decline in poor SRH and an increase in educational level over time, most notably among women.
Comparing and explaining the results
In accordance with other studies, we found persistent health inequalities over time.5–7 17 51 The few previous studies that examining trends in educational inequalities in SRH among adults in Germany also found rather stable inequalities between 1994 and 2006.52 53 Consistent with our results, Pförtner and Elgar20 found constant inequalities by material deprivation in SRH. To date, no studies have analysed the trends in educational inequalities in HRQOL in Germany. However, previous research has shown that health inequalities by income and occupational status increased over the last few decades.17 21 Similar results were found for educational inequalities in life expectancy54 and health behaviours, such as smoking and leisure-time physical activity.46 48 The persistence of health inequalities over time highlights how strongly health inequalities are embedded in Western societies.16 47 Trend studies often illustrate social inequalities in health over time, but they rarely try to explain why these inequalities persist by including mediating determinants. However, Granström et al 5 showed that the lower educated group reported poor SRH which was associated with lack of financial resources, smoking and low optimism in all survey waves in a cross-sectional survey in 2000, 2004 and 2008 in Sweden. Their results suggest that the same explanations found for cross-sectional studies, namely unequal distribution of material/structural, psychosocial and behavioural factors,5 23 55–58 have not changed much over time and persist in producing health inequalities. However, future studies need to concentrate on explaining the persistence of education-related health inequalities. People with lower socioeconomic status tend to live and work in rather health-detrimental circumstances, have fewer psychosocial resources, more hazards and engage in more risky behaviour, such as substance use and less physical activity. Furthermore, the results show that health inequalities persist, even though efforts have been made to attenuate the consequences of social disadvantages. Therefore, one can assume that policy-makers should find alternative ways to enhance health for the less privileged.
In accordance with other studies, our results showed that the proportions of the different levels of education changed over the last few decades. The group of people with a higher educational level increased while the low educational group decreased.5 However, SRH did not increase over time. Although the (overall) level of education increased, educational inequalities in health did not; they remained stable over time. As all socioeconomic groups (to different degrees) benefit from educational expansion,24 it can be assumed that the social gap remains and continues to result in educational inequalities in health. Results from a study in 18 European countries show that widening educational inequalities (here in mortality) can partly be attributed to educational expansion.27 Our results, using RII and SII in SRH, support these assumptions and confirm that the difference between the lowest and highest educational group still has not narrowed.
Our study found no educational inequalities for HRQOL in mental health. Only a few studies have analysed HRQOL in mental and physical health domains, either separately or apart from SRH or over time. Although, for specific mental disorders, a social gradient was often reported (eg, for depression59), other studies have provided heterogeneous results. For example, Lahelma et al 60 have found no occupational class inequalities in mental health, but have reported them in physical health. Others have found inequalities in mental health, and additional studies have found weak, no or reversed inequalities in mental health. An explanation for the absence of health inequalities in association with education in our study might be due to the specific study population. It may be that a higher socioeconomic status based on educational level or high occupational position is mentally demanding resulting in fewer or no inequalities.60 This might be even more important for men and women between aged 30-49 years, as they are more likely to build their career and, especially in the beginning, might be struggling with financial burdens due to raising young children. Since this development is evident in all social positions, it might not affect single positions, especially with respect to educational level. This assumption is highlighted by the design of the MCS and PCS which measure HRQOL instead of mental or physical health itself.
Strengths and limitations
The strength of this study is the large sample size representing the German population and offering the opportunity for a trend analysis covering a 21-year time span. In addition, as the GSOEP represents the residential population of Germany, we believe that the results can be generalised for Germany. However, the study also has some limitations that need to be considered. First, rather modest effect sizes in the extent of social inequalities in SRH were observed. Effect size might differ between studies due to the cut-off point of ‘less than good’ in the measurement of SRH. Also, variation exists in the categorisation of SRH, with some studies categorising SRH as we did5 51 55 61 and others including ‘satisfactory’ in the good health group.17 20 23 56 We have therefore conducted a sensitivity analysis, in which ‘satisfactory’ was part of the reference category ‘good health’. As we anticipated, the RII increased, while the slope index decreased. Consequently, the relative risk for people with a low level of education to assess their own health as only poor or bad is even higher, but the absolute difference of people with poor SRH in the lower and upper educational groups (ridit scores) is smaller. Second, no clear trend is evident in our results, potentially as a result of outlier values in some years, which might be due to sample refreshments in the respective years. However, as we used a weighting variable controlling for the study participants, we do not expect a strong bias. Third, although we found increased educational inequalities in the physical component of HRQOL in women between 2002 and 2014, the p value was significant only at the 10% level. Therefore, the results may be interpreted with caution. Fourth, the results might also be biased because of the subjective measure of SRH. Studies have found that the predictive ability of SRH for mortality weakens with increasing socioeconomic advantage among middle-aged individuals in the short-term and over a follow-up period.62 There are studies showing that groups may differ in their use of response categories, for example, lower and higher educated people rate their health differently (response category differential item functioning; DIF). A method to consider such differences is to create anchoring vignettes to adjust for SRH item. For instance, one study found that those with higher education rate their health more positively than those with lower education, but that this relationship weakened when DIF was considered.63 However, the evidence is heterogeneous,64 and further studies are needed, taking these differences in rating styles into account to prevent misestimation the effect strength.
Conclusion
The current study contributes to overcoming the lack of research on time trends in educational inequalities in different health outcomes in Germany over the last few decades. The findings suggest that educational inequalities in SRH as well as in mental and physical HRQOL among the population aged 30–49 years were persistent and did not notably change.
Although no increase in educational inequalities in health was found in our study, a public health problem remains as these inequalities also did not decrease either. Therefore, it can be assumed that previous efforts have not been successful in reducing health inequalities. Further studies should focus on explaining why these inequalities persist over time and what strategies might be more effective in tackling educational inequalities in SRH and HRQOL. The results would help policy-makers develop and implement more adequate strategies for tackling socioeconomic inequalities in health.
Supplementary Material
Footnotes
Contributors: IM designed the study, led the writing and the interpretation of the data and wrote the first draft of the article. SG performed the statistical analyses in collaboration with IM. MR contributed to the conception of the study, supervised the data analyses and provided critical comments on the manuscript. SG, AK, JH, T-KP and TL assisted with data interpretation and editing of the article. All authors read and approved the final manuscript.
Funding: This study is part of the project “Explaining health inequalities in adulthood. A life course perspective using the German Socioeconomic Panel study (GSOEP)” which is funded by the German Research Foundation (DFG), with grant agreement number No. RI2467/2-1.
Competing interests: None declared.
Patient consent: Not required.
Provenance and peer review: Not commissioned; externally peer reviewed.
Data sharing statement: GSOEP data are available free of charge for scientific use from the German Institute for Economic Research (DIW).
References
- 1. Mackenbach JP, Stirbu I, Roskam AJ, et al. Socioeconomic inequalities in health in 22 European countries. N Engl J Med 2008;358:2468–81. 10.1056/NEJMsa0707519 [DOI] [PubMed] [Google Scholar]
- 2. European Commission. Health inequalities in the EU - Final report of a consortium: Consortium lead: Sir Michael Marmot, 2013. [Google Scholar]
- 3. Mackenbach JP, Kulhánová I, Menvielle G, et al. Trends in inequalities in premature mortality: a study of 3.2 million deaths in 13 European countries. J Epidemiol Community Health 2015;69:207–17. discussion 205-6 10.1136/jech-2014-204319 [DOI] [PubMed] [Google Scholar]
- 4. Bleich SN, Jarlenski MP, Bell CN, et al. Health inequalities: trends, progress, and policy. Annu Rev Public Health 2012;33:7–40. 10.1146/annurev-publhealth-031811-124658 [DOI] [PMC free article] [PubMed] [Google Scholar]
- 5. Granström F, Molarius A, Garvin P, et al. Exploring trends in and determinants of educational inequalities in self-rated health. Scand J Public Health 2015;43:677–86. 10.1177/1403494815592271 [DOI] [PubMed] [Google Scholar]
- 6. Helasoja V, Lahelma E, Prättälä R, et al. Trends in the magnitude of educational inequalities in health in Estonia, Latvia, Lithuania and Finland during 1994-2004. Public Health 2006;120:841–53. 10.1016/j.puhe.2006.05.007 [DOI] [PubMed] [Google Scholar]
- 7. Daponte-Codina A, Bolívar-Muñoz J, Toro-Cárdenas S, et al. Area deprivation and trends in inequalities in self-rated health in Spain, 1987--2001. Scand J Public Health 2008;36:504–15. 10.1177/1403494807088454 [DOI] [PubMed] [Google Scholar]
- 8. Mackenbach JP, Kulhánová I, Artnik B, et al. Changes in mortality inequalities over two decades: register based study of European countries. BMJ 2016;353:i1732 10.1136/bmj.i1732 [DOI] [PMC free article] [PubMed] [Google Scholar]
- 9. Mackenbach JP others. Health inequalities: Europe in profile: produced by COI for the Department of Health, 2006. [Google Scholar]
- 10. Maron J, Mielck A. Nimmt die gesundheitliche Ungleichheit zu? Ergebnisse eines Literaturreviews und Empfehlungen für die weitere Forschung. Gesundheitswesen 2015;77:137–47. [DOI] [PubMed] [Google Scholar]
- 11. Marmot M. Social determinants of health inequalities. The Lancet 2005;365:1099–104. 10.1016/S0140-6736(05)74234-3 [DOI] [PubMed] [Google Scholar]
- 12. Koskinen S, Puska P. From social determinants to reducing health inequalities. Int J Public Health 2009;54:53–4. 10.1007/s00038-009-7069-x [DOI] [PubMed] [Google Scholar]
- 13. Khang YH, Lynch JW, Yun S, et al. Trends in socioeconomic health inequalities in Korea: use of mortality and morbidity measures. J Epidemiol Community Health 2004;58:308–14. 10.1136/jech.2003.012989 [DOI] [PMC free article] [PubMed] [Google Scholar]
- 14. Moor I, Richter M, Ravens-Sieberer U, et al. Trends in social inequalities in adolescent health complaints from 1994 to 2010 in Europe, North America and Israel: The HBSC study. Eur J Public Health 2015;25(Suppl 2):57–60. 10.1093/eurpub/ckv028 [DOI] [PubMed] [Google Scholar]
- 15. Elgar FJ, Pförtner TK, Moor I, et al. Socioeconomic inequalities in adolescent health 2002-2010: a time-series analysis of 34 countries participating in the Health Behaviour in School-aged Children study. Lancet 2015;385:2088–95. 10.1016/S0140-6736(14)61460-4 [DOI] [PubMed] [Google Scholar]
- 16. Dalstra JA, Kunst AE, Geurts JJ, et al. Trends in socioeconomic health inequalities in the Netherlands, 1981-1999. J Epidemiol Community Health 2002;56:927–34. 10.1136/jech.56.12.927 [DOI] [PMC free article] [PubMed] [Google Scholar]
- 17. Kroll LE, Lampert T. Unemployment, social support and health problems: results of the GEDA study in Germany, 2009. Dtsch Arztebl Int 2011;108:47–52. 10.3238/arztebl.2011.0047 [DOI] [PMC free article] [PubMed] [Google Scholar]
- 18. Kroll LE, Lampert T. Changing health inequalities in Germany from 1994 to 2008 between employed and unemployed adults. Int J Public Health 2011;56:329–39. 10.1007/s00038-011-0233-0 [DOI] [PubMed] [Google Scholar]
- 19. Krause P. Einkommensungleichheit in Deutschland. Wirtschaftsdienst 2015;95:572–4. 10.1007/s10273-015-1869-9 [DOI] [Google Scholar]
- 20. Pförtner TK, Elgar FJ. Widening inequalities in self-rated health by material deprivation? A trend analysis between 2001 and 2011 in Germany. J Epidemiol Community Health 2016;70 10.1136/jech-2015-205948 [DOI] [PubMed] [Google Scholar]
- 21. Siegel M, Vogt V, Sundmacher L. From a conservative to a liberal welfare state: decomposing changes in income-related health inequalities in Germany, 1994-2011. Soc Sci Med 2014;108:10–19. 10.1016/j.socscimed.2014.02.022 [DOI] [PubMed] [Google Scholar]
- 22. Chandola T, Clarke P, Morris JN, et al. Pathways between education and health: a causal modelling approach. J R Stat Soc Ser A Stat Soc 2006;169:337–59. 10.1111/j.1467-985X.2006.00411.x [DOI] [Google Scholar]
- 23. Daoud N, Soskolne V, Manor O. Educational inequalities in self-rated health within the Arab minority in Israel: explanatory factors. Eur J Public Health 2009;19:477–83. 10.1093/eurpub/ckp080 [DOI] [PubMed] [Google Scholar]
- 24. Becker R. Entstehung und Reproduktion dauerhafter Bildungsungleichheiten Lehrbuch der Bildungssoziologie. Wiesbaden: VS Verlag für Sozialwissenschaften, 2011:87–138. [Google Scholar]
- 25. Bambra C. Health inequalities and welfare state regimes: theoretical insights on a public health ‘puzzle’. J Epidemiol Community Health 2011;65:740–5. 10.1136/jech.2011.136333 [DOI] [PubMed] [Google Scholar]
- 26. Mackenbach JP. The persistence of health inequalities in modern welfare states: the explanation of a paradox. Soc Sci Med 2012;75:761–9. 10.1016/j.socscimed.2012.02.031 [DOI] [PubMed] [Google Scholar]
- 27. Östergren O, Lundberg O, Artnik B, et al. Educational expansion and inequalities in mortality-A fixed-effects analysis using longitudinal data from 18 European populations. PLoS One 2017;12:e0182526 10.1371/journal.pone.0182526 [DOI] [PMC free article] [PubMed] [Google Scholar]
- 28. Kestilä L, Martelin T, Rahkonen O, et al. The contribution of childhood circumstances, current circumstances and health behaviour to educational health differences in early adulthood. BMC Public Health 2009;9:164 10.1186/1471-2458-9-164 [DOI] [PMC free article] [PubMed] [Google Scholar]
- 29. Moor I, Spallek J, Richter M. Explaining socioeconomic inequalities in self-rated health: a systematic review of the relative contribution of material, psychosocial and behavioural factors. J Epidemiol Community Health 2017;71:565–75. 10.1136/jech-2016-207589 [DOI] [PubMed] [Google Scholar]
- 30. Thrane C. Explaining educational-related inequalities in health: mediation and moderator models. Soc Sci Med 2006;62:467–78. 10.1016/j.socscimed.2005.06.010 [DOI] [PubMed] [Google Scholar]
- 31. Ross CE, Wu C-ling. The links between education and health. Am Sociol Rev 1995;60:719–45. 10.2307/2096319 [DOI] [Google Scholar]
- 32. von Elm E, Altman DG, Egger M, et al. The Strengthening the Reporting of Observational Studies in Epidemiology (STROBE) Statement: guidelines for reporting observational studies. Int J Surg 2014;12:1495–9. 10.1016/j.ijsu.2014.07.013 [DOI] [PubMed] [Google Scholar]
- 33. Wagner GG, Göbel J, Krause P, et al. Das Sozio-oekonomische Panel (SOEP): Multidisziplinäres Haushaltspanel und Kohortenstudie für Deutschland – Eine Einführung (für neue Datennutzer) mit einem Ausblick (für erfahrene Anwender). AStA Wirtschafts- und Sozialstatistisches Archiv 2008;2:301–28. 10.1007/s11943-008-0050-y [DOI] [Google Scholar]
- 34. Schupp J. Das Sozio-oekonomische Panel (SOEP). Bundesgesundheitsblatt Gesundheitsforschung Gesundheitsschutz 2012;55:767–74. 10.1007/s00103-012-1496-1 [DOI] [PubMed] [Google Scholar]
- 35. Lampert T, Kroll L, Müters S, et al. Messung des sozioökonomischen Status in der Studie zur Gesundheit Erwachsener in Deutschland (DEGS1). Bundesgesundheitsblatt Gesundheitsforschung Gesundheitsschutz 2013;56:631–6. 10.1007/s00103-012-1663-4 [DOI] [PubMed] [Google Scholar]
- 36. Miething A. A matter of perception: exploring the role of income satisfaction in the income-mortality relationship in German survey data 1995-2010. Soc Sci Med 2013;99:72–9. 10.1016/j.socscimed.2013.10.017 [DOI] [PubMed] [Google Scholar]
- 37. Idler EL, Benyamini Y. Self-rated health and mortality: a review of twenty-seven community studies. J Health Soc Behav 1997;38:21–37. 10.2307/2955359 [DOI] [PubMed] [Google Scholar]
- 38. Jylhä M. What is self-rated health and why does it predict mortality? Towards a unified conceptual model. Soc Sci Med 2009;69:307–16. 10.1016/j.socscimed.2009.05.013 [DOI] [PubMed] [Google Scholar]
- 39. Burström B, Fredlund P. Self rated health: Is it as good a predictor of subsequent mortality among adults in lower as well as in higher social classes? J Epidemiol Community Health 2001;55:836–40. 10.1136/jech.55.11.836 [DOI] [PMC free article] [PubMed] [Google Scholar]
- 40. Andersen HH, Mühlbacher A, Nübling M, et al. Computation of standard values for physical and mental health scale scores using the SOEP version of SF-12v2. Schmollers Jahrbuch 2007;127:171–82. [Google Scholar]
- 41. Schmitz H. Why are the unemployed in worse health? The causal effect of unemployment on health. Labour Econ 2011;18:71–8. 10.1016/j.labeco.2010.08.005 [DOI] [Google Scholar]
- 42. Diefenbach H. Der Bildungserfolg von Schülern mit Migrationshintergrund im Vergleich zu Schülern ohne Migrationshintergrund : Becker R, Lehrbuch der Bildungssoziologie. Wiesbaden: VS Verlag für Sozialwissenschaften, 2011:449–73. [Google Scholar]
- 43. Lampert T, Hoebel J, Kuntz B, et al. Robert Koch Institute Gesundheit von alleinerziehenden Müttern und Vätern In: eds Gesundheitsberichterstattung des Bundes Gemeinsam getragen von RKI und DeStatis.Gesundheitliche Ungleichheit in verschiedenen Lebensphasen, 2017:69–72. [Google Scholar]
- 44. Khang YH, Yun SC, Lynch JW. Monitoring trends in socioeconomic health inequalities: it matters how you measure. BMC Public Health 2008;8:66 10.1186/1471-2458-8-66 [DOI] [PMC free article] [PubMed] [Google Scholar]
- 45. Moreno-Betancur M, Latouche A, Menvielle G, et al. Relative index of inequality and slope index of inequality: a structured regression framework for estimation. Epidemiology 2015;26:518–27. 10.1097/EDE.0000000000000311 [DOI] [PubMed] [Google Scholar]
- 46. Hoebel J, Finger JD, Kuntz B, et al. Changing educational inequalities in sporting inactivity among adults in Germany: a trend study from 2003 to 2012. BMC Public Health 2017;17:547 10.1186/s12889-017-4478-2 [DOI] [PMC free article] [PubMed] [Google Scholar]
- 47. Kunst AE, Bos V, Lahelma E, et al. Trends in socioeconomic inequalities in self-assessed health in 10 European countries. Int J Epidemiol 2005;34:295–305. 10.1093/ije/dyh342 [DOI] [PubMed] [Google Scholar]
- 48. Hoebel J, Kuntz B, Kroll LE, et al. Trends in absolute and relative educational inequalities in adult smoking since the early 2000s: the case of Germany. Nicotine Tob Res 2018;20:295-302 10.1093/ntr/ntx087 [DOI] [PubMed] [Google Scholar]
- 49. Strand BH, Steingrímsdóttir ÓA, Grøholt EK, et al. Trends in educational inequalities in cause specific mortality in Norway from 1960 to 2010: a turning point for educational inequalities in cause specific mortality of Norwegian men after the millennium? BMC Public Health 2014;14:1208 10.1186/1471-2458-14-1208 [DOI] [PMC free article] [PubMed] [Google Scholar]
- 50. Harper S, Lynch JW. Measuring health inequalities : Oakes JM, Kaufman JS, Methods in social epidemiology. San Francisco: Jossey-Bass, 2006. [Google Scholar]
- 51. Hu Y, van Lenthe FJ, Borsboom GJ, et al. Trends in socioeconomic inequalities in self-assessed health in 17 European countries between 1990 and 2010. J Epidemiol Community Health 2016;70:644–52. 10.1136/jech-2015-206780 [DOI] [PubMed] [Google Scholar]
- 52. Nolte E, McKee M. Changing health inequalities in east and west Germany since unification. Soc Sci Med 2004;58:119–36. 10.1016/S0277-9536(03)00153-9 [DOI] [PubMed] [Google Scholar]
- 53. Kroll LE. Sozialer Wandel, soziale Ungleichheit und Gesundheit: Die Entwicklung sozialer und gesundheitlicher Ungleichheiten in Deutschland zwischen 1984 und 2006. Wiesbaden: VS Verlag für Sozialwissenschaften / Springer Fachmedien Wiesbaden GmbH, 2010. [Google Scholar]
- 54. Klein T, Unger R, Schulze A, et al. Bildungsexpansion und Lebenserwartung : Hadjar A, Becker R, Die Bildungsexpansion: Erwartete und unerwartete Folgen. Wiesbaden: VS Verlag für Sozialwissenschaften, GWV Fachverlage GmbH, 2006:311–31. [Google Scholar]
- 55. Aldabe B, Anderson R, Lyly-Yrjänäinen M, et al. Contribution of material, occupational, and psychosocial factors in the explanation of social inequalities in health in 28 countries in Europe. J Epidemiol Community Health 2011;65:1123–31. 10.1136/jech.2009.102517 [DOI] [PMC free article] [PubMed] [Google Scholar]
- 56. Kurtze N, Eikemo TA, Kamphuis CB. Educational inequalities in general and mental health: differential contribution of physical activity, smoking, alcohol consumption and diet. Eur J Public Health 2013;23:223–9. 10.1093/eurpub/cks055 [DOI] [PubMed] [Google Scholar]
- 57. Soskolne V, Manor O. Health inequalities in Israel: explanatory factors of socio-economic inequalities in self-rated health and limiting longstanding illness. Health Place 2010;16:242–51. 10.1016/j.healthplace.2009.10.005 [DOI] [PubMed] [Google Scholar]
- 58. van Oort FV, van Lenthe FJ, Mackenbach JP. Material, psychosocial, and behavioural factors in the explanation of educational inequalities in mortality in The Netherlands. J Epidemiol Community Health 2005;59:214–20. 10.1136/jech.2003.016493 [DOI] [PMC free article] [PubMed] [Google Scholar]
- 59. Lorant V, Deliège D, Eaton W, et al. Socioeconomic inequalities in depression: a meta-analysis. Am J Epidemiol 2003;157:98–112. 10.1093/aje/kwf182 [DOI] [PubMed] [Google Scholar]
- 60. Lahelma E, Martikainen P, Rahkonen O, et al. Occupational class inequalities across key domains of health: results from the Helsinki Health Study. Eur J Public Health 2005;15:504–10. 10.1093/eurpub/cki022 [DOI] [PubMed] [Google Scholar]
- 61. Hiyoshi A, Fukuda Y, Shipley MJ, et al. Health inequalities in Japan: the role of material, psychosocial, social relational and behavioural factors. Soc Sci Med 2014;104:201–9. 10.1016/j.socscimed.2013.12.028 [DOI] [PubMed] [Google Scholar]
- 62. Singh-Manoux A, Dugravot A, Shipley MJ, et al. The association between self-rated health and mortality in different socioeconomic groups in the GAZEL cohort study. Int J Epidemiol 2007;36:1222–8. 10.1093/ije/dym170 [DOI] [PMC free article] [PubMed] [Google Scholar]
- 63. Grol-Prokopczyk H, Freese J, Hauser RM. Using anchoring vignettes to assess group differences in general self-rated health. J Health Soc Behav 2011;52:246–61. 10.1177/0022146510396713 [DOI] [PMC free article] [PubMed] [Google Scholar]
- 64. d’Uva TB, Lindeboom M, O’Donnell O, et al. Education-related inequity in healthcare with heterogeneous reporting of health. J R Stat Soc Ser A Stat Soc 2011;174:639–64. 10.1111/j.1467-985X.2011.00706.x [DOI] [PMC free article] [PubMed] [Google Scholar]
Associated Data
This section collects any data citations, data availability statements, or supplementary materials included in this article.