


Abstract
The bacterial histone-like protein H-NS silences AT-rich DNA, binding DNA as ‘stiffened’ filaments or ‘bridged’ intrastrand loops. The switch between these modes has been suggested to depend on the concentration of divalent cations, in particular Mg2+, with elevated Mg2+ concentrations associated with a transition to bridging. Here we demonstrate that the observed binding mode is a function of the local concentration of H-NS and its cognate binding sites, as well as the affinity of the interactions between them. Mg2+ does not control a binary switch between these two modes but rather modulates the affinity of this interaction, inhibiting the DNA-binding and silencing activity of H-NS in a continuous linear fashion. The direct relationship between conditions that favor stiffening and transcriptional silencing activity suggests that although both modes can occur in the cell, stiffening is the predominant mode of binding at silenced genes.
INTRODUCTION
The histone-like nucleoid structuring protein H-NS plays a pivotal role in gene regulation and in the evolution of α-, β- and γ-proteobacteria such as Salmonella enterica by serving as a xenogeneic silencer that can bind and repress AT-rich DNA sequences (1,2). Xenogeneic silencing allows the recipients of newly-acquired genes to avoid adventitious effects of unregulated gene expression and to integrate horizontally-acquired genes into existing regulatory networks (3). H-NS exhibits two critical features required for its role as a xenogeneic silencer. The first is an ability to recognize DNA with relatively increased AT-content via a Q/RGR or AT-hook motif (4), which recognizes the unique minor groove conformation of AT-rich DNA, in particular ‘TpA steps’ that create a kink in the DNA backbone. The second feature is the presence of an amino-terminal oligomerization domain, which allows H-NS to oligomerize in both head-to-head and tail-to-tail orientations, forming chains when bound to DNA (5–11). H-NS nucleation at high-affinity TpA sites can be followed by lateral oligomerization across long stretches of DNA to silence gene expression. H-NS–DNA oligomeric silencing complexes provide large regulatory targets that can be relieved by competing counter-silencing mechanisms to control gene expression. The architectural flexibility of counter-silencing appears to be evolutionarily favored over the precise structural constraints required by RNA polymerase for canonical activation (3,12).
Although recent studies have provided significant insights into H-NS–DNA interactions, details of the higher-order structure of silencing complexes remain unclear due to conflicting lines of evidence regarding the mode of DNA binding by H-NS. Initial atomic force microscopy studies suggested that H-NS forms loops between relatively distant DNA regions as a result of its multiple dimerization domains (13,14), termed the ‘bridging’ mode of binding. However, biophysical studies have shown that an H-NS–DNA complex forms stiffened filaments (15), termed the ‘stiffening’ mode of binding. Liu et al. (16) subsequently demonstrated that both binding modes could be observed in vitro, and suggested that the switch between the two distinctive binding modes is controlled by divalent cation concentrations. Under low (<2 mM) Mg2+ concentrations, stiffening appears to be the predominant binding mode, whereas higher (≥5 mM) Mg2+ concentrations are thought to promote bridging. Although the intracellular Mg2+ concentration is estimated to be 100 mM (17), most of this Mg2+ is sequestered by cellular components such as ribosomes. As a result, the concentration of free intracellular Mg2+ is thought to be approximately 1–2 mM (18,19). It is therefore conceivable that either stiffening or bridging modes of H-NS binding might be physiologically relevant, and previous studies have argued for regulatory roles of both binding modes. Lim et al. (20) demonstrated that mutant H-NS proteins that are unable to form filaments in vitro are also unable to function as silencers in vivo, suggesting that the stiffening mode is required for silencing. However, bridging has been shown to promote RNA polymerase (RNAP) pausing in vitro (21), suggesting a regulatory role for this binding mode as well.
The goal of the present study was to establish the H-NS binding mode relevant to transcriptional silencing and to clarify the role of divalent cation concentrations on H-NS actions. A model H-NS-silenced regulatory circuit based on the horizontally-acquired Salmonella enterica pagC promoter (12,22) was reconstituted using Mg2+ concentrations associated with promoting either stiffening (1 mM) or bridging (10 mM) modes of binding. Biochemical and biophysical assays were performed to assess the structure and activity of the H-NS–DNA complex under these conditions.
MATERIALS AND METHODS
DNA and protein purification
All experiments were performed using pRW6 (12), consisting of a 2.7 kb fragment of the S. Typhimurium 14028s chromosome containing the complete pagC promoter and coding sequence, as well as the coding sequences of upstream and downstream genes (Supplementary Figure S1), inserted into the low copy vector, pWKS30 (23), which was purified with a Qiagen Midi (Qiagen, Valencia, CA, USA), using the manufacturer's protocol for very low copy plasmids. DNA was then extracted twice with phenol:CHCl3:IAA (25:24:1), ethanol precipitated, and dissolved in 10 mM Tris–HCl (pH 8.0). H-NS was purified as an N-terminal 6xHis-tagged protein as previously described (12).
In vitro transcription
Reactions were performed as previously described (12), with the following changes: Reactions were assembled in IVT buffer containing 40 mM HEPES, pH 7.3, 60 mM potassium glutamate, 0.5 mM CaCl2, 1 mM DTT, 0.05% NP-40, 0.1 mg ml−1 BSA and 10% glycerol to a final volume of 20 μl. MgCl2 was added to the indicated concentration, followed by addition of pRW6 to a final concentration of 1 nM and 20 U of RNasin (Promega, Madison, WI, USA). Reactions were allowed to equilibrate for 10 min at 37°C before the addition of H-NS to the indicated concentration. Reactions were incubated for an additional 10 min at 37°C before adding RNAP (Epicentre, Madison, WI, USA) to a final concentration of 10 nM. Reactions were incubated at 37°C for 10 min before adding rNTPs to a final concentration of 2 mM. Reactions were then completed by incubating for 10 min at 37°C, allowing transcription to initiate continuously and terminate at intrinsic rho-independent terminators. Reactions were stopped by adding 20 μl of DNase I buffer and incubating at 37°C for 30 min, followed by 5 min of incubation at 65°C. Reactions were diluted 1:100 and reverse transcribed using the Qiagen QuantiTect Reverse Transcription Kit (Qiagen, Valencia, CA, USA) with the sequence and strand-specific probe pagC-3′-P (5′-TGTAGAGGAGATGTTGCTTCC-3′) in 10 μl reactions following the manufacturer's instructions. The resulting cDNA was quantified by qPCR in 20 μl SYBR Green master mix (24) on a BioRad CFX 96 (BioRad, Hercules, CA) using the primers pagC-3′-F (5′-AGAACATTCCACTCAGGATGGCGA-3′) and pagC-3′-R (5′- GACGACGATATTCTCCAGCGGATT-3′), generating a 112 bp amplicon. The specificity of each reaction was confirmed via melt curve analysis.
DNase I and UV laser footprinting
DNase I footprinting reactions were assembled in IVT buffer to a final volume of 20 μl with 1 nM pRW6 and MgCl2 was added to the indicated concentration. Reactions were equilibrated at 37°C for 10 min, H-NS was added to the indicated concentration, and reactions were incubated at 37°C for an additional 10 min. After the addition of 0.002 U of DNase I, digestion was allowed to proceed for 2 min at 37°C before stopping the reaction with 180 μl cold stop buffer containing 330 mM sodium acetate (pH 7.0), 20 mM EDTA and 0.5% sarkosyl. Reactions were then purified, quantified with the 6FAM-pagC probe (5′-6FAM-ACTTGTGAGTTCATCTCCTGAATTATGG-3′) and analyzed via DDFA as previously described (12).
UV laser footprinting reactions were assembled as described above, but the reactions were performed at room temperature. H-NS–DNA complexes were then exposed to an average of one 10 ns pulse of 266 nm UV radiation with an output pulse energy of ∼10 mJ and purified, quantified with the 6FAM-pagC probe, and analyzed as previously described (12).
Atomic force microscopy
Atomic force microscopy (AFM) was performed on a Bruker Dimension Icon (Bruker, Billerica, MA, USA) at the Molecular Analysis Facility at the University of Washington. The 2.7 kb pagC target fragment was generated by PCR using the primers pagC2.7F (5′-AGGCGCACTATACACGTCAGGAAA-3′) and pagC2.7R (5′-GATTTCGTTTATGGCCTGGGGATTT-3′), agarose gel purified and ethanol precipitated to remove excess salt. Mica was functionalized with APTES using the evaporation method (25) and then cured for 2 days under argon. The resulting AP-mica was then modified with 0.5% glutaraldehyde (26), washed with H2O, and allowed to dry under argon before samples were applied. 200 or 800 nM H-NS was bound to 2 ng/μl pagC target at room temperature in AFM binding buffer containing 40 mM HEPES, pH 7.3, 100 mM potassium glutamate and either 1 or 10 mM MgCl2, as indicated. Samples were applied to the glutaraldehyde-modified mica and allowed to bind for 10 min before washing with H2O and then allowed to dry for at least 2 h under argon. Samples were imaged in air using a ScanAsyst air tip (Bruker).
Light scattering
Light scattering reactions were assembled in AFM binding buffer containing either 1 or 50 mM MgCl2, as indicated, to a final volume of 120 μl. Where indicated, the 2.7 kb pagC target fragment used for AFM was added to a concentration of 2 ng/μl. H-NS was added where indicated to a final concentration of 800 nM, and reactions were incubated at room temperature for 30 min. The absorbance for each sample was measured on a Shimadzu UV-1700 spectrophotometer (Shimadzu, Kyoto, Japan).
Fluorescence anisotropy
Fluorescence anisotropy experiments were performed using a 36 bp DNA molecule formed by annealing two complementary oligonucleotides, 6FAM-HAhnsBS-F (5′-6-FAM-ATGGGTTTTATAGCGAAATAGACTTTTTTATCGCGT-3′) and HAhnsBS-R (5′-ACGCGATAAAAAAGTCTATTTCGCTATAAAACCCAT-3′). The oligonucleotides were combined at a final concentration of 50 μM, incubated at 95°C for 5 min, and then cooled at a rate of 0.1°C/s to allow the formation of a stable duplex. Fluorescence anisotropy experiments were assembled in AFM binding buffer containing 2 nM DNA and either 1 or 10 mM MgCl2, as indicated, to a final volume of 100 μl. H-NS was added at a range of concentrations between 10 and 1000 nM, and the reactions were allowed to equilibrate for 30 min at room temperature. Reactions were analyzed on a Tecan Safire II (Tecan, Männendorf, Switzerland).
RESULTS AND DISCUSSION
H-NS-mediated silencing is dependent on Mg2+ concentration
The entire pagC coding sequence and flanking genes were included in a 2.7 kb insertion on a low-copy plasmid, which was used for all transcription and footprinting studies (Supplementary Figure S1). The use of a large target region maintains genomic context, and insertion in a low-copy plasmid vector allows the performance of biochemical and functional assays on a supercoiled DNA template. Our experimental design contrasts with previous studies of H-NS binding, both in the effort taken to maintain genomic and structural context, and in the use of a true H-NS-regulated template to allow a direct correlation of binding with transcriptional activity, whereas other studies have typically examined bulk H-NS–DNA interactions with large DNA targets such as the λ bacteriophage (16), pUC19 plasmid (13), calf thymus DNA (27), or artificial constructs fusing non-cognate promoters to H-NS-binding sites (21). In vitro transcription (IVT) reactions were performed with pagC incubated in the presence of increasing concentrations of H-NS and either high (10 mM) or low (1 mM) Mg2+ concentrations (Figure 1A). H-NS is a potent transcriptional silencer in 1 mM Mg2+, inhibiting pagC transcription 218-fold when present at a concentration of 500 nM, but repression decreased to only 9-fold in 10 mM Mg2+, suggesting that increasing divalent cation concentrations inhibit H-NS-mediated repression. While it is possible that H-NS may inhibit both transcription initiation and elongation, we have previously shown that RNAP is unable to bind the silenced pagC promoter (12), indicating that repression of pagC likely occurs at the level of transcription initiation. To exclude the effects of Mg2+ concentration on RNAP activity, the relative repression at each H-NS concentration was normalized to the baseline transcriptional activity of RNAP. Although RNAP activity appears to decrease modestly (∼4-fold) at low Mg2+ concentrations (<5 mM Mg2+) (Figure 1B; Supplementary Figure S2), this effect is insufficient to account for the degree of repression exhibited by H-NS. These observations indicate that H-NS is most active under conditions associated with stiffening, i.e. low Mg2+ concentrations.
Figure 1.
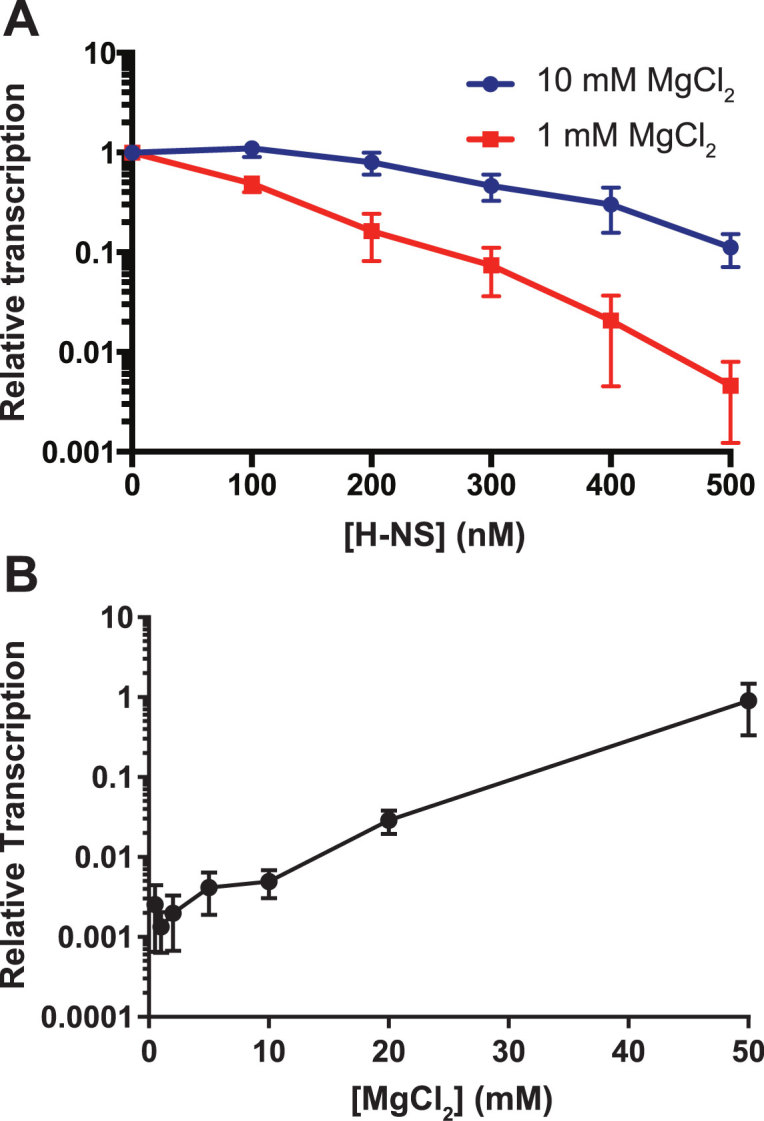
H-NS-mediated silencing is inhibited by increasing Mg2+ concentrations. (A) IVT was performed on pagC template with increasing concentrations of H-NS under either stiffening (1 mM MgCl2; red line) or bridging (10 mM MgCl2; blue line) conditions. Reactions are normalized to the 0 nM reaction. To determine if H-NS exhibits a binary response to Mg2+, IVT was performed on pagC template in the presence of 500nM H-NS and increasing concentrations of MgCl2 (B). Transcript quantities were normalized to an H-NS-free control reaction for each concentration of MgCl2 (see Supplementary Figure S3 for pre-normalization and control data). Data represent the mean ± SEM; n = 3.
Given these observations, the two-mode binding model (16) suggests that H-NS silencing activity should exhibit a binary response to increasing Mg2+ concentrations, transitioning between two relatively stable levels of activity at ∼5 mM Mg2+. To test this hypothesis, we performed IVT reactions on pagC in the presence of 500 nM H-NS over a series of Mg2+concentrations, ranging from 0.5 to 50 mM. Mg2+ was found to inhibit H-NS-mediated silencing in a continuous, linear manner, with silencing becoming undetectable at 50 mM MgCl2 (Figure 1B). This observation does not support a model in which Mg2+ promotes a switch from one binding mode to another. Furthermore, the effect of Mg2+ on transcriptional regulation is at least partially specific to H-NS, as RNAP did not exhibit the same Mg2+concentration-dependent response (Supplementary Figure S3).
Mg2+ concentration modulates H-NS binding affinity
We hypothesized that the Mg2+-dependent modulation of silencing could be due to a structural change associated with conversion to bridging mode, or alternatively, Mg2+ could be inhibiting DNA binding by H-NS. To analyze the effect of Mg2+ concentration on H-NS–DNA interactions, we employed DNase I footprinting and differential DNA footprint analysis (DDFA), a highly-sensitive and quantitative method that allows the detection of DNA structural changes that might be associated with specific binding modes. Performance of DDFA over a range of H-NS concentrations allowed determination of the binding affinity of H-NS for the pagC promoter region at single base-pair resolution (Figure 2A, B; Supplementary Figure S4). H-NS was observed to bind extensively to a region upstream of the pagC promoter, from position –139 to –12 relative to the transcriptional start site (TSS). High affinity binding sites, based on fractional occupancy at low (20 nM) H-NS concentrations, are clustered relatively distal to the promoter, with strongest binding observed at positions –139, –119 and –114, whereas more proximal protected sites, such as –48 and –34, exhibited lower affinity and were not bound by 20 nM H-NS. As H-NS concentrations increased, the distal H-NS binding sites became saturated with H-NS, followed by binding sites more proximal to the promoter. Notably, an analysis of the pagC promoter region using the Virtual Footprint program (www.prodoric.de/vfp) (28) indicated that the best fits to the H-NS consensus binding site are centered at positions –121, –134 and –141 (Supplementary Figure S5), overlapping our observed high affinity sites. These results suggest that that H-NS initially nucleates at the promoter-distal region between –139 and –119, then oligomerizes towards the pagC promoter, binding lower affinity sites to silence transcription. The promoter-distal site is likely to represent the initial binding site of a single H-NS dimer, as structural studies indicate that an H-NS dimer occupies approximately two turns of the DNA helix, or 21 bp (8).
Figure 2.

H-NS binding is inhibited by increasing Mg2+ concentrations. DNase I Differential DNA Footprint Analysis was performed on the pagC promoter region with increasing concentrations of H-NS under either stiffening (A; 1 mM MgCl2) or bridging (B; 10 mM MgCl2) conditions. Results are presented as DDFA plots, representing the difference in fluorescent peak height (relative fluorescence units; RFU) between the control and H-NS-bound samples at three different H-NS concentrations (20 nM; blue line, 100 nM; green line, and 500 nM; red line). The approximate position of nucleotides relative to the TSS is indicated on the horizontal axis. Data represent the mean ± SD; n = 3. Downward valleys are regions of protection from DNase I digestion, indicating protein binding, whereas upward peaks indicate regions of increased DNase I sensitivity, suggesting bending or distortion of the DNA duplex. See Supplementary Figure S4 for representative electropherograms. (C) The fractional protection of several bases (–139, –119, –60, –48, –25 and –12 relative to the TSS) was determined relative to the reaction conditions resulting in maximum protection (1000 nM H-NS and 1 mM MgCl2) and plotted for a range of H-NS concentrations in either 1 mM (red line) or 10 mM (blue line) MgCl2, indicating the approximate affinity of the interaction between each base and H-NS. (D) 50 mM MgCl2 completely inhibited H-NS binding. DNase I DDFA was performed on the pagC promoter region in the presence of 500 nM H-NS and either 1 mM (blue line) or 50 mM (red line) MgCl2.
At a concentration of 10 mM Mg2+, H-NS protected the same positions from DNase I digestion as observed in 1 mM Mg2+ (Figure 2B). However, affinity for H-NS was clearly reduced at the higher Mg2+ concentration (Figure 2C). Furthermore, the absence of any novel DNase I hypersensitive sites, as indicated by the peaks that are associated with DNA bending or distortion of the duplex (29,30), suggests that the DNA does not form structures unique to higher Mg2+ concentrations (Figure 2B). Rather, the general structure of the H-NS-bound pagC promoter complex appears to be similar under high and low Mg2+ concentrations. The difference in affinity is not an artifact resulting from altered DNase I activity, as DNase I control reactions did not exhibit significant differences when performed in either 1 or 10 mM Mg2+ (Supplementary Figure S6). Furthermore, as was observed in the IVT experiments, Mg2+-dependent modulation of affinity was continuous and non-binary, as H-NS binding was completely inhibited at 50 mM Mg2+ (Figure 2D; Supplementary Figure S7).
These results indicate that Mg2+ does not control a binding-mode switch, but rather inhibits DNA binding by H-NS, and that the degree of binding determines the structure of the local H-NS–DNA complex and its ability to impede transcription. High-affinity interactions (Figure 2C, positions –139, –119) appear to be inhibited to a greater degree than low-affinity interactions (Figure 2C, positions –60, –12). This suggests that more than one region of H-NS is involved in high affinity interactions with DNA, and that one of these regions interacts with, and is subsequently inhibited by, Mg2+. Furthermore, it also implies that this second region is unnecessary for low affinity interactions, which may promote bridging, and are unaffected by changes in Mg2+. However, our IVT data (Figure 1) suggest that these low affinity interactions are insufficient for silencing. In support of this, Gao et al. (31) have recently observed that both the DNA binding domain and the linker region are required for high affinity interactions with DNA. It is therefore plausible that Mg2+ interferes with the ability of the linker to support high-affinity interactions and the formation of stiffened filaments. Notably, the linker is rich in negatively-charged glutamate residues, which can facilitate Mg2+ binding (8), providing several potential Mg2+-binding sites. In particular, the E102 residue in the C-terminal DNA-binding domain undergoes a substantial chemical shift in response to DNA binding (4). Although E102 is not thought to be directly involved in DNA binding, it is conceivable that it coordinates Mg2+ binding and H-NS inhibition. Further investigation will be required to determine how the inhibition of H-NS binding occurs.
Binding mode is a function of H-NS concentration and affinity
To test the hypothesis that Mg2+ influences the affinity of the H-NS–DNA interaction rather than directly controlling the binding mode, we normalized the DDFA results to transcriptional silencing activity, rather than to H-NS concentration, under varying Mg2+ concentrations. Specifically, the structures of H-NS–DNA complexes exhibiting comparable levels of silencing in 1 or 10 mM MgCl2 were compared. Transcription of pagC is silenced 6-fold in 200 nM H-NS and 1 mM MgCl2, and 9-fold in 500 nM H-NS and 10 mM MgCl2, respectively (Figure 1A). A DDFA comparison of these two complexes failed to identify any significant structural differences in the H-NS–DNA complex (Supplementary Figure S8). This suggests that H-NS–DNA complexes with equivalent silencing activity are structurally similar, regardless of the Mg2+ concentration present.
This was corroborated using UV laser photo-crosslinking (32) and AFM of H-NS-pagC promoter complexes in 1 or 10 mM Mg2+. In UV laser photo-crosslinking, DNA is irradiated with brief (10 ns) pulses of UV irradiation at a wavelength of 266 nm, causing the formation of photo-crosslinks between adjacent thymidine residues in a structurally dependent manner, which can be analyzed via DDFA. This method is useful to detect alterations of DNA structure that result from protein binding. Target plasmid was incubated in the presence of increasing concentrations of H-NS in buffers containing 1 or 10 mM Mg2+, and the resulting complexes were photo-crosslinked (Figure 3; Supplementary Figure S9). In both the 1 and 10 mM reactions, three significant valleys were detectable at positions –139, –77 and –43, indicating that the H-NS induces similar structural changes to the DNA under both conditions. However, the magnitude of the peaks observed was smaller in 10 mM Mg2+, further supporting an inverse correlation between Mg2+ concentration and H-NS binding affinity.
Figure 3.

Local DNA structure is similar at low and high Mg2+ concentrations. UV laser Differential DNA Footprinting Analysis was performed on the pagC promoter region in increasing concentrations of H-NS under either stiffening (A; 1 mM MgCl2) or bridging (B; 10 mM MgCl2) conditions. Results are presented as DDFA plots, representing the difference in fluorescent peak height (relative fluorescence units; RFU) between control and H-NS-bound samples at three different H-NS concentrations (20 nM; blue line, 100 nM; green line and 500 nM; red line). The approximate position of cross-linked nucleotides relative to the TSS is indicated on the horizontal axis. Data represent the mean ± SD; n = 3. Significant cross-linking, suggestive of structural changes, is detectable at positions –139, –77 and –43. Representative electropherograms are shown in Supplementary Figure S7.
For AFM studies, a linearized version of the 2.7 kb pagC fragment was used to allow the appropriate orientation of the DNA and to identify the approximate location of pagC. H-NS-pagC complexes were formed with 200 and 800 nM H-NS in buffer containing either 1 or 10 mM Mg2+ (Figure 4A). In 1 mM Mg2+ and 200 nM H-NS, discrete H-NS-pagC complexes appear to adopt a bridged conformation, as the fragments are typically less than half their predicted length (∼610 nm) (Supplementary Figures S10 and S11). This is further supported by the presence of what appear to be segments of unbridged DNA within some complexes (Supplementary Figure S10A, right panel). This contradicts the biphasic model, which precludes the formation of a bridged complex in 1 mM Mg2+. However, in 800 nM H-NS, discrete H-NS-pagC complexes form filaments. In 10 mM Mg2+ and 200 nM H-NS, H-NS-pagC complexes form disorganized interwound or bridged structures. In support of our IVT and DDFA results, very little H-NS appears to bind under these conditions; the complex is predominantly naked DNA. However, it becomes saturated in 800 nM H-NS, forming a stiffened filament. Again, this observation contradicts the biphasic model. Given these observations, we conclude that our DDFA data at lower concentrations represent a mixture of bridging and stiffening interactions, transitioning to more stiffening interactions as the H-NS concentration increases, saturating the DNA.
Figure 4.

H-NS binding, but not binding mode, correlates with Mg2+ concentrations. The linearized 2.7 kb (∼610 nm) pagC region was incubated in the presence of 1 or 10 mM MgCl2, and 200 or 800 nM H-NS, at room temperature, and applied to glutaraldehyde-treated mica. H-NS-pagC complexes were then imaged by AFM in air. Representative discrete complexes are shown (A). At a concentration of 200 nM, which is sufficient for silencing (Figure 1), H-NS appears to form bridges in 1 mM MgCl2 (see Supplementary Figure S10 for additional images of the bridged complex, as well as the unbound DNA control), but stiffened filaments form at 800 nM H-NS. Similarly, in 10 mM MgCl2, H-NS binding is limited, but H-NS appears to form bridges when present at a concentration of 200 nM. However, filaments can be observed when the H-NS concentration is increased to 800 nM. Multimolecular aggregates, suggestive of bridging, can be observed under all binding conditions, but appear to be largest in 1 mM MgCl2 and 800 nM H-NS (B). Observed binding modes are scored in Supplementary Figure S11. Representative aggregates are shown for all conditions in Supplementary Figure S12A. The diameters of observed aggregates, which are reflective of H-NS binding and oligomerization, are indicated in Supplementary Figure S12B.
Under all of the conditions assayed above, disordered aggregates of H-NS and DNA were also observed (Figure 4B; Supplementary Figure S12). Because these aggregates consist of multiple DNA molecules, they must be the product of intra- and inter-molecular bridging interactions, as the stiffening mode would not promote the formation of such complexes. Although the exact sizes of the aggregates are difficult to accurately quantify using these methods, their diameters appear to correlate with affinity as predicted under our model (Supplementary Figure S12B). Aggregates progressively increase in size from 10 mM Mg2+ and 200 nM H-NS, up to 1 mM Mg2+ and 800 nM H-NS, exhibiting the strongest binding under the latter conditions. We suggest that this reflects the dynamic nature of H-NS binding. When H-NS concentrations are high, an isolated DNA molecule will form a filament as it becomes saturated with H-NS. However, multiple DNA molecules will decrease the effective H-NS concentration, promoting bridging and the formation of aggregates. Previous magnetic tweezer experiments failed to observe aggregation because those assays contained a single DNA molecule (16), driving the complex to form a filament.
To determine whether this aggregation was a product of H-NS–DNA interactions or H-NS self-association, we performed light scattering analysis of H-NS–DNA complexes (Figure 5A; Supplementary Figure S13). The 2.7 kb pagC region was incubated in the presence of 800 nM H-NS and either 1 or 50 mM MgCl2, the latter of which is sufficient to inhibit H-NS binding. Significant light scattering at 280 nm (Figure 5; Supplementary Figure S13) was detectable in samples containing DNA, H-NS and 1 mM MgCl2. However, light scattering was inhibited by 50 mM MgCl2. Aggregation is not due to H-NS self-association, as H-NS had no effect on light scattering in the absence of DNA, indicating that H-NS oligomerization is dependent on DNA binding and is inhibited by MgCl2. We then used fluorescence anisotropy to determine whether MgCl2 inhibits the H-NS–DNA interaction itself, or the oligomerization of H-NS bound to DNA (Figure 5B). From our DNase I DDFA and Virtual Footprint data, we identified a 36 bp region centered at position –132 (Supplementary Figure S5) which binds H-NS with high affinity. Because structural data suggest that an H-NS dimer occupies >20 bp upon binding DNA (8), this target should accommodate only a single H-NS dimer and should not support significant oligomerization. We observed a direct relationship between the anisotropy of this fragment and the concentration of H-NS, indicating the formation of an H-NS–DNA complex. The change in anisotropy was inhibited by 10 mM MgCl2, indicating that Mg2+ directly inhibits the H-NS–DNA interaction.
Figure 5.

H-NS-mediated aggregation is dependent on DNA binding, which is inhibited by Mg2+. The linearized 2.7 kb pagC region was incubated in the presence of 800 nM H-NS and either 1 or 50 mM MgCl2. Light scattering, which is indicative of aggregate formation, was measured at 280 nm (A). An increase in light scattering was detected in samples containing both H-NS and DNA at 1 mM MgCl2. However, a significant increase in light scattering was not detected in 50 mM MgCl2, a concentration sufficient to inhibit DNA binding. This indicates that aggregation requires DNA binding, which is inhibited by MgCl2. Data represent the mean ± SD; n ≥ 5. P-values are indicated above each pair of samples. To confirm that MgCl2 inhibits DNA binding directly, fluorescence anisotropy was performed using a 36bp target containing a high affinity H-NS binding site (B). 6-FAM-labeled DNA was incubated in the presence of increasing concentrations of H-NS and 1 or 10 mM MgCl2, as indicated, and anisotropy, which is indicative of H-NS binding, was measured. Anisotropy is significantly decreased at 10 mM MgCl2, indicating that MgCl2 directly inhibits the H-NS–DNA interaction. Data represent the mean ± SD of three independent experiments, each consisting of three technical replicates. The anisotropy of the reaction buffer containing 1 mM MgCl2 is subtracted from all samples to correct for background fluorescence.
These observations were unexpected in view of the recently proposed models for H-NS–DNA interactions. However, several observations in the literature support the hypothesis that the higher-order structure of the H-NS–DNA complex is influenced by both DNA binding affinity and local H-NS concentration. An earlier biochemical analysis of H-NS (33) demonstrated that at low concentrations, H-NS constrains supercoils in plasmid DNA, suggestive of DNA bridging. However, as the H-NS concentration increased, the entire plasmid was bound and supercoils were no longer constrained, suggesting a transition to the stiffening mode. More recently, H-NS–DNA complexes were observed to switch from bridging to stiffening at increasing H-NS concentrations, even in the presence of 10 mM Mg2+ (21). Taken together with our present findings, these observations suggest that the observed switch between binding modes is not directly dependent on divalent cation concentration, but rather is a complex function of both the affinity of H-NS–DNA interactions and local H-NS concentrations (the number of H-NS molecules bound to a specific segment of DNA). As the affinity of H-NS–DNA interactions decreases, fewer H-NS molecules bind DNA, and those that do bind are isolated, without local interaction partners. Such isolated H-NS molecules must interact in trans with distant partners to form bridges. A similar model was recently proposed by Joyeux (34), who used computational modeling to analyze the interaction between H-NS and the bacterial chromosome in response to varying cation concentrations. That study proposed that divalent cations condense on the polyanionic phosphate backbone to inhibit H-NS–DNA interactions, and that increasing cation concentrations indirectly promote H-NS bridging interactions by reducing the affinity of DNA binding. Transcriptional silencing is also not directly associated with one binding mode or another per se, but rather, correlates with the degree of binding, which is greater under conditions associated with stiffening. It is important to note that free intracellular Mg2+ concentrations are tightly controlled by extracellular Mg2+-uptake systems: in Salmonella these consist of CorA, MgtA and MgtB (35,36). Free [Mg2+] may vary by as little as 2-fold, irrespective of the magnitude of fluctuations in extracellular Mg2+ (19), which our observations suggest would result in a roughly two-fold change in H-NS activity. This limited effect makes it unlikely that Mg2+ plays a significant direct regulatory role. We suggest instead that the previously-reported Mg2+-effect is a proxy for the affinity of the H-NS–DNA interaction, allowing us to probe the impact of affinity on H-NS–DNA binding, structure and activity.
Although previous studies suggest that the cytoplasmic concentration of H-NS is approximately 13 μM (37), which should be sufficient to promote filament formation, H-NS is unlikely to be homogeneously distributed throughout the cell. Computational studies predict the formation of 3D aggregates (34), similar to the complexes described here. Although chromosomal conformation studies have failed to identify H-NS-dependent pairwise interactions between distant bound loci (38), H-NS-bound regions may still co-associate in a less organized manner. Multiple studies have described the formation of distinct H-NS-associated foci in a growth rate- and phase-dependent manner (31,39,40). Therefore, local H-NS concentrations are likely to be variable throughout the nucleoid, and both binding modes are likely to occur in the cell. This suggests a basis for the role of H-NS in organizing higher-order bacterial chromatin structure, as less densely-bound regions may not have direct regulatory importance but might form bridges to condense the bacterial nucleoid (39,41,42). Other physiological stimuli that are known to impact H-NS activity, such as pH, temperature and osmolarity (43–45), may similarly modulate H-NS binding. Notably, alkaline pH and elevated temperatures have also been observed to promote bridging (16). It seems likely that these conditions are acting by reducing the affinity of H-NS–DNA interactions, allowing H-NS to influence bacterial chromatin structure and global gene expression in response to numerous environmental signals.
Supplementary Material
ACKNOWLEDGEMENTS
We thank Dr. Micah Glaz for technical assistance with the AFM experiments, Drs. Peter Brzovic and Lisa Tuttle for helpful discussions and Dr. Geoffrey Baird and Jacob Cofferen for their assistance using the Tecan Safire II.
SUPPLEMENTARY DATA
Supplementary Data are available at NAR Online.
FUNDING
National Institutes of Health [AI101084 and AI118962 to F.C.F.]; Molecular Analysis Facility, a National Nanotechnology Coordinated Infrastructure site at the University of Washington which is supported in part by the National Science Foundation [ECC-1542101]; University of Washington, the Molecular Engineering & Sciences Institute, the Clean Energy Institute; National Institutes of Health. Funding for open access charge from the National Institutes of Health.
Conflict of interest statement. None declared.
REFERENCES
- 1. Navarre W.W., Porwollik S., Wang Y., McClelland M., Rosen H., Libby S.J., Fang F.C.. Selective silencing of foreign DNA with low GC content by the H-NS protein in Salmonella. Science. 2006; 313:236–238. [DOI] [PubMed] [Google Scholar]
- 2. Lucchini S., Rowley G., Goldberg M.D., Hurd D., Harrison M., Hinton J.C.. H-NS mediates the silencing of laterally acquired genes in bacteria. PLoS Pathog. 2006; 2:e81. [DOI] [PMC free article] [PubMed] [Google Scholar]
- 3. Will W.R., Navarre W.W., Fang F.C.. Integrated circuits: how transcriptional silencing and counter-silencing facilitate bacterial evolution. Curr. Opin. Microbiol. 2015; 23:8–13. [DOI] [PMC free article] [PubMed] [Google Scholar]
- 4. Gordon B.R., Li Y., Cote A., Weirauch M.T., Ding P., Hughes T.R., Navarre W.W., Xia B., Liu J.. Structural basis for recognition of AT-rich DNA by unrelated xenogeneic silencing proteins. Proc. Natl. Acad. Sci. U.S.A. 2011; 108:10690–10695. [DOI] [PMC free article] [PubMed] [Google Scholar]
- 5. Stella S., Spurio R., Falconi M., Pon C.L., Gualerzi C.O.. Nature and mechanism of the in vivo oligomerization of nucleoid protein H-NS. EMBO J. 2005; 24:2896–2905. [DOI] [PMC free article] [PubMed] [Google Scholar]
- 6. Esposito D., Petrovic A., Harris R., Ono S., Eccleston J.F., Mbabaali A., Haq I., Higgins C.F., Hinton J.C., Driscoll P.C. et al. H-NS oligomerization domain structure reveals the mechanism for high order self-association of the intact protein. J. Mol. Biol. 2002; 324:841–850. [DOI] [PubMed] [Google Scholar]
- 7. Leonard P.G., Ono S., Gor J., Perkins S.J., Ladbury J.E.. Investigation of the self-association and hetero-association interactions of H-NS and StpA from Enterobacteria. Mol. Microbiol. 2009; 73:165–179. [DOI] [PubMed] [Google Scholar]
- 8. Arold S.T., Leonard P.G., Parkinson G.N., Ladbury J.E.. H-NS forms a superhelical protein scaffold for DNA condensation. Proc. Natl. Acad. Sci. U.S.A. 2010; 107:15728–15732. [DOI] [PMC free article] [PubMed] [Google Scholar]
- 9. Grainger D.C. Structure and function of bacterial H-NS protein. Biochem. Soc. Trans. 2016; 44:1561–1569. [DOI] [PubMed] [Google Scholar]
- 10. Bloch V., Yang Y., Margeat E., Chavanieu A., Augé M.T., Robert B., Arold S., Rimsky S., Kochoyan M.. The H-NS dimerization domain defines a new fold contributing to DNA recognition. Nat. Struct. Biol. 2003; 10:212–218. [DOI] [PubMed] [Google Scholar]
- 11. Cerdan R., Bloch V., Yang Y., Bertin P., Dumas C., Rimsky S., Kochoyan M., Arold S.T.. Crystal structure of the N-terminal dimerisation domain of VicH, the H-NS-like protein of Vibrio cholerae. J. Mol. Biol. 2003; 334:179–185. [DOI] [PubMed] [Google Scholar]
- 12. Will W.R., Bale D.H., Reid P.J., Libby S.J., Fang F.C.. Evolutionary expansion of a regulatory network by counter-silencing. Nat. Commun. 2014; 5:5270. [DOI] [PMC free article] [PubMed] [Google Scholar]
- 13. Dame R.T., Wyman C., Goosen N.. H-NS mediated compaction of DNA visualised by atomic force microscopy. Nucleic Acids Res. 2000; 28:3504–3510. [DOI] [PMC free article] [PubMed] [Google Scholar]
- 14. Dame R.T., Noom M.C., Wuite G.J.. Bacterial chromatin organization by H-NS protein unravelled using dual DNA manipulation. Nature. 2006; 444:387–390. [DOI] [PubMed] [Google Scholar]
- 15. Amit R., Oppenheim A.B., Stavans J.. Increased bending rigidity of single DNA molecules by H-NS, a temperature and osmolarity sensor. Biophys. J. 2003; 84:2467–2473. [DOI] [PMC free article] [PubMed] [Google Scholar]
- 16. Liu Y., Chen H., Kenney L.J., Yan J.. A divalent switch drives H-NS/DNA-binding conformations between stiffening and bridging modes. Genes Dev. 2010; 24:339–344. [DOI] [PMC free article] [PubMed] [Google Scholar]
- 17. Moncany M.L., Kellenberger E.. High magnesium content of Escherichia coli B. Experientia. 1981; 37:846–847. [DOI] [PubMed] [Google Scholar]
- 18. Alatossava T., Jütte H., Kuhn A., Kellenberger E.. Manipulation of intracellular magnesium content in polymyxin B nonapeptide-sensitized Escherichia coli by ionophore A23187. J. Bacteriol. 1985; 162:413–419. [DOI] [PMC free article] [PubMed] [Google Scholar]
- 19. Froschauer E.M., Kolisek M., Dieterich F., Schweigel M., Schweyen R.J.. Fluorescence measurements of free [Mg2+] by use of mag-fura 2 in Salmonella enterica. FEMS Microbiol. Lett. 2004; 237:49–55. [DOI] [PubMed] [Google Scholar]
- 20. Lim C.J., Lee S.Y., Kenney L.J., Yan J.. Nucleoprotein filament formation is the structural basis for bacterial protein H-NS gene silencing. Sci. Rep. 2012; 2:509. [DOI] [PMC free article] [PubMed] [Google Scholar]
- 21. Kotlajich M.V., Hron D.R., Boudreau B.A., Sun Z., Lyubchenko Y.L., Landick R.. Bridged filaments of histone-like nucleoid structuring protein pause RNA polymerase and aid termination in bacteria. Elife. 2015; 4:e04970. [DOI] [PMC free article] [PubMed] [Google Scholar]
- 22. Perez J.C., Latifi T., Groisman E.A.. Overcoming H-NS-mediated transcriptional silencing of horizontally acquired genes by the PhoP and SlyA proteins in Salmonella enterica. J. Biol. Chem. 2008; 283:10773–10783. [DOI] [PMC free article] [PubMed] [Google Scholar]
- 23. Wang R.F., Kushner S.R.. Construction of versatile low-copy-number vectors for cloning, sequencing and gene expression in Escherichia coli. Gene. 1991; 100:195–199. [PubMed] [Google Scholar]
- 24. Aparicio O., Geisberg J.V., Sekinger E., Yang A., Moqtaderi Z., Struhl K.. Chromatin immunoprecipitation for determining the association of proteins with specific genomic sequences in vivo. Curr. Protoc. Mol. Biol. 2005; doi:10.1002/0471143030.cb1707s23. [DOI] [PubMed] [Google Scholar]
- 25. Shlyakhtenko L.S., Gall A.A., Lyubchenko Y.L.. Mica functionalization for imaging of DNA and protein-DNA complexes with atomic force microscopy. Methods Mol. Biol. 2013; 931:295–312. [DOI] [PMC free article] [PubMed] [Google Scholar]
- 26. Wang H., Bash R., Yodh J.G., Hager G.L., Lohr D., Lindsay S.M.. Glutaraldehyde modified mica: a new surface for atomic force microscopy of chromatin. Biophys. J. 2002; 83:3619–3625. [DOI] [PMC free article] [PubMed] [Google Scholar]
- 27. van der Maarel J.R., Guttula D., Arluison V., Egelhaaf S.U., Grillo I., Forsyth V.T.. Structure of the H-NS–DNA nucleoprotein complex. Soft Matter. 2016; 12:3636–3642. [DOI] [PubMed] [Google Scholar]
- 28. Münch R., Hiller K., Grote A., Scheer M., Klein J., Schobert M., Jahn D.. Virtual Footprint and PRODORIC: an integrative framework for regulon prediction in prokaryotes. Bioinformatics. 2005; 21:4187–4189. [DOI] [PubMed] [Google Scholar]
- 29. Drew H.R., Travers A.A.. DNA structural variations in the E. coli tyrT promoter. Cell. 1984; 37:491–502. [DOI] [PubMed] [Google Scholar]
- 30. Suck D., Lahm A., Oefner C.. Structure refined to 2A of a nicked DNA octanucleotide complex with DNase I. Nature. 1988; 332:464–468. [DOI] [PubMed] [Google Scholar]
- 31. Gao Y., Foo Y.H., Winardhi R.S., Tang Q., Yan J., Kenney L.J.. Charged residues in the H-NS linker drive DNA binding and gene silencing in single cells. Proc. Natl. Acad. Sci. U.S.A. 2017; 114:12560–12565. [DOI] [PMC free article] [PubMed] [Google Scholar]
- 32. Buckle M., Geiselmann J., Kolb A., Buc H.. Protein-DNA cross-linking at the lac promoter. Nucleic Acids Res. 1991; 19:833–840. [DOI] [PMC free article] [PubMed] [Google Scholar]
- 33. Tupper A.E., Owen-Hughes T.A., Ussery D.W., Santos D.S., Ferguson D.J., Sidebotham J.M., Hinton J.C., Higgins C.F.. The chromatin-associated protein H-NS alters DNA topology in vitro. EMBO J. 1994; 13:258–268. [DOI] [PMC free article] [PubMed] [Google Scholar]
- 34. Joyeux M. Role of salt valency in the switch of H-NS proteins between DNA-bridging and DNA-stiffening modes. Biophys. J. 2018; 114:1–9. [DOI] [PMC free article] [PubMed] [Google Scholar]
- 35. Smith R.L., Maguire M.E.. Microbial magnesium transport: unusual transporters searching for identity. Mol. Microbiol. 1998; 28:217–226. [DOI] [PubMed] [Google Scholar]
- 36. Snavely M.D., Florer J.B., Miller C.G., Maguire M.E.. Magnesium transport in Salmonella typhimurium: 28Mg2+ transport by the CorA, MgtA, and MgtB systems. J. Bacteriol. 1989; 171:4761–4766. [DOI] [PMC free article] [PubMed] [Google Scholar]
- 37. Azam T.A., Ishihama A.. Twelve species of the nucleoid-associated protein from Escherichia coli. Sequence recognition specificity and DNA binding affinity. J Biol Chem. 1999; 274:33105–33113. [DOI] [PubMed] [Google Scholar]
- 38. Cagliero C., Grand R.S., Jones M.B., Jin D.J., O'Sullivan J.M.. Genome conformation capture reveals that the Escherichia coli chromosome is organized by replication and transcription. Nucleic Acids Res. 2013; 41:6058–6071. [DOI] [PMC free article] [PubMed] [Google Scholar]
- 39. Wang W., Li G.W., Chen C., Xie X.S., Zhuang X.. Chromosome organization by a nucleoid-associated protein in live bacteria. Science. 2011; 333:1445–1449. [DOI] [PMC free article] [PubMed] [Google Scholar]
- 40. Liu Y., Xie P., Wang P., Li M., Li H., Li W., Dou S.. A model for chromosome organization during the cell cycle in live E. coli. Sci. Rep. 2015; 5:17133. [DOI] [PMC free article] [PubMed] [Google Scholar]
- 41. Spassky A., Rimsky S., Garreau H., Buc H.. H1a, an E. coli DNA-binding protein which accumulates in stationary phase, strongly compacts DNA in vitro. Nucleic Acids Res. 1984; 12:5321–5340. [DOI] [PMC free article] [PubMed] [Google Scholar]
- 42. Spurio R., Dürrenberger M., Falconi M., La Teana A., Pon C.L., Gualerzi C.O.. Lethal overproduction of the Escherichia coli nucleoid protein H-NS: ultramicroscopic and molecular autopsy. Mol. Gen. Genet. 1992; 231:201–211. [DOI] [PubMed] [Google Scholar]
- 43. Atlung T., Ingmer H.. H-NS: a modulator of environmentally regulated gene expression. Mol. Microbiol. 1997; 24:7–17. [DOI] [PubMed] [Google Scholar]
- 44. McLeod S.M., Johnson R.C.. Control of transcription by nucleoid proteins. Curr. Opin. Microbiol. 2001; 4:152–159. [DOI] [PubMed] [Google Scholar]
- 45. Williams R.M., Rimsky S.. Molecular aspects of the E. coli nucleoid protein, H-NS: a central controller of gene regulatory networks. FEMS Microbiol. Lett. 1997; 156:175–185. [DOI] [PubMed] [Google Scholar]
Associated Data
This section collects any data citations, data availability statements, or supplementary materials included in this article.