

Abstract
The environmental aspects of ore processing and waste treatment call for an optimization of applied technologies. There, understanding of the structure and complexation mechanism on a molecular scale is indispensable. Here, the complexation of UVI with a calix[4]arene‐based 8‐hydroxyquinoline ligand was investigated by applying a wide range of complementary methods. In solution, the formation of two complex species was proven with stability constants of log ß 1:1=5.94±0.02 and log ß 2:1=6.33±0.01, respectively. The formation of the 1:1 complex was found to be enthalpy driven [ΔH 1:1=(−71.5±10.0) kJ mol−1; TΔS 1:1=(−37.57±10.0) kJ mol−1], whereas the second complexation step was found to be endothermic and entropy driven [ΔH 2:1=(32.8±4.0) kJ mol−1; TΔS 2:1=(68.97±4.0) kJ mol−1]. Moreover, the molecular structure of [UO2(H6L)(NO3)](NO3) (1) was determined by single‐crystal X‐ray diffraction. Concluding, radiotoxic UVI was separated from a EuIII‐containing solution by the calix[4]arene‐based ligand in solvent extractions.
Keywords: calixarenes, chelates, liquid–liquid extraction, uranium, UV/Vis spectroscopy
1. Introduction
Solvent extraction has proved to be an important technique in ore processing and waste treatment.1, 2 Additionally, it is suitable for the recovery of industrially relevant rare‐earth concentrates from radiotoxic elements.3, 4 In this context, Zhu et al. reviewed current technical procedures.5 For example, acidic organophosphorus extractants, such as di(2‐ethylhexyl)phosphoric acid (D2EHPA) and 2‐ethylhexylphosphoric acid mono‐2‐ethylhexyl ester (EHEHPA), are very efficient for uranium separation, but stripping is difficult. Moreover, Cyanex 272 and tri‐n‐butyl phosphate (TBP) enable the extraction of UVI from rare‐earth concentrates.6 Also, studies on tertiary amine Alamine 336 indicate its suitability for this separation problem.5, 7
Primarily, the efficiency and selectivity of extracting agents are driven by structural properties. Thus, on the basis of their modifiability and variable solubility, calix[n]arenes are promising compounds for the extraction of metals.8, 9, 10, 11, 12, 13, 14, 15 Various calix‐ [n]arenes with sufficiently high affinity towards actinides and lanthanides are already known.9, 10, 11, 16, 17, 18, 19, 20, 21, 22 These chalice‐like macrocyclic molecules consist of para‐substituted phenolic units ranging from 4 to 20. The best‐investigated calix[n]arenes possess four to eight aromatic units. By changing the number of these aromatic units, the cavity size for intercalation of a metal ion can be adapted.23, 24, 25, 26 The selectivity towards certain metal ions is greatly improved by the possibility to derivatize the para substituents and the hydroxy groups.23, 24, 26 However, owing to high process costs, calix[n]arenes currently do not find application in separation technologies. Thus, the development of calix[n]arenes that allow a separation process that is more cost efficient and environmentally friendly than the previously known methods is still a challenging task. For this purpose, in the first step it is necessary to understand the binding mechanisms between the calix[n]arenes and the metal ion, which in turn govern the thermodynamic stability of the formed complexes and, consequently, the selectivity and sensitivity.
In this context, a new tert‐butylcalix[4]arene‐based 8‐hydroxyquinoline ligand (Scheme 1)—termed H6L for brevity throughout this text—was recently synthesized and investigated for complexation with trivalent lanthanides.9 Two 8‐hydroxyquinoline‐2‐carbaldehyde units are connected through hydrazone–carbonylmethoxy linkages in a 1,3‐distal arrangement to the lower rim of the macrocycle. Europium coordinates by the O‐ and N‐donor atoms of the quinoline and carbonyl–hydrazone unit of H6L. Furthermore, Jäschke et al. described the extractability of EuIII and TbIII by H6L at pH 7–8.9 Additionally, H6L is expected to be an oriented ligand for uranyl, as the high affinity of 8‐hydroxyquinoline towards this radiotoxic element was described by Mirzaei et al.27 Moreover, in recent years good extraction properties of 8‐hydroxyquinoline towards f‐block elements have been described.28, 29, 30, 31 Thus, H6L appears to be a promising extracting agent for the separation of UVI from rare‐earth concentrates of leached ores.
Scheme 1.

Synthesis of the mononuclear complex [UO2(H6L)(NO3)](NO3) (1) starting from calix[4]arene‐based 8‐hydroxyquinoline ligand H6L.
Uranium poses problems not only in the context of waste from nuclear power production but also in rare‐earth production, as it is one of the undesired constituents of rare‐earth ores.5 On the other side, uranium is an important raw material.32 In addition to the radiotoxicity of all its isotopes, the element is also a heavy metal with all associated chemotoxic hazards to the liver, kidney, and skeleton.33, 34, 35, 36, 37 During any processing of uranium, its uncontrolled release into the environment has to be minimized. Thus, in the context of rare‐earth production, the separation of uranium facilitates sustainable production and can additionally provide uranium as a limited resource.5, 38, 39
For hexavalent uranium occurring as uranyl, it is known from the literature that it forms complexes with O‐ and N‐donor ligands. For a better understanding of its extraction behavior and the development of effective separation systems, it is indispensable to clarify the complexation mechanisms by which uranium interacts with the tert‐butylcalix[4]arene‐based 8‐hydroxyquinoline ligand (i.e., H6L) on a molecular level. This may eventually lead to modification of extractant molecules to enhance selectivity and efficiency. Furthermore, a thorough thermodynamic description of the complexation may pave the way to the development of future industrial applications.
The present work investigates the interaction between uranyl nitrate and H6L by a variety of spectroscopic methods. In a first step, the complexes formed between uranyl nitrate and H6L were identified. Their stability constants were determined from spectrophotometric titrations, whereas their enthalpies and entropies were provided by isothermal titration calorimetry (ITC). The binding behavior and existence of co‐ligands were clarified by electrospray ionization time‐of‐flight mass spectrometry (ESI‐TOF MS) and single‐crystal X‐ray diffraction (SC‐XRD). The results were finally verified by comparison with results from density functional theory computations (DFT). Auxiliary information was also obtained from attenuated total reflection (ATR) FTIR spectroscopy measurements.
The complexation equilibrium studies were performed in acetonitrile as a representative aprotic solvent with the advantage of sufficient solubility of the calix[4]arene‐based ligand, the metal salts, and the as‐formed complex species. During the measurements, acetonitrile was photochemically stable and no absorption in the excitation area or disturbing background fluorescence was observed. The concentrations of the ligand and metal salt were chosen with respect to the applied analytical methods.
Finally, liquid–liquid extraction studies were performed to investigate the feasibility of selective extraction of UVI from a lanthanide‐containing solution. As a representative lanthanide, EuIII was used. The expected contamination of rare‐earth concentrates of leached ores with uranium is comparatively weak (10−5 m). Hence, concentration ranges of 10−5 to 10−3 m were applied. Possible mechanisms for the selective extraction behavior are also discussed.
2. Results and Discussion
2.1. UV/Vis Spectroscopy: Identification of Species and Determination of Stability Constants
The addition of UO2(NO3)2 ⋅6 H2O to a H6L solution led to a reddish coloring of the solution. Figure 1 shows the change in the UV/Vis absorption spectra upon increasing the concentration of uranyl nitrate. The spectrum of H6L (black line) is characterized by a strong band with a maximum at λ=281 nm and a weak band with a maximum at λ=319 nm attributed to π→π* and n→π* transitions in the heterocyclic units.9 An additional strong absorption band at λ=200 nm, resulting from π→π* transitions of the calix[4]arene backbone, is not influenced by complexation processes and is, consequently, not shown in Figure 1. Upon increasing the uranyl nitrate concentration, the band at λ=281 nm decreases and disappears after the addition of 2 equivalents of uranyl nitrate. Moreover, the band at λ=319 nm becomes slightly shifted (hypsochromic), and a new broad absorption band (λ=350–370 nm) appears, which indicates the involvement of the heteroaromatic unit in the binding process. The coordination of the 8‐hydroxyquinoline unit could also be inferred by ATR FTIR spectroscopy (Figure S7 in the Supporting Information).
Figure 1.

UV/Vis spectra of 12.5 μm (left)/50 μm (right) H6L in acetonitrile as a function of the UO2(NO3)2 ⋅6 H2O concentration (ionic strength, I=0.01 m NaClO4).
The intense reddish coloration is primarily related to the broad absorption band at λ=520 nm (Figure 1) with a molar extinction coefficient (ϵ) of 3200 L mol−1 cm−1. Up to the addition of 1 equivalent of UO2(NO3)2 ⋅6 H2O, the absorption maximum is located at λ=511 nm. Upon adding up to 2 equivalents of the metal salt, this band becomes bathochromically shifted to λ=520 nm (Figure S1). The position and width of this band in addition to the high extinction coefficient are characteristic of charge‐transfer transitions.40 After the addition of more than 2 equivalents of UO2(NO3)2 ⋅6 H2O, no further changes in the absorption are observed at λ=520 nm (Figure 2). This suggests that a 2:1 uranyl H6L species is the limiting complex under the described conditions.
Figure 2.

Change in the absorption of H6L upon increasing the concentration of UO2(NO3)2 ⋅6 H2O in acetonitrile at λ=520 nm (I=0.01 m NaClO4) (left). Distribution of the H6L species as a function of the number of equivalents UO2(NO3)2 ⋅6 H2O. H6L=12.5 μm; I=0.01 m NaClO4 (right).
An increase in one absorption band up to the addition of 2 equivalents of UO2(NO3)2 ⋅6 H2O suggests complexation of both uranyl ions through the same binding motif. However, further conclusions regarding the exact binding mode of H6L could not be drawn from the spectroscopic data. Hence, X‐ray crystallographic study of the 1:1 complex species [UO2(H6L)(NO3)](NO3)⋅6 MeCN (1⋅6 MeCN, Scheme 1), was undertaken. The results of the single‐crystal X‐ray diffraction analysis of the mononuclear complex (see below) evidence that uranium forms a chelate complex with the carbonyl–hydrazone‐8‐hydroxyquinoline unit of H6L.
Nevertheless, factor analysis of the absorption spectra by the HypSpec program affirms the presence of three absorption species, that is, free H6L and two successive uranyl H6L complexes. Further, the conditional stability constants of the 1:1 and 2:1 complexes (log ß 1:1=5.94±0.02; log ß 2:1=6.33±0.01) were determined by fitting the data with HypSpec. Due to the strong chelate effect of H6L, these values are higher than those of a uranyl complex of a calix[6]arene with two dibutylphosphinylmethoxy groups at the lower rim (log K=3.6, in acetonitrile).41 Moreover, applying these data, the species distribution shown in Figure 2 could be derived. As already observed in the literature for other systems,42, 43, 44 the shift in the isosbestic point from λ=297 to 303 nm (Figure 3) also indicates the formation of two different complexes during the addition of UO2(NO3)2 ⋅6 H2O. An isosbestic point at λ=297 nm appears up to the addition of 1 equivalent of the metal salt. Up to the addition of 6 equivalents of the metal salt, an isosbestic point is observed at λ=303 nm.
Figure 3.
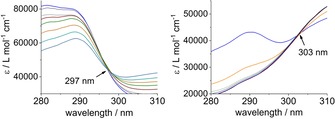
Isosbestic point observed up to the addition of 1 equivalent (left) and 6 equivalents (right) of UO2(NO3)2 ⋅6 H2O.
Additionally, Job's method was applied to evaluate the binding stoichiometry (see the Supporting Information). The absorption plotted as a function of the mole fraction of H6L (Figure S3) suggests the formation of only the 2:1 species. A limitation of the Job's method, namely, that the experimentally observed maxima in the Job plot for various cases of dynamic equilibria of more than one species may not give the “expected” value, was recently described.45, 46
2.2. Electrospray Ionization Time‐of‐Flight Mass Spectrometry (ESI‐TOF): Presence of Co‐Ligands
To estimate the existence of co‐ligands such as nitrate ions, the ESI‐TOF mass spectra of acetonitrile/methanol solutions containing UO2(NO3)2 ⋅6 H2O and H6L (2:1 molar ratio) were recorded. Primarily, both the free ligand and the 2:1 complex are detected by mass spectrometry (Figure S9) at m/z=1101.6 and 1763.6, respectively. Further, small amounts of the 1:1 complex (m/z=1434.6, [UO2(H5L)(NO3)+H+]+) are also observed. In addition, several low abundance signals are detected, and they are attributed to ions resulting from in‐source fragmentation events such as the loss of nitric acid or the 8‐hydroxyquinoline functionality from the precursor ion. Generally, it could be shown that each uranyl ion is still coordinated by one nitrate anion upon complexation by the calix[4]arene‐based ligand. Moreover, the mass found for the 1:1 complex [UO2(H5L)(NO3)] indicates that the coordinating arm is singly deprotonated.
2.3. Isothermal Titration Calorimetry (ITC): Determination of Enthalpy
To confirm the results of the UV/Vis spectrophotometric titrations, ITC measurements were performed under the same experimental conditions. Figure 4 shows a representative titration of H6L with UO2(NO3)2 ⋅6 H2O. Upon adding the metal salt to the H6L solution, the heat is absorbed or generated as a result of the interaction. Positive spikes in the signal represent an exothermic reaction (Figure 4, top). After integrating the heat as a function of the molar ratio between H6L and UO2(NO3)2 ⋅6 H2O, the titration curve is corrected for the dilution (Figure 4, bottom).
Figure 4.

Representative calorimetric titration of 100 μm H6L with 5 mm UO2(NO3)2 ⋅6 H2O in acetonitrile (I=0.01 m NaClO4). The top figure is a thermogram of the titration that is uncorrected for dilution heats. The bottom figure shows the integrated (points) and fitted (red line) binding enthalpies (left y axis) and the distribution of H6L species [right y axis, ligand H6L (black), 1:1 uranyl H6L complex (blue), and 2:1 uranyl H6L complex (orange)] as a function of molar ratio.
The reaction heats were used, in conjunction with a stoichiometry of 2:1 for uranyl H6L and the stability constants obtained by spectrophotometric titration, to determine the enthalpy of complexation with the software CHASM‐TA (Bio‐Lewis, Mississippi State University).47 The corresponding entropies of complexation were obtained from the relationship [Eq. (1)]:
| (1) |
in which R is the gas constant (8.314 J K−1 mol−1) and T is the temperature at which the measurements were performed, expressed in Kelvin.
The results suggest that the coordination of the first uranyl ion is exothermic and enthalpy driven [ΔH 1:1=(−71.5±10.0) kJ mol−1; TΔS 1:1=(−37.57±10.0) kJ mol−1]. The complexation of the second uranyl ion requires heat absorption and is entropy driven [ΔH 2:1=(32.8±4.0) kJ mol−1; TΔS 2:1=(68.97±4.0) kJ mol−1]. The positive entropy of coordination for the second uranyl ion can be caused by the release of nitrate ions and hydration water from UO2(NO3)2 ⋅6 H2O.48, 49, 50 The reorganization of acetonitrile around the complex can also contribute to an increase in the entropy.48 The entropy value should also be positive in the complexation of the first uranyl ion. Instead, the opposite trend in TΔS is observed. Schmidtchen described the occurrence of negative entropies in connection with a high ordering effect that strives for a well‐structured complex.51 Mirzaei et al. already described the initiation of stacking interactions between uranyl–hydroxyquinoline complexes.27 However, only the observed 1:1 solid‐state complex described in the following section indicates the occurrence of π–π stacking. So far, in solution no evidence was found for such interactions. Thus, these observations must be further investigated for conclusive explanation.
2.4. Single‐Crystal X‐ray Diffraction (SC‐XRD): Characterization of the Mononuclear Complex [UO2(H6L)(NO3)](NO3)⋅6 MeCN (1⋅6 MeCN)
Claret‐violet crystals of 1⋅6 MeCN suitable for X‐ray crystallographic analysis were obtained by slow evaporation of an acetonitrile solution containing H6L and UO2(NO3)2 ⋅6 H2O in a 1:2 molar ratio. Complex 1⋅6 MeCN crystallizes in the triclinic, P space group. The asymmetric unit comprises one molecule of [UO2(H6L)(NO3)](NO3) and six acetonitrile molecules. As observed in many other calix[4]arene structures,52 one acetonitrile molecule is situated in the calix[4]arene cavity held in place by three CH⋅⋅⋅π interactions with the aromatic rings [average diameter (C⋅⋅⋅centroid) = 3.61 Å]. The residual solvent molecules fill the interstitial space between the complex molecules. Figure 5 (left) shows the molecular structure of [UO2(H6L)(NO3)](NO3) (1).
Figure 5.

ORTEP representation of [UO2(H6L)(NO3)](NO3) (1) in crystals of 1⋅6 MeCN (left) and perspective view of the coordination unit showing the hexagonal bipyramidal coordination geometry of the uranyl ion (right). Thermal ellipsoids are drawn at the 50 % probability level. All hydrogen atoms, except those bonded to N and O, as well as the space‐filling acetonitrile molecules are omitted for clarity. Color code: C, gray; H, white; N, blue; O, red; U, green. Coordinating bond lengths and angles are collected in Tables S2 and S3. Selected distances [Å] and angles [°]: O1⋅⋅⋅O2 2.787(5), O3⋅⋅⋅O4 2.875(5), O2⋅⋅⋅N4 2.965(3), O2−H2⋅⋅⋅O1 170.8(7), O4−H40⋅⋅⋅O3 171.3(8), N4−H4N⋅⋅⋅O2 169.1(7), N3−O14 2.703(2), N3−H3⋅⋅⋅O14 165.5(1).
The uranyl ion is coordinated by one tetradentate 8‐hydroxyquinoline–hydrazone–carbonyl substituent from H6L. In contrast to the recently reported EuIII complex,9 the carbonyl–hydrazone unit is not in its deprotonated enol form (=N−N=CR−O−), but rather, the hydroxy group of the 8‐hydroxyquinoline unit is deprotonated. Thus, to balance the positive charge of the metal ion (+2), one nitrate ion coordinates to UVI in a bidentate chelating mode besides the hydroxyquinolinolate. The U1 ion has a hexagonal bipyramidal coordination environment with the two uranyl oxygen atoms (O9, O10) occupying the axial positions, as expected. In addition, two oxygen atoms and two nitrogen atoms from H6L as well as two oxygen atoms from the nitrate co‐ligand saturate the coordination number of the metal ion (Figure 5). The U−O bond lengths range from 2.303(8) to 2.515(7) Å, and the U−N distances are 2.576(9) and 2.634(9) Å in the equatorial plane, which is in good agreement with structure‐related UVI complexes reported in the literature.27, 53 The linear arrangement of the uranyl ion is evidenced by the O9=U1=O10 angle of 177.5(3)°. The calix[4]arene scaffold adopts a nearly ideal cone conformation with dihedral angles of the calix[4]arene mean plane of average 67° for the carbonyl–hydrazone‐substituted rings and 54 and 58° for the unsubstituted aromatic units. Additionally, the cone conformation is stabilized by the typical intramolecular OH⋅⋅⋅O hydrogen bonds between the phenolic hydrogen atom and the adjacent oxygen atoms at the lower rim (see caption of Figure 5). As illustrated in Figure 5, further intramolecular and intermolecular NH⋅⋅⋅O hydrogen‐bonding interactions between the lower rim of the calix[4]arene and the coordinating hydrazone unit as well as the protonated 8‐hydroxyquinoline and the nitrate counterion are observed. Moreover, weak intramolecular π–π stacking interactions between the 8‐hydroxyquinoline units stabilize the close packing of the structure. The average centroid⋅⋅⋅centroid distance between these heteroaromatic units is 3.64 Å (Figure S5).
2.5. Quantum Chemistry: Theoretical Studies of the Dinuclear Complex [(UO2)2(H4L)(NO3)2]
To gain better understanding of the structure of the 2:1 complex, we performed quantum‐chemical calculations at the DFT level by using the BP86 functional.54 Several starting structures, in which the side chains were put in different positions to allow for the bulkiness of the complex, were generated. The optimizations were performed with the Turbomole code55 by using the def2‐SV(P)56 basis set for all atoms and the Stuttgart small core ECP57 for the uranium atoms to include scalar relativistic effects. The dispersion correction58 was used, and the effect of the solvent was included with the conductor like screening model (COSMO)59 and the dielectric constant for acetonitrile (37.5). Figure 6 shows the resulting structure that is lowest in energy. Notably, the uranyl units in this structure remain relatively close. This seems to be helped by dispersion interactions between the uranyl oxygen atom and the other side chain.
Figure 6.

Optimized structure of [(UO2)2(H4L)(NO3)2] (2).
In summary, both solid‐state results (SC‐XRD, DFT) evidence the deprotonation of the phenolic OH group of the heteroaromatic unit due to the high affinity of the uranyl ion towards oxygen atoms. The ability of acetonitrile as an aprotic solvent to stabilize a proton is quite low. This might be the reason for the shift of the proton from the OH group to the nitrogen atom in the molecular structure of 1 (see Figure 5). It could be speculated that in the structure of the 2:1 species no nitrogen donor atom is able (free) to stabilize the abstracted proton of the coordinating hydroxy group. However, a solid‐state structure need not to be a species that is detectable in solution, and a complex formed in acetonitrile solution does not coercively have a relationship to the structure of the extracted species in chloroform. Nevertheless, the reported structures can be seen as a proof of concept for the preferred binding site of the uranyl ion even for structures in solution.
2.6. Liquid–Liquid Extraction: Separation Ability of H6L for UVI
To determine experimental conditions for the selective extraction of UVI from lanthanide‐containing solutions, aqueous phases containing 10 μm EuIII and 10 μm UVI were extracted by 40 μm H6L in chloroform as a function of pH value. The extraction curves (Figure 7) show the effective transfer of UVI and EuIII by H6L from the aqueous phase to the organic phase depending on the pH value of the aqueous phase. Over a wide pH range (pH=4–9), UVI was extracted in nearly quantitative yield (90–100 %) in just one extraction step. For uranium, we propose that a 1:1 complex is formed during extraction at pH 6, and this is substantiated by distribution experiments (Figure S6). Moreover, under the given conditions, UVI could be entirely separated from EuIII between pH 4 and 6, because EuIII was extracted only at higher pH values (pH≈8). On the basis of these extraction results, orienting separation factors (SFU/Eu) were calculated (Table S4). At an optimal pH of 5–6, separation factors of about 6000 were determined.
Figure 7.

Extraction of 10 μm UVI+10 μm EuIII by 40 μm H6L in the pH range of 2 to 9; 13 mm sodium tetraborate buffer. Note: error bars for UVI extraction are smaller than the EuIII error bars, indicating additionally a weaker influence of the degree of protonation of H6L in the extraction of the actinide ion.
The pH dependence observed for the extraction of divalent uranyl and trivalent europium cations can be attributed to the different degrees of deprotonation of the ligand due to coordination of the respective metal. According to Jäschke et al., EuIII extraction requires threefold deprotonation of the H6L ligand, which is ensured at higher pH values on the basis of the pK a values of the hydrazone and 8‐hydroxyquinoline units.9 In contrast, only a single deprotonation (OH group of hydroxyquinoline) of the ligand is necessary for UVI coordination, and therefore, UVI is already extracted at lower pH values. These findings agree well with solvent extractions performed by Favre‐Réguillon, who extracted uranyl by using 8‐hydroxyquinoline. Favre‐Réguillon observed comparably good extraction percentages for pH values higher than 4.28 However, compared to our experiments, it was necessary to use a much higher extractant/UVI ratio up to 50. Hence, the combination of the rigid calix[4]arene backbone with the chelating heterocyclic compound enhances the efficiency of the resulting extracting agent.
3. Conclusions
Functionalization of the calix[4]arene backbone with 8‐hydroxyquinoline resulted in a promising macrocyclic ligand system with a high affinity towards uranyl. Elucidation of the complexing mechanism in solution as well as in the solid state significantly contributed to understanding of the process, which is an important and fundamental step towards making calixarenes processable and profitable for the separation of uranium from environmentally relevant solutions. In a first step, the formation of new uranyl calix[4]arene‐based 8‐hydroxyquinoline complexes in non‐aqueous solution was verified by means of a variety of spectroscopic, calorimetric, and crystallographic methods. Hence, the coordination properties and complex structures were clarified on a molecular level. It was shown that there was a dynamic equilibrium of different complex species in solution. Moreover, the reported solid‐state structures substantiated the preferred binding site of the ligand for the uranyl ion and verified the affinity of the uranyl ion towards oxygen atoms, resulting in deprotonation of H6L even in an aprotic solvent.
In liquid–liquid extraction experiments, we successfully demonstrated the ability of H6L to separate UVI from EuIII on the basis of pH variation. Complexation studies and distribution experiments showed that different degrees of deprotonation of the hydroxyquinoline and hydrazone residues were responsible. Additionally, we proved that the combination of the rigid calix[4]arene backbone with chelating 8‐hydroxyquinoline resulted in an extracting agent with higher efficiency than the parent ones. Thus, application of the ligand for the selective separation of UVI from rare‐earth concentrates of leached ores is conceivable.
Experimental Section
Chemicals and Reagents
CAUTION! Natural uranium consists of radioactive nuclides, including long‐lived α‐emitters (235U, t 1/2=7.04×108 years and 238U, t 1/2=4.47×109 years) and is also chemically toxic. Special precautions as well as appropriate equipment and facilities for radiation protection are required to handle this material.
Acetonitrile (VWR), chloroform (Sigma–Aldrich), methanol (VWR), NaOH (Merck), UO2(NO3)2 ⋅6 H2O (Chemapol), Eu(NO3)3 ⋅6 H2O (Alfa Aesar), HClO4 (Merck), anhydrous NaClO4 (Alfa Aesar), and Na2B4O7 ⋅10 H2O (Merck) were used as purchased from commercial sources without further purification. For the mobile phase of ESI‐TOF MS, acetonitrile was obtained from Roth (HPLC grade). In all calorimetric and spectroscopic investigations, the ionic strength was adjusted to 0.01 m NaClO4. Generally, all experiments were performed at (25±0.02) °C under atmospheric conditions. The pH was adjusted by using a WTW pH benchtop meter (Portable meter ProfiLine pH 3110) equipped with a WTW pH microelectrode. A three‐point calibration at room temperature with technical calibration buffers (HANNA instruments) was routinely performed before pH adjustment.
Synthesis
5,11,17,23‐Tetra‐p‐tert‐butyl‐25,27‐bis[(8‐hydroxyquinolinecarbaldehyde‐hydrazone‐carbonylmethoxy)]‐26,28‐dihydroxycalix[4]arene (H6L): Synthesized as previously described.9
[UO2(H6L)(NO3)](NO3)⋅6 MeCN (1⋅6 MeCN): H6L (20 mg, 18 μmol) was suspended in acetonitrile (5 mL), and a solution of UO2(NO3)2 ⋅6 H2O (18 mg, 36 μmol) in acetonitrile was added. After 10 days, claret‐violet crystals of 1⋅6 MeCN were obtained by slow evaporation of the solvent. The crystals were washed with acetonitrile and dried in air. Crystals of 1⋅6 MeCN quickly lost MeCN molecules of solvation upon standing in air and turned dull. Yield: 8 mg (31 %); IR (ATR): =1699 [ν(C=O)], 1680 [δ(C−N−H)], 1601 [ν(C=N)], 1190 [ν(C−O)], 950 cm−1 [νs(O=U=O)]; UV/Vis (MeCN): λ max (ϵ [L mol−1 cm−1])=200 (12465), 316 (6260), 350 (4337), 365 (1221), 511 nm (841); MS (ESI+, MeCN): m/z=1434.6 [UO2(H5L)(NO3)+H+]+; elemental analysis calcd (%) for C68H74N8O16U+MeCN (1537.6+41.0): calcd C 54.65, H 5.05, N 8.19; found C 54.01, H 6.01, N 7.83.
UV/Vis Spectroscopy
Spectrophotometric titration was performed by using a sample series with a constant H6L concentration of 12.5 μm and a UO2(NO3)2 ⋅6 H2O concentration varying from 0 to 70.8 μm. Spectrophotometric measurements were performed with a TIDAS 100 spectrophotometer (J&M Analytik) in the wavelength region of 250 to 700 nm with a 0.1 nm interval by using 10 mm quartz glass cuvettes. To detect a weak absorption band between λ=400 and 700 nm, the measurements were repeated at a reactant concentration that was four times higher, and quartz glass cuvettes with a path length of 50 mm were used. The Job's method was applied to determine the reactant stoichiometry.60, 61, 62 For this, a series of samples, for which the molar ratio of H6L to UO2(NO3)2 ⋅6 H2O was varied and the total concentration of 100 μm was kept constant, were prepared. The absorbance was recorded in 50 mm quartz glass cuvettes at λ=520 nm. The complex stability constants were calculated by the nonlinear regression program HypSpec (version 1.1.18, Protonic Software).63 In the fitting process, the pH was not considered, as acetonitrile is an aprotic solvent.
Electrospray Ionization Time‐of‐Flight Mass Spectrometry
Molecular weight analysis of free calix[4]arene H6L and its uranyl complexes was performed by time‐of‐flight mass spectrometry (6538 UHD Accurate‐Mass Q‐TOF LC–MS, Agilent) in negative‐ion mode. A sample series with a constant H6L concentration of 100 μm and a UO2(NO3)2 ⋅6 H2O concentration varying in the range of 0 to 200 μm in 80 % acetonitrile/20 % methanol were analyzed. To generate charged molecules, methanol was added to the aprotic solvent acetonitrile. The fragmentor voltage was kept at 110 V, the capillary voltage was set to 4 kV, the gas temperature was set to 350 °C, the nebulizer pressure was set to 13.685 kPa, and the nitrogen gas flow was set to 11 L min−1. For each measurement, the sample (10 μL) was directly introduced into the mass spectrometer by HPLC (1200 Series, Agilent). Acetonitrile was used as the mobile phase at a flow rate of 0.4 mL min−1. Mass spectra were recorded in the mass‐to‐charge range of m/z=100 to 2000.
Isothermal Titration Calorimetry
Calorimetric titrations were performed to determine the enthalpy of complexation with a TAM III calorimeter (TA Instruments) based on the principle of heat conduction. The calorimeter was calibrated by the built‐in dynamic calibration method. The measurements were performed in acetonitrile. First, a 5 mm UO2(NO3)2 ⋅6 H2O solution (2 μL) was injected into the sample vial prefilled with 100 μm H6L solution (1.8 mL). The following 35 injections were adjusted to 5 μL with time intervals of 7 min and stirred with 80 rpm. The reference experiment was performed exactly the same, but without the metal salt. OriginPro 2015G (OriginLab) was used for baseline adjustment and peak integration of the thermograms. The obtained heat values were corrected by the heat value of titrant dilution, which was measured in a separate run (for detailed information, see Figure S8).
Single‐Crystal X‐ray Diffraction
Claret‐violet crystals of 1⋅6 MeCN suitable for X‐ray structure determination were obtained by slow evaporation of an acetonitrile solution containing H6L (18 μmol) and UO2(NO3)2 ⋅6 H2O (2 equiv.) within 10 days. Crystals were selected under a polarizing optical microscope and were mounted on a Micro‐Loop TM (MiTiGen, USA) with mineral oil for single‐crystal X‐ray diffraction measurements. Single crystals were analyzed with a Bruker D8 VENTURE diffractometer with a PHOTON 100 CMOS detector at 273 K (71 h) and microfocus Mo Kα radiation (λ=0.71073 Å). Crystallographic parameters and details on crystal structure determination are listed in Table S1. Several sets of narrow data frames were collected at different values of θ for two initial values of ϕ and ω, respectively. Data reduction was performed by using SAINT (Version 8.37A).64 The substantial redundancy in data allowed a semiempirical absorption correction (SADABS‐2016/2)65 to be applied on the basis of multiple measurements of equivalent reflections. The structure was solved by intrinsic phasing (SHELXT, Version 2014/5),66 developed by successive difference Fourier syntheses and was refined by full‐matrix least‐squares on all F2 data by using the SHELXL program suite (Version 2014‐7)67 and ShelXl.68 Integration of the data using a triclinic unit cell (Z=2) yielded a total of 12531 reflections to a maximum θ angle of 19.03° (1.09 Å resolution), of which 6348 were independent (average redundancy 1.974, completeness=99.9 %, R int=1.85 %, Rsig=2.46 %) and 5614 (88.44 %) were greater than 2 σ(F2). The final anisotropic full‐matrix least‐squares refinement on F2 with 947 variables converged at R1=5.20 % for the observed data and wR2=13.80 % for all data. The goodness‐of‐fit was 1.060. Hydrogen atoms of the phenyl rings were initially placed at the calculated positions and were allowed to ride on the parent atoms. The final refinements included anisotropic thermal parameters of all non‐hydrogen atoms. The largest peak in the final difference electron density synthesis was 4.975 e Å−3 and the largest hole was −1.032 e Å−3 with a root‐mean‐square deviation of 0.116 e Å−3. This residual density located 1.77 Å from C31 is probably due to a highly disordered nitrate ion. Attempts to model this disorder were not successful due to poor resolution of the measurement. Other explanations (e.g. directly bound atoms) could be ruled out because of steric hindrance and chemical restrictions.
CCDC 1581423 http://www.ccdc.cam.ac.uk/cgi-bin/catreq.cgi (1⋅6 MeCN) contains the supplementary crystallographic data for this paper.69
Liquid–Liquid Extraction
The extraction of UVI and EuIII from the aqueous phase by H6L in chloroform was performed at pH=2–9. The general extraction procedure was as follows: The respective aqueous phase contained 10 μm EuIII and 10 μm UVI. The pH value was adjusted by using diluted NaOH and HClO4 solutions. Sodium tetraborate decahydrate was used as a pH buffer at a concentration of 13 mm. A 4 mL aliquot of the aqueous phase was added to 4 mL of the organic phase containing 40 μm H6L. For liquid–liquid extraction PFA (perfluoralkoxy polymer) vials (AHF analysentechnik AG) were used. The two‐phase mixture was shaken for 12 h at 400 rpm by a Thermoshaker MKR 23 (Hettich Benelux B.V., Geldermalsen). After reaching equilibrium, the aqueous and organic phases were separated by centrifugation. Then, the pH of the aqueous phase was measured again. The initial and equilibrium concentrations of EuIII and UVI were determined by inductively coupled plasma mass spectrometry (ICP‐MS, Elan 9000, PerkinElmer). The extraction values were calculated as follows [Eq. (2)]:
| (2) |
Conflict of interest
The authors declare no conflict of interest.
Supporting information
As a service to our authors and readers, this journal provides supporting information supplied by the authors. Such materials are peer reviewed and may be re‐organized for online delivery, but are not copy‐edited or typeset. Technical support issues arising from supporting information (other than missing files) should be addressed to the authors.
Supplementary
Acknowledgements
We sincerely thank the Federal Ministry of Education and Research (SE‐FLECX, 033R132A/ 033R132E and FENABIUM, 02NUK046B) for funding this work. We thank Salim Shams Aldin Azzam and Karsten Heim for their help in performing the extraction experiments and ATR FTIR spectroscopy measurements.
A. Bauer, A. Jäschke, S. Schöne, R. Barthen, J. März, K. Schmeide, M. Patzschke, B. Kersting, K. Fahmy, J. Oertel, V. Brendler, T. Stumpf, ChemistryOpen 2018, 7, 467.
References
- 1. Kumari A., Panda R., Jha M. K., Kumar J. R., Lee J. Y., Miner. Eng. 2015, 79, 102–115. [Google Scholar]
- 2. Xie F., Zhang T. A., Dreisinger D., Doyle F., Miner. Eng. 2014, 56, 10–28. [Google Scholar]
- 3. Panak P. J., Geist A., Chem. Rev. 2013, 113, 1199–1236. [DOI] [PubMed] [Google Scholar]
- 4. Beltrami D., Cote G., Mokhtari H., Courtaud B., Moyer B. A., Chagnes A., Chem. Rev. 2014, 114, 12002–12023. [DOI] [PubMed] [Google Scholar]
- 5. Zhu Z. W., Pranolo Y., Cheng C. Y., Miner. Eng. 2015, 77, 185–196. [Google Scholar]
- 6. Eskandari Nasab M., Fuel 2014, 116, 595–600. [Google Scholar]
- 7. Amaral J. C. B. S., Morais C. A., Miner. Eng. 2010, 23, 498–503. [Google Scholar]
- 8. Ohto K., Matsufuji T., Yoneyama T., Tanaka M., Kawakita H., Oshima T., J. Inclusion Phenom. Macrocyclic Chem. 2011, 71, 489–497. [Google Scholar]
- 9. Jäschke A., Kischel M., Mansel A., Kersting B., Eur. J. Inorg. Chem. 2017, 894–901. [Google Scholar]
- 10. Glasneck F., Kobalz K., Kersting B., Eur. J. Inorg. Chem. 2016, 3111–3122. [Google Scholar]
- 11. Ohto K., Yano M., Inoue K., Yamamoto T., Goto M., Nakashio F., Shinkai S., Nagasaki T., Anal. Sci. 1995, 11, 893–902. [Google Scholar]
- 12. Danil de Namor A. F., Baron K., Chahine S., Jafou O., J. Phys. Chem. A 2004, 108, 1082–1089. [Google Scholar]
- 13. Shinkai S. J., Otsuka T. S., Araki K. J., Matsuda T., B. Chem. Soc. Jpn. 1989, 62, 4055–4057. [Google Scholar]
- 14. Mokhtari B., Pourabdollah K., Dallali N., J. Radioanal. Nucl. Chem. 2011, 287, 921–934. [Google Scholar]
- 15. Deligöz H., Erdem E., J. Hazard. Mater. 2008, 154, 29–32. [DOI] [PubMed] [Google Scholar]
- 16. Schmeide K., Heise K. H., Bernhard G., Keil D., Jansen K., Praschak D., J. Radioanal. Nucl. Chem. 2004, 261, 61–67. [Google Scholar]
- 17. Harrowfield J. M., Ogden M. I., White A. H., J. Chem. Soc. Dalton 1991, 979–985. [Google Scholar]
- 18. Harrowfield J. M., Ogden M. I., White A. H., J. Chem. Soc. Dalton 1991, 2625–2632. [Google Scholar]
- 19. Harrowfield J. M., Ogden M. I., Richmond W. R., White A. H., J. Chem. Soc. Dalton 1991, 2153–2160. [Google Scholar]
- 20. Danil de Namor A. F., Jafou O., J. Phys. Chem. B 2001, 105, 8018–8027. [Google Scholar]
- 21. Sanz S., McIntosh R. D., Beavers C. M., Teat S. J., Evangelisti M., Brechin E. K., Dalgarno S. J., Chem. Commun. 2012, 48, 1449–1451. [DOI] [PubMed] [Google Scholar]
- 22. Kiegiel K., Steczek L., Zakrzewska-Trznadel G., J. Chem-NY. 2013, 762819. [Google Scholar]
- 23. Talotta C., Gaeta C., De Rosa M., Soriente A., Neri P. in Reference Module in Chemistry, Molecular Sciences and Chemical Engineering, Comprehensive Supramolecular Chemistry II, Elsevier, 2017, pp. 49–74. [Google Scholar]
- 24. Roundhill D. M., Prog. Inorg. Chem. 1995, 43, 533–592. [Google Scholar]
- 25. Sliwa W., Girek T., J. Inclusion Phenom. Macrocyclic Chem. 2010, 66, 15–41. [DOI] [PMC free article] [PubMed] [Google Scholar]
- 26. Chinta J. P., Ramanujam B., Rao C. P., Coord. Chem. Rev. 2012, 256, 2762–2794. [Google Scholar]
- 27. Mirzaei M., Hassanpoor A., Bauza A., Mague J. T., Frontera A., Inorg. Chim. Acta 2015, 426, 136–141. [Google Scholar]
- 28. Favre-Réguillon A., Murat D., Cote G., Draye M., J. Chem. Technol. Biotechnol. 2012, 87, 1497–1501. [Google Scholar]
- 29. Tian M., Jia Q., Liao W., J. Rare Earths 2013, 31, 604–608. [Google Scholar]
- 30. Wu D., Zhang Q., Bao B., Hydrometallurgy 2007, 88, 210–215. [Google Scholar]
- 31. Tian M., Song N., Wang D., Quan X., Jia Q., Liao W., Lin L., Hydrometallurgy 2012, 111–112, 109–113. [Google Scholar]
- 32. Bunus F. T., Min. Pro. Ext. Met. Rev. 2000, 21, 381–478. [Google Scholar]
- 33. Jakhu R., Mehra R., Mittal H. M., Environ. Sci. Process Impacts 2016, 18, 1540–1549. [DOI] [PubMed] [Google Scholar]
- 34. Frisbie S. H., Mitchell E. J., Mastera L. J., Maynard D. M., Yusuf A. Z., Siddiq M. Y., Ortega R., Dunn R. K., Westerman D. S., Bacquart T., Sarkar B., Environ. Health Perspect. 2009, 117, 410–416. [DOI] [PMC free article] [PubMed] [Google Scholar]
- 35. Periyakaruppan A., Kumar F., Sarkar S., Sharma C. S., Ramesh G. T., Arch. Toxicol. 2007, 81, 389–395. [DOI] [PMC free article] [PubMed] [Google Scholar]
- 36. Leggett R. W., Health Phys. 1994, 67, 589–610. [DOI] [PubMed] [Google Scholar]
- 37. Puncher M., Birchall A., Bull R. K., Radiat. Prot. Dosim. 2013, 156, 131–140. [DOI] [PubMed] [Google Scholar]
- 38. Haneklaus N., Sun Y., Bol R., Lottermoser B., Schnug E., Environ. Sci. Technol. 2017, 51, 753–754. [DOI] [PubMed] [Google Scholar]
- 39. Gabriel S., Baschwitz A., Mathonniere G., Eleouet T., Fizaine F., Ann. Nucl. Energy 2013, 58, 213–220. [Google Scholar]
- 40. Kaim W., Ernst S., Kohlmann S., Chem. Unserer Zeit 1987, 21, 50–58. [Google Scholar]
- 41. Karavan M., Arnaud-Neu F., Hubscher-Bruder V., Smirnov I., Kalchenko V., J. Inclusion Phenom. Macrocyclic Chem. 2010, 66, 113–123. [Google Scholar]
- 42. Yamamoto K., Higuchi M., Shiki S., Tsuruta M., Chiba H., Nature 2002, 415, 509–511. [DOI] [PubMed] [Google Scholar]
- 43. Nowicka J. T., J. Inorg. Nucl. Chem. 1971, 33, 2043–2045. [Google Scholar]
- 44. Schmidt E., Zhang H., Chang C. K., Babcock G. T., Oertling W. A., J. Am. Chem. Soc. 1996, 118, 2954–2961. [Google Scholar]
- 45. Ulatowski F., Dabrowa K., Balakier T., Jurczak J., J. Org. Chem. 2016, 81, 1746–1756. [DOI] [PubMed] [Google Scholar]
- 46. Brynn Hibbert D., Thordarson P., Chem. Commun. 2016, 52, 12792–12805. [DOI] [PubMed] [Google Scholar]
- 47. Le V. H., Buscaglia R., Chaires J. B., Lewis E. A., Anal. Biochem. 2013, 434, 233–241. [DOI] [PMC free article] [PubMed] [Google Scholar]
- 48. Wu Q., Sun T., Meng X., Chen J., Xu C., Inorg. Chem. 2017, 56, 3014–3021. [DOI] [PubMed] [Google Scholar]
- 49. Jensen M. P., Morss L. R., Beitz J. V., Ensor D. D., J. Alloys Compd. 2000, 303, 137–141. [Google Scholar]
- 50. Brown M. A., Kropf A. J., Paulenova A., Gelis A. V., Dalton Trans. 2014, 43, 6446–6454. [DOI] [PubMed] [Google Scholar]
- 51. Schmidtchen F. P., Chem. Eur. J. 2002, 8, 3522–3529. [DOI] [PubMed] [Google Scholar]
- 52. Gutsche C. D., Calixarenes: An Introduction, 2nd ed., Royal Society of Chemistry, Cambridge, 2008. [Google Scholar]
- 53. Tsantis S. T., Zagoraiou E., Savvidou A., Raptopoulou C. P., Psycharis V., Szyrwiel L., Holynska M., Perlepes S. P., Dalton Trans. 2016, 45, 9307–9319. [DOI] [PubMed] [Google Scholar]
- 54. Dirac P. A. M., Proc. R. Soc. London 1929, 123, 714. [Google Scholar]
- 55. Ahlrichs R., Bär M., Häser M., Horn H., Koelmel C., Chem. Phys. Lett. 1989, 162, 165–169. [Google Scholar]
- 56. Schäfer A., Horn H., Ahlrichs R., J. Chem. Phys. 1992, 97, 2571–2577. [Google Scholar]
- 57. Cao X., Dolg M., J. Mol. Struct. THEOCHEM 2004, 673, 203–209. [Google Scholar]
- 58. Grimme S., Antony J., Ehrlich S., Krieg H., J. Chem. Phys. 2010, 132, 154104. [DOI] [PubMed] [Google Scholar]
- 59. Klamt A., Schüürmann G., J. Chem. Soc. Perkin Trans. 2 1993, 799–805. [Google Scholar]
- 60. Gil V. M. S., Oliveira N. C., J. Chem. Educ. 1990, 67, 473–478. [Google Scholar]
- 61. Olson E. J., Buhlmann P., J. Org. Chem. 2011, 76, 8406–8412. [DOI] [PubMed] [Google Scholar]
- 62. Renny J. S., Tomasevich L. L., Tallmadge E. H., Collum D. B., Angew. Chem. Int. Ed. 2013, 52, 11998–12013; [DOI] [PMC free article] [PubMed] [Google Scholar]; Angew. Chem. 2013, 125, 12218–12234. [Google Scholar]
- 63. Gans P., Sabatini A., Vacca A., Talanta 1996, 43, 1739–1753. [DOI] [PubMed] [Google Scholar]
- 64.Bruker, SAINT, 2015.
- 65. Krause L., Herbst-Irmer R., Sheldrick G. M., Stalke D., J. Appl. Crystallogr. 2015, 48, 3–10. [DOI] [PMC free article] [PubMed] [Google Scholar]
- 66. Sheldrick G. M., Acta Crystallogr. Sect. A 2015, 71, 3–8. [DOI] [PMC free article] [PubMed] [Google Scholar]
- 67. Sheldrick G. M., Acta Crystallogr. Sect. C 2015, 71, 3–8. [DOI] [PMC free article] [PubMed] [Google Scholar]
- 68. Hübschle C. B., Sheldrick G. M., Dittrich B., J. Appl. Crystallogr. 2011, 44, 1281–1284. [DOI] [PMC free article] [PubMed] [Google Scholar]
- 69.CCDC https://www.ccdc.cam.ac.uk/services/structures?id=doi:10.1002/open.201800085 contains the supplementary crystallographic data for this paper. These data can be obtained free of charge from http://www.ccdc.cam.ac.uk/.
Associated Data
This section collects any data citations, data availability statements, or supplementary materials included in this article.
Supplementary Materials
As a service to our authors and readers, this journal provides supporting information supplied by the authors. Such materials are peer reviewed and may be re‐organized for online delivery, but are not copy‐edited or typeset. Technical support issues arising from supporting information (other than missing files) should be addressed to the authors.
Supplementary